 sei
seiTo check if the geometry is ok I wrote a little python script to calculate the area which the plotter arms can acces:
import math
import matplotlib.pyplot as plt
from matplotlib.patches import Rectangle
from planar import Vec2

al = 0.75 #arm length [m]
f = 0.75 #position of rail a [m]

apos = [2 * x * 0.005 for x in range(1, 200)]
bpos = [2 * x * 0.005 for x in range(1, 200)]

cx = []
cy = []

for x_a in apos:
    for x_b in bpos:
        a = Vec2(x_a,f) # vector to position on arm a
        b = Vec2(x_b,0) # vector to position on arm b

        cl = (b-a).length #distance between a and b

        #calculate height of triangle which is spanned by the arms
        hl = 2*((al**2)*(al**2)+(al**2)*(cl**2)+(cl**2)*(al**2))-(al**4+al**4+cl**4)

        if hl > 0:
            # finish calculation of height
            hl = math.sqrt(hl)/(2*cl)

            #vector from a to b
            d = (b-a)
            d = d/d.length

            # turn d around by 90°, h points to tip of triangle
            h = Vec2(d.y,-d.x)

            # normalize h
            h = h/h.length

            # calculate distance to tip set as length of d
            d *= math.sqrt(al ** 2 - hl ** 2)

            # vector which points to the tip of the triangle
            c = a+d+h*hl

            #save coordinates of tip
            cx.append(c.x)
            cy.append(c.y)

plt.plot([min(apos),max(apos)],[f,f],'r')
plt.plot([min(bpos),max(bpos)],[0,0],'g')
ax = plt.gca()

points = plt.plot(cx,cy,'o')
plt.setp(points,'color', 'b', 'marker', '.', 'markersize', 0.5)

plt.axes().set_aspect('equal')

plt.xlim([-0.7,2.7])
plt.ylim([-0.05,0.8])
plt.xlabel('x [m]')
plt.ylabel('y [m]')
plt.show()
Running the script gives the following plot:
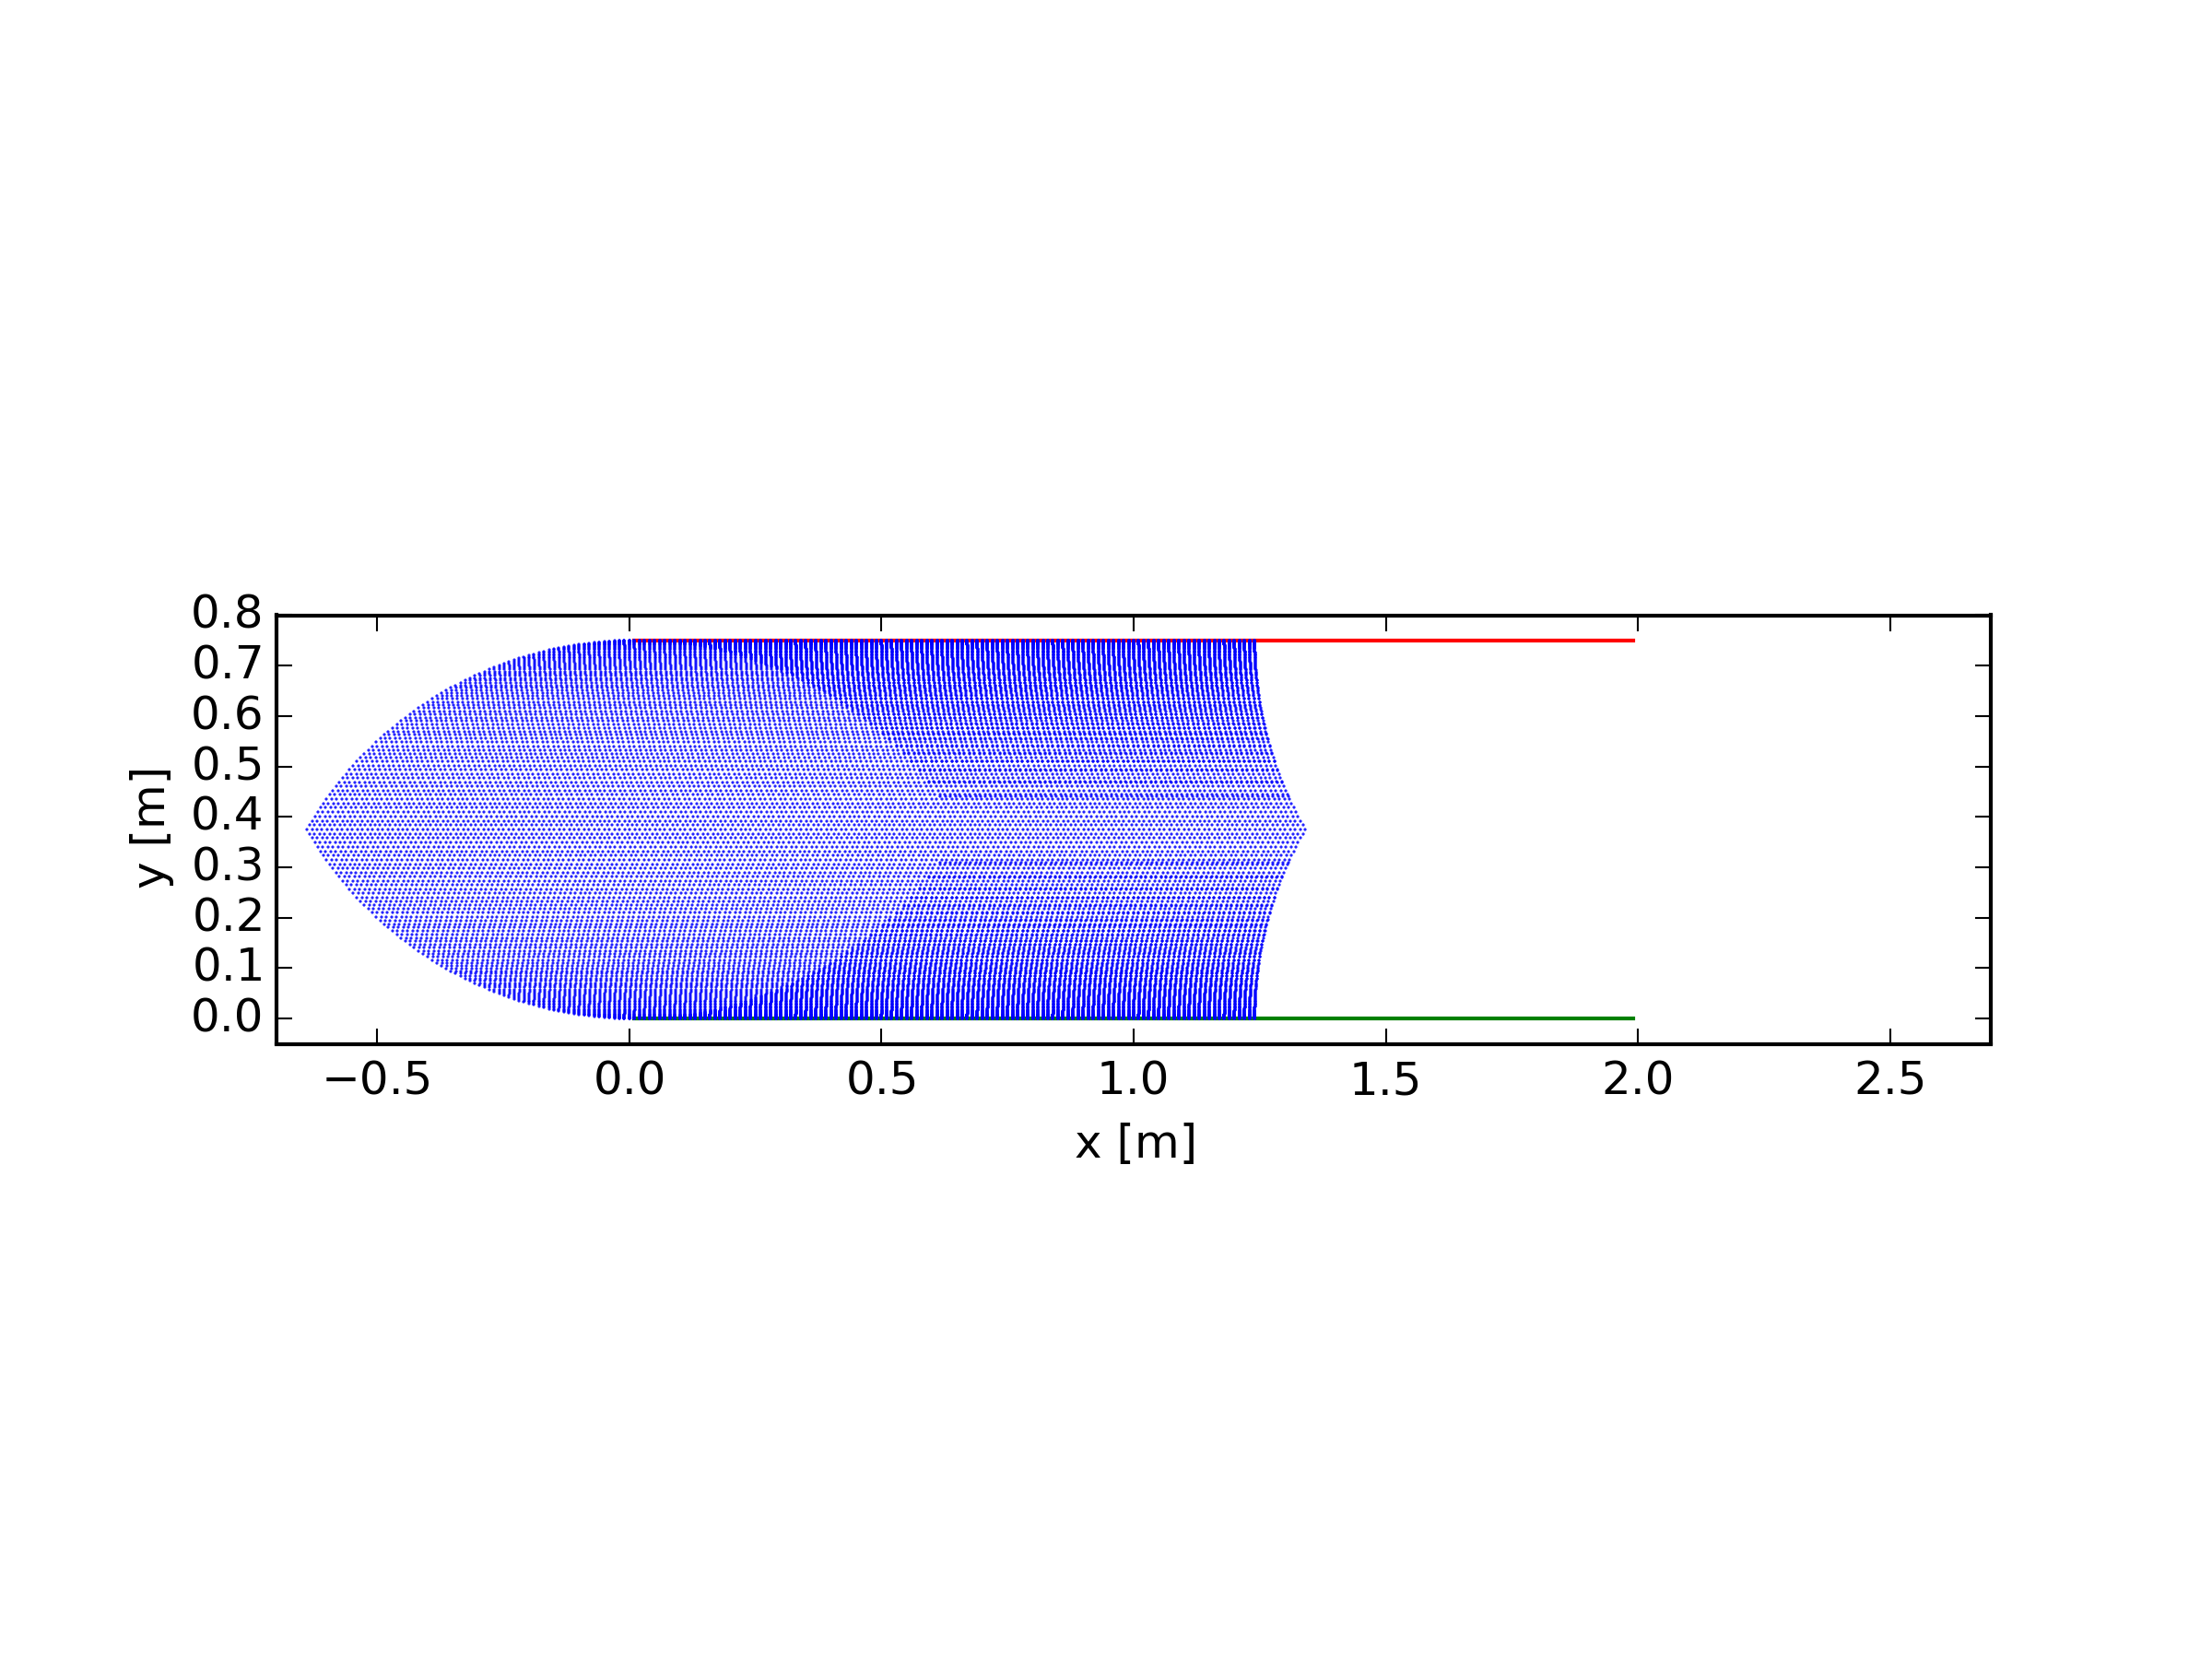
The blue area is what the plotter can reach, the density of the dots is a measure for the resolution. Luckily the density is pretty homogenious, so the resolution of the plotter will be more or less constant over the whole drawin area.
Also one might wonder what with the empty space on the right, I'll show that in a follow up.
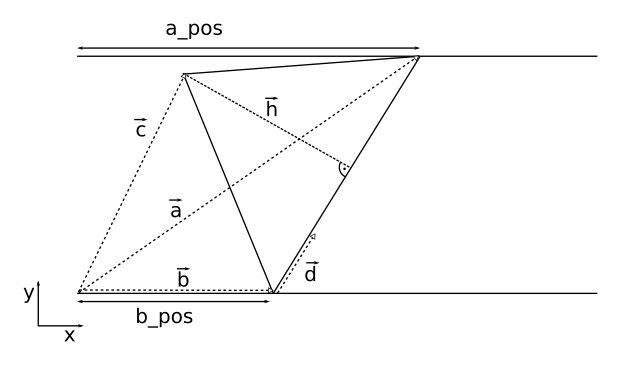
Here's also a little sketch which shows what the calculations in the script are based on:
Discussions
Become a Hackaday.io Member
Create an account to leave a comment. Already have an account? Log In.
Great idea! What color scheme "theme" are you using for your code snippet?
Are you sure? yes | no
Hopefully it'll work out :) I'm using the python theme, but I was also wondering why the comments don't have a different color than the code.
Are you sure? yes | no