 Open Green Energy
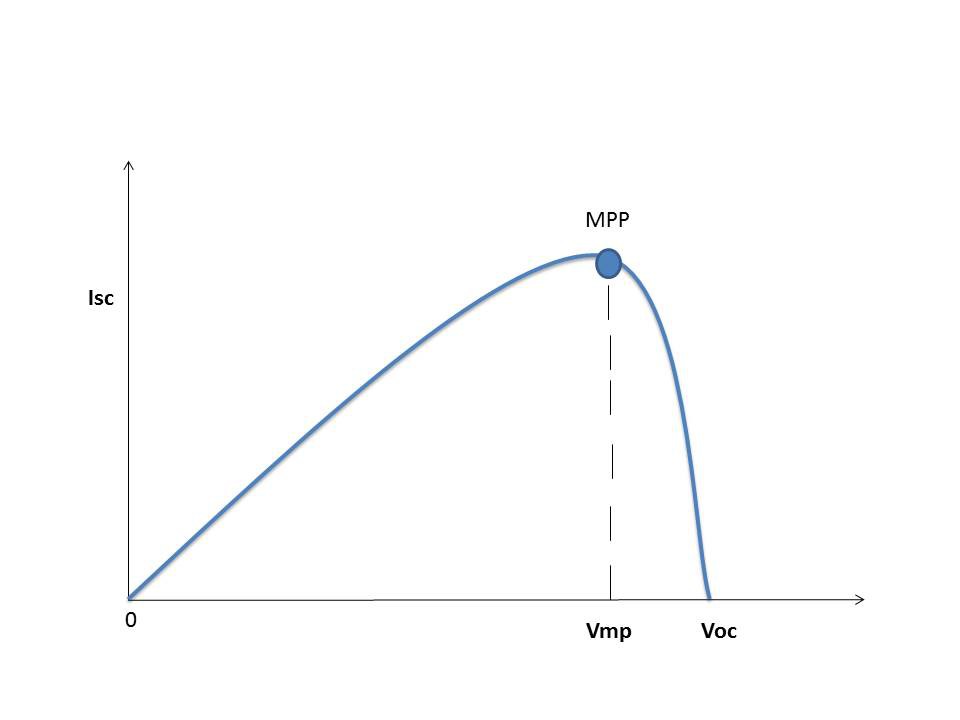
MPPT stands for Maximum Power Point Tracking. MPPT charge controllers used for extracting maximum available power from PV module under certain conditions.The Maximum Power Point Tracker (MPPT) circuit is based around a synchronous buck converter circuit.It steps the higher solar panel voltage down to the charging voltage of the battery. The Arduino tries to maximize the watts input from the solar panel by controlling the duty cycle to keep the solar panel operating at its Maximum Power Point.
You can find more details on MPPT here
Algorithm :

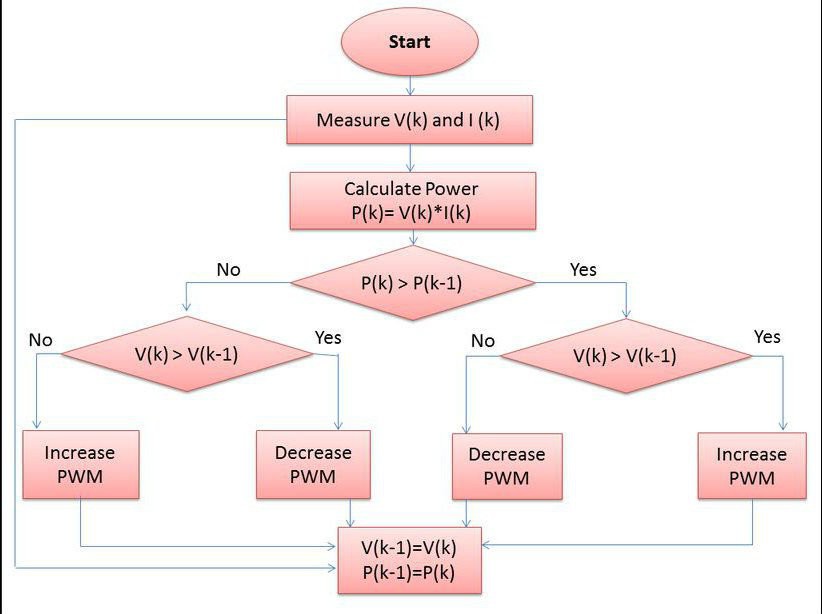
The Maximum Power Tracker uses an iterative approach to finding this constantly changing MPP. This iterative method is called Perterb and Observe or hill climbing algorithm.To achieve MPPT, the controller adjusts the voltage by a small amount from the solar panel and measures power, if the power increases, further adjustments in the direction are tried until power no longer increases.
The voltage to the solar panel is increased initially, if the output power increase, the voltage is continually increased until the output power starts decreasing. Once the output power starts decreasing, the voltage to the solar panel decreased until maximum power is reached. This process is continued until the MPPT is attained. This result is an oscillation of the output power around the MPP.
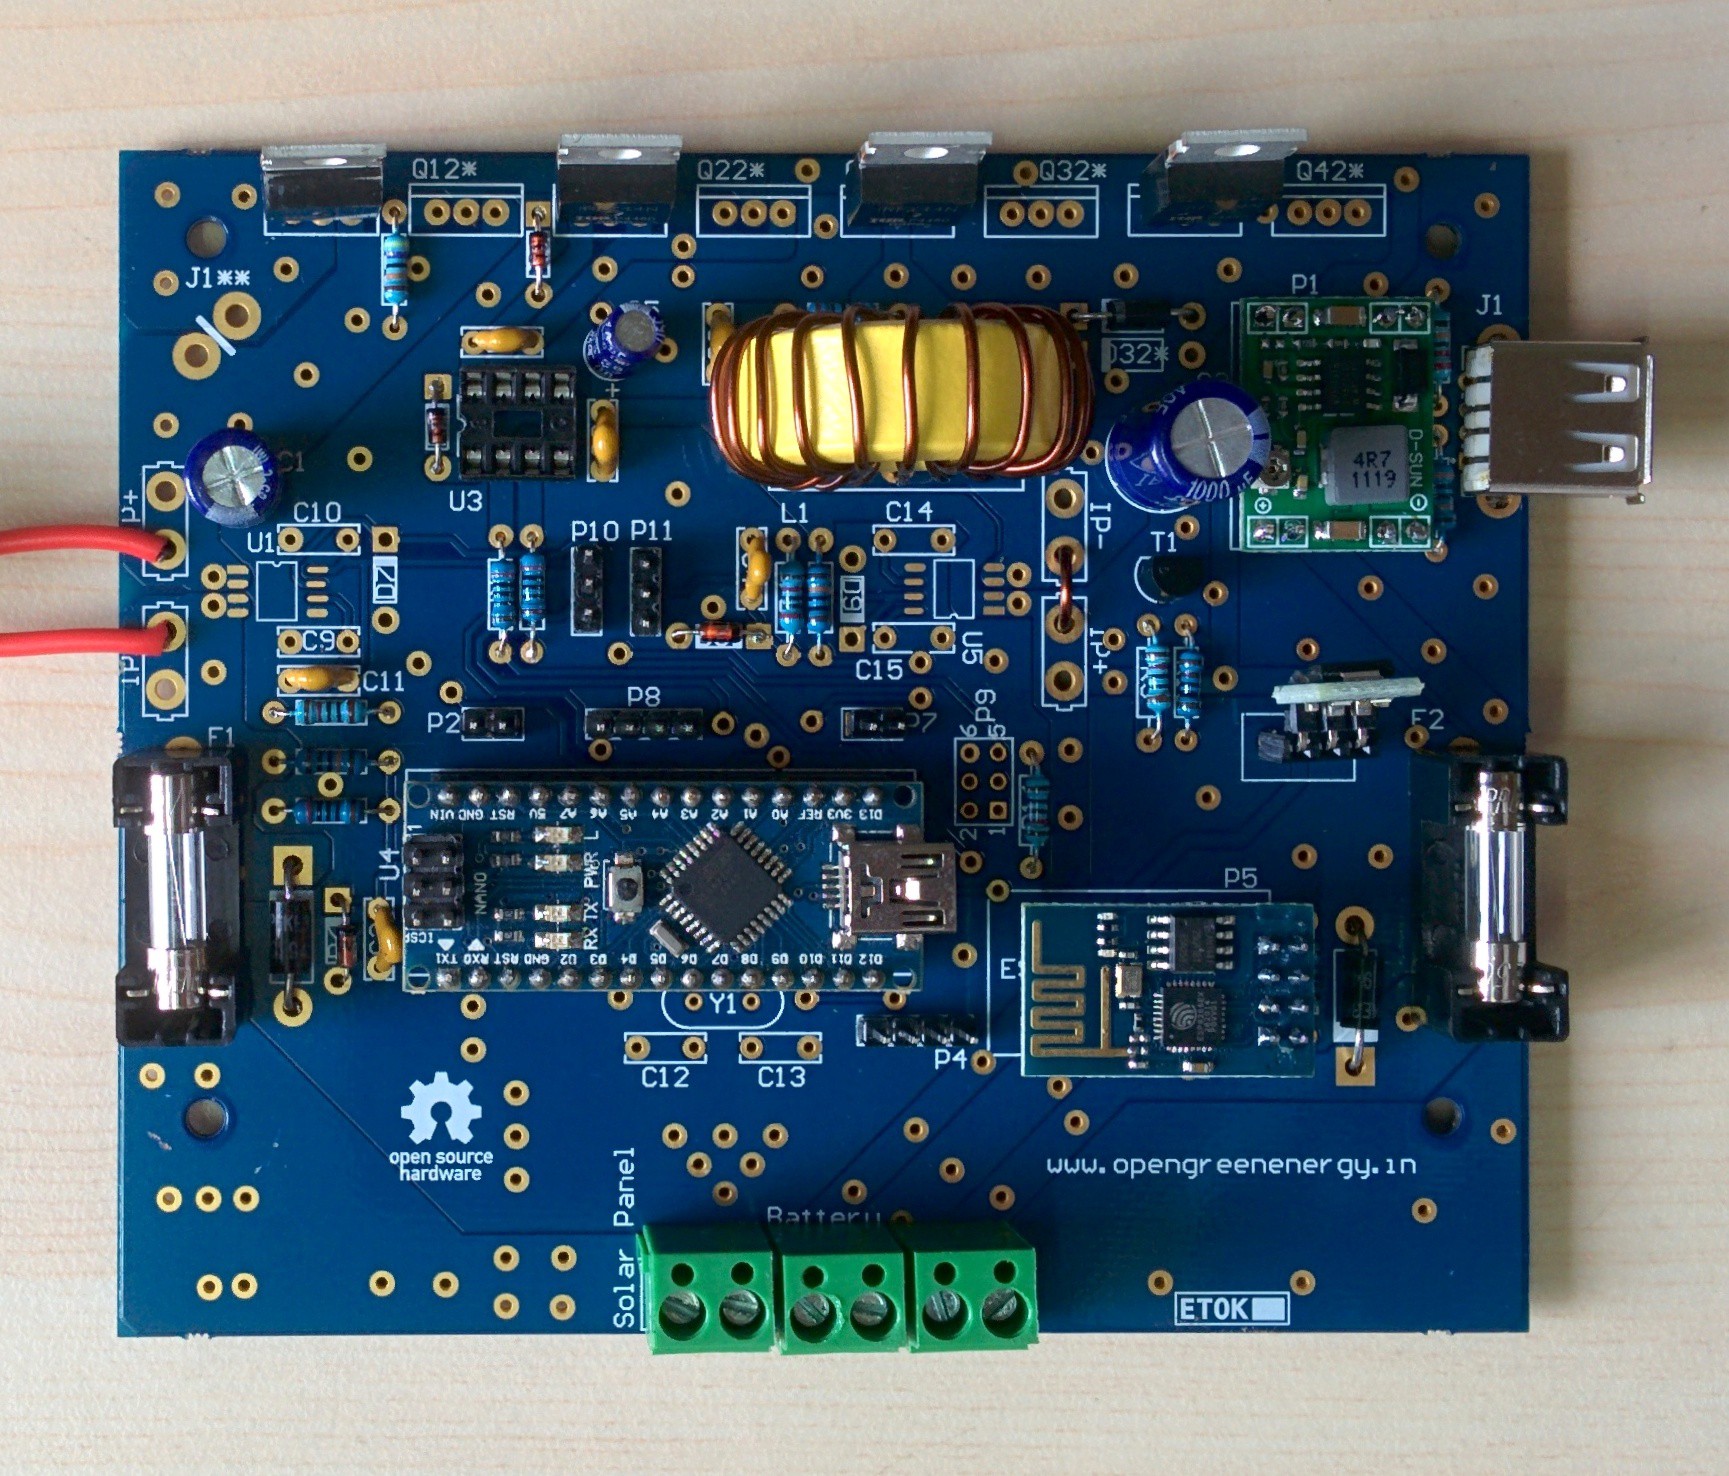
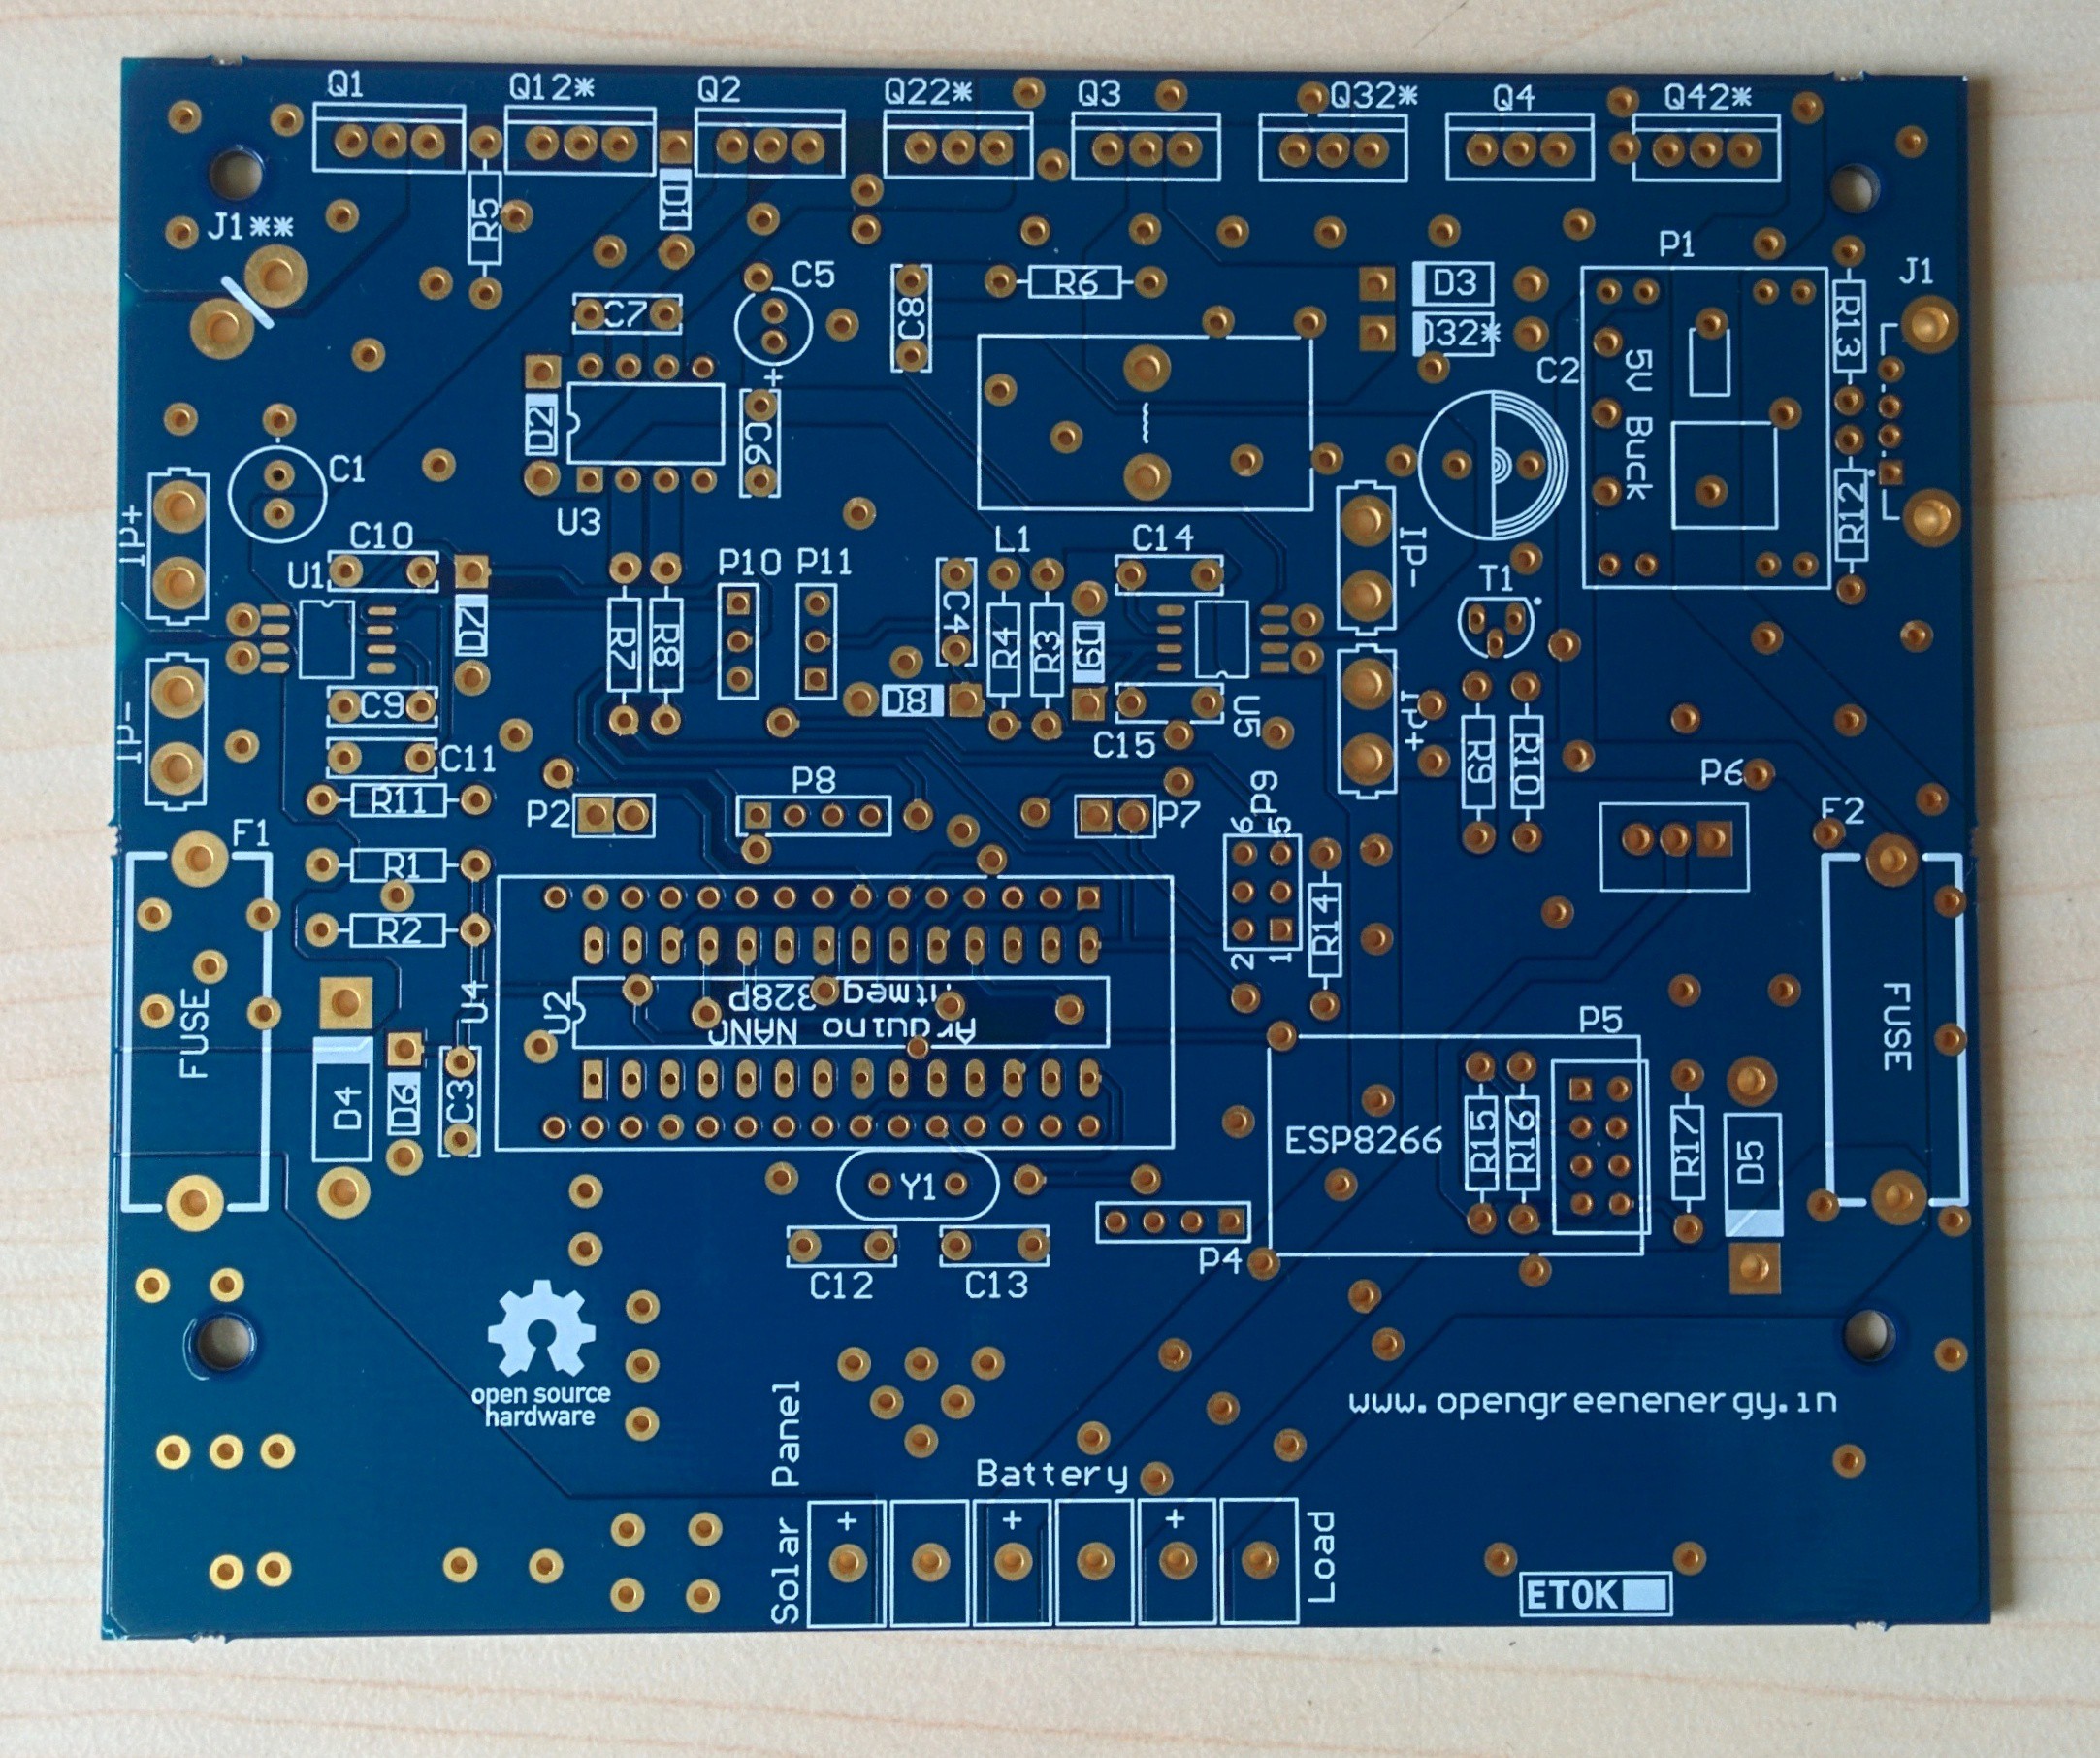
Specification of version-3 charge controller :
1.Based on MPPT algorithm
2. LED indication for the state of charge
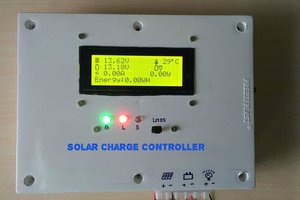
3. 20x4 character LCD display for displaying voltages,current,power etc
4. Overvoltage / Lightning protection
5. Reverse power flow protection
6. Short Circuit and Over load protection
7. Wi Fi data logging
8.USB port for Charging Smart Phone /Gadgets
Electrical specifications :
1.Rated Voltage= 12V
2.Maximum current = 5A
3.Maximum load current =10A
4. In put Voltage = Solar panel with Open circuit voltage from 12 to 25V
5.Solar panel power = 50W


 Dan Julio
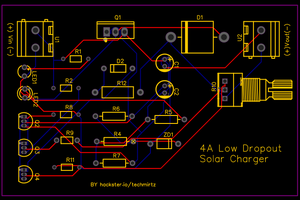
Wham Bam - powerpoint regulator
http://www.fieldlines.com/index.php?topic=146685.0