 Blecky
I got another chance today to set up the nodes as shown in this project log. After some preliminary data analysis I can safely say everything is working as expected.
The nodes were setup up in a 6x6m array like so:
[1]------[2]------[3]
 |                 |
 |                 |
[8]               [4]
 |                 |
 |                 |
[7]------[6]------[5]
And samples were taken at 1 meter offsets:
[1]------[2]------[3]
 |  .  .  .  .  .  |
 |  .  .  .  .  .  |
[8] .  .  .  .  . [4]
 |  .  .  .  .  .  |
 |  .  .  .  .  .  |
[7]------[6]------[5]
The first three nodes listed there are at the far end next to the wall in the image (the North side). Each of these points were measured with a laser distance measure.
I only got the chance to test the default mode without any special functions (frequency shifting etc.), but each Node was set to its own channel and the following average meter error plot was obtained:
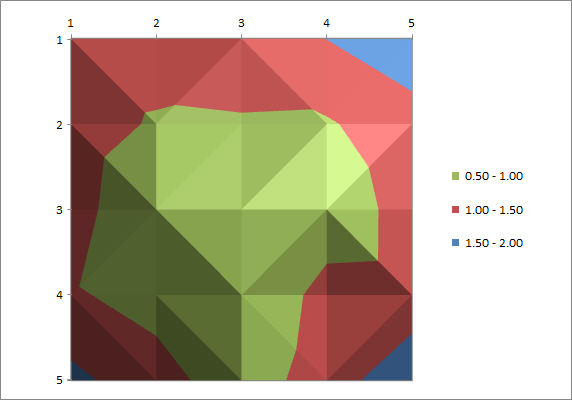
Plot Data:
	1	2	3	4	5
1	 1.44m 	 1.35m 	 1.24m 	 1.51m 	 1.84m
2	 1.31m 	 0.93m 	 0.96m 	 0.95m 	 1.29m
3	 1.23m 	 0.51m 	 0.57m 	 0.72m 	 1.18m
4	 1.05m 	 0.84m 	 0.57m 	 1.16m 	 1.19m
5	 1.64m 	 1.18m 	 0.74m 	 1.24m 	 1.89m
Each of the data points corresponds to the sample points above (same orientation). The data for this plot was obtained by scanning the SubPos nodes at each sample point for 1 minute with a smartphone on a stand the same height as the Nodes (my Wi-Fi dongle on a stick had issues). This was then averaged and the error in meters was mapped out for each position (based on actual distance and the calculated path loss distance from RSSI). Every channel for each position was then averaged to create the plot above to show the average error at each point (in +- meters).
Note that this is not the trilateration algorithm, it's just raw distance error calculations for some quick visualisation (I will run the data through this later to test the true accuracy of it).
As you can see, the area maintains a distinct border close to the Nodes (which was expected), but as you move towards the center, the accuracy increases substantially (more than accurate enough to find your way in a shopping mall or underground carpark). In a much larger area with many Nodes this error will average out and err on the smaller side.
My next test will involve frequency switching (which I expect will smooth out the average), and then I will look to test in a much larger environment when a suitable location is found.
But for the moment, I am very very happy with the baseline results of the default Node mode.
Discussions
Become a Hackaday.io Member
Create an account to leave a comment. Already have an account? Log In.
Exciting stuff dude.
Are you sure? yes | no