Today I had a chance to use the logic analyzer to capture the IIC data transfers at the 400 kHz rate. This showed why my previous estimates of the improved timing were off. In the estimate I made, I was using the shortest drawing time and figuring that across the 8 draws. The first one is the shortest, the second one is the second shortest, and then all the rest are about the same time. That time is 9.48 ms, as seen below.
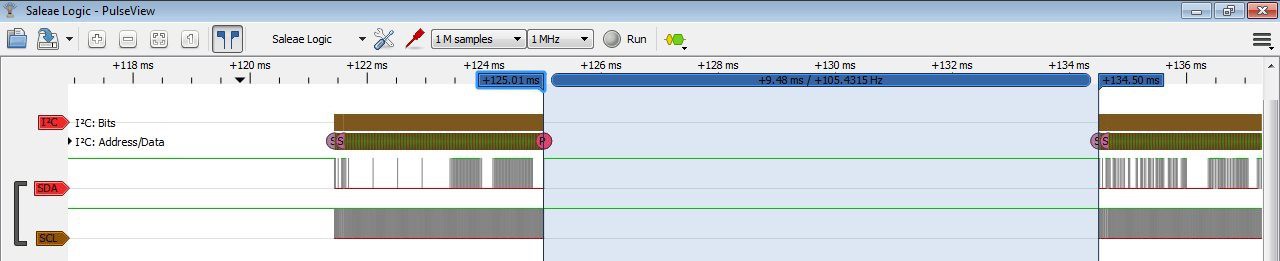
If all of the draw times were that long, there would be 75.84 ms spent drawing. In the current case, it's a little shorter because the first two draw times are shorter.
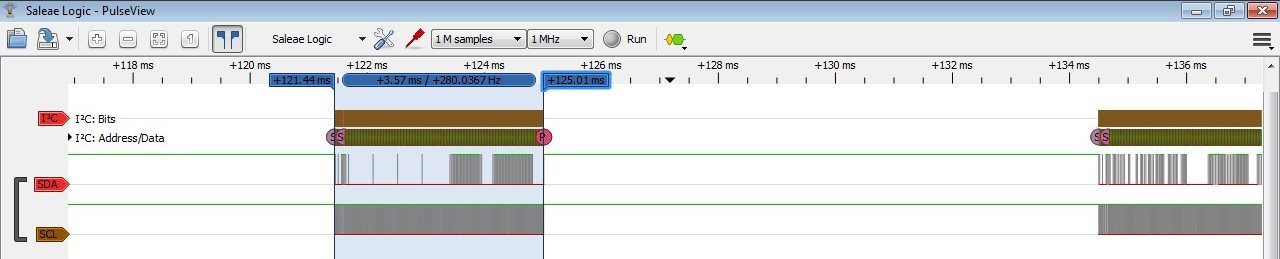
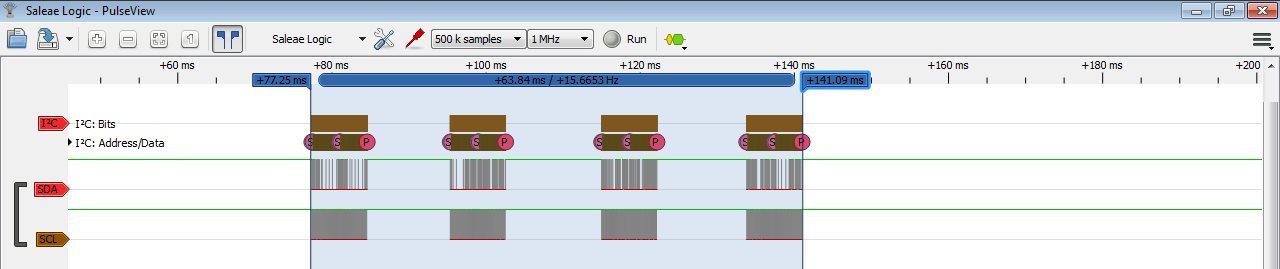
You can see below that the transfer time is significantly faster, 3.57 ms compared to 12.75 ms at the 100 kHz speed.
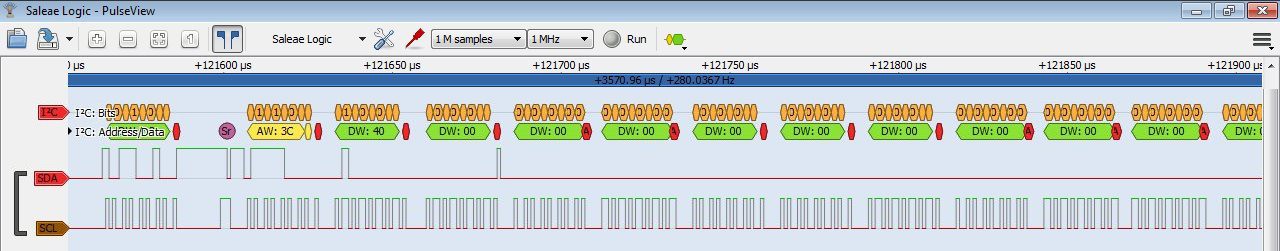
The clock was interesting to look at. The clock isn't quite as regular as it was at 100 kHz. This image shows the variations between cycles. You can also see that time between bits where the AVR is loading the next byte is a more significant time. At 100 kHz, it was about 2 cycles. Here it seems to be about 4.
In the photo below, you can see that the clock is held low a little longer in some spots. If I measure a 'shorter' cycle, it's equivalent to 500 kHz.
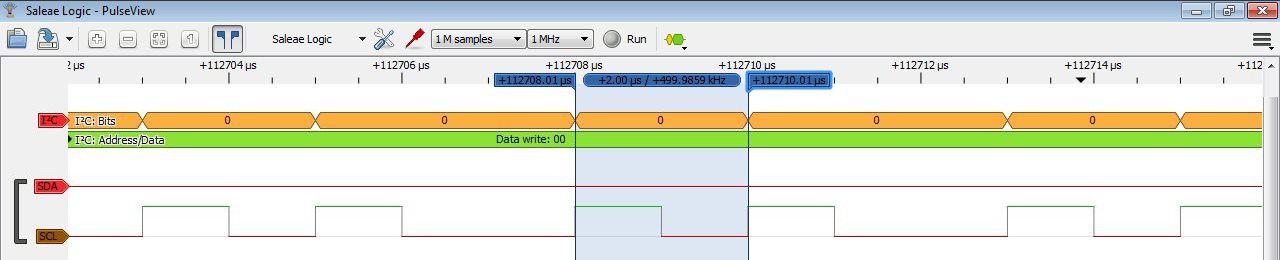
I think this is clock stretching, where the display is holding the clock line low until it's ready to receive the next bit.
But it also happens during the high part of the clock, as seen below. I think this must be the AVR loading the next bit. This image also shows the time for a complete transfer, which when divided by four works out to almost 400 kHz. So even though the low or high period may be stretched, it seems that it's made up for during the opposite part of the cycle.

I also switched to a 256 byte page size to see how that timing worked out. It took 4244 counts, again with the 1/256 divider. that works out to 67.9 ms. that agrees pretty well with the measurement of the capture below.
So, the fastest I can draw the display, with a 256 page size, is 67.9 ms. I'm interested to see how the timing is different with the SPI displays. While there's a few bytes overhead when transferring the data because of the address byte, it's a negligible amount of time. I think any improvements would come from a faster clock.
I also had a chance to take a quick look at the data from the GPS 18x. It has a binary mode, which I think I'm going to use. This will make parsing the data faster and easier than the text based NMEA mode. However, from what I can determine, there's not just one speed, there's lat speed, long speed, and altitude speed. So I would need to compute an 'actual' speed from those. I think the altitude speed can be left out of that, as it will be very small compared to the other two.
The image below shows the data sent out. One data transfer starts with the 10 squared in green. The '10 03' squared before that is the end of the last transmission (always ends with a '10 03'). If there is a '10' that is sent as part of the data, it is escaped with another '10' first, as seen in the orange rectangle. The end of that transmission is the red squared '10 03'.
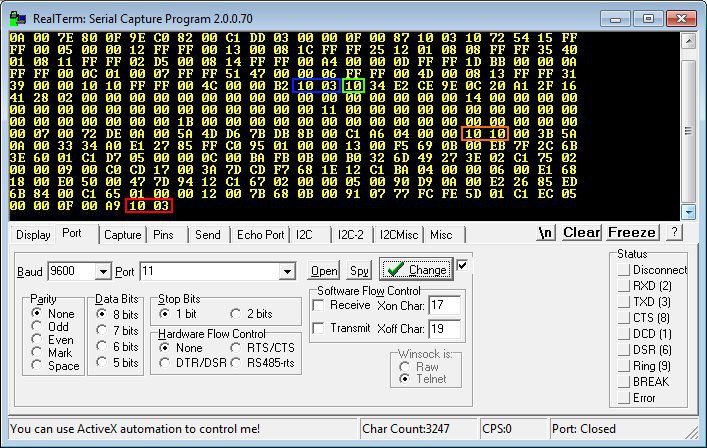
Next step, to figure out what that data actually means and how to process it. Fortunately, the GPS 18x details what the data means.
Discussions
Become a Hackaday.io Member
Create an account to leave a comment. Already have an account? Log In.