A technique for sharpening the
spectrogram uses information from the phase spectrum to sharpen the amplitude spectrum.
The scheme locates simple sinusoids, linear chirps, and impulses at the correct frequency or
time with a higher resolution than the inherent FFT resolution tradeoffs. The basis of the calculation is that the
instantaneous frequency (IF) in each FFT frequency band is equal to the first time derivitive
of the short-term FFT (STFT) phase at frequency ω and time T:
IF = ∂/∂t(arg(STFT(ω,T)))
and the local group delay (GD) at frequency ω and time T is approximately
GD = ∂/∂ω(arg(STFT(ω,T)))
where the function arg returns the phase angle of the transform (see Fulop).

Chassande-Mottin, et.al. show that reassignment is equivalent to moving energy up the local gradient of intensity of the spectrogram (for Gaussian windows). This higher precision does not violate basic time/frequency uncertainty (see Gardner and Magnasco). There is still mixing between reassigned frequencies or impulses which are close together. Plante, et.al. illustrate this with a nice figure shown to the left. Each elipse represents one frequency-time cell of the STFTs which make up a spectrogram. The energy in the cell is is placed at a location determined by the IF and GD.
An online matlab reassignmentt code (Fitz, 2008) was modified for faster rendering and more straightforward selection of minimum plotting amplitude and rendering method. The modified raspecgram and ratoplot (called by raspecgram) produce a reassigned spectrogram, but require a few other routines from the Fitz site. The code runs in Gnu Octave as well as matlab. There is also reassignment code at mathworks.
Examples show the effect of the reassignment.
The first example
generates two FM signals, with a superimposed linear chirp. The
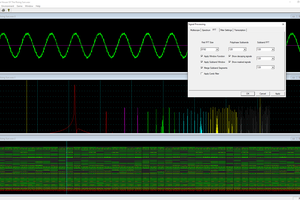
waveform and spectrogram are shown the the first figure, the reassigned
spectrum in the second figure. Note that in much of the reassigned plot
the FM signals and chirp are well localized, but when they approach each
other some scattering occurs. Scattering can be optimized (as usual in a
spectrogram) by changing the size and overlap of the FFTs used to
produce the results. The reassigned spectrogram was rendered using one
color for all points above an energy amplitude cutoff. The rendering
mode is refered to in the code as fast. The rendering mode format is method_size_marker. For instance fast_1_dot, color_3_circle, color_1_circle are all valid. Valid methods are fast/color. Valid markers are dot/circle.
Waveform and spectrogram of the test signal.

Reassigned spectrrogram of the test signal.

The second example
is a nestling green-rumped parrotlet (Forpus passerinus) begging call
(thanks to Karl Berg) with a complex multiharmonic, FM structure. The
spectrogram of a short segment is shown in the first figure, the
reassigned spectrum of one vocal burst in the second figure and another
in the third figure. The reassigned spectrogram shows a lot of detailed
FM which is hard to discriminate in the original spectrogram. There is
enough similarity between the two vocal bursts (and enough coherent
structure in each image) to suggest that much of the fine detail
revealed is real. The reassigned spectrogram was rendered using four
colors for points in four log(energy) bins above an energy amplitude
cutoff. Red is highest energy, then yellow, green and blue. The
rendering mode is refered to in the code as color_1_dot.
Spectrogram of a short segment of the parrot song.


Reassigned spectrogram of the above segment

A second segment of the same song to show repeatbility. (click to enlarge)

The third example is a boat-whistle call of the gulf toadfish (Opsanus beta) (Thanks to Luke Remage-Healey and Aaron Rice). The sound is a short noise burst followed after a pause by steady, harmonic-rich hoot. The image pair shows a short segment analysed with a 512 point STFT and 90% overlap...
Read more » Bruce Land


 glgorman


Bruce,
This is very nice. I was looking for a way to use the FFTs to resolve phase shifts. I do not like using canned programs, as you can spend a lot of time learning them, never really knowing if they are correct or not. So I will have to try to back track the functions and math you are using, and do it from scratch. Any clues welcomed.
I found that every every analog gravitational sensor data stream can be bolted into off-the-shelf tools from electromagnetism and other fields. I was trying to design a phased array using low cost components today. The radar and ultrasound chips are getting cheaper, and many devices and chips for electromagnetic communications channels can be adapted to process the signals and image some of the stronger natural sources, and maybe a few man-made ones.
After laboring at it many years, I finally just accepted that "an acceleration field is an acceleration field", quoting myself. The only distinction for gravity, is when you trace the source of the acceleration ultimately back to the gravitational potential of known bodies, and changes in the acceleration field to changes in the gravitational potential. Since GW170817 showed that gravity and electromagnetism propagate at identically the same speed, and likely share the same underlying potential, I have been working out the consequences in terms of new technologies.
I was girding myself to plow through the web to find this phase shift calculation, so I was very pleasantly surprised to find it waiting on HackaDay.IO. FFT's are extremely cheap these days, and it can be adapted quickly. I will try to work out a program to solve this myself, and see if I can optimize it even more. I have to work at micro, nano and femto accuracy most days, and some of the tougher problems require even more. I have been trying to use existing low resolution sensors by fitting the analog ones to high samplng rate ADCs then using the data to calibrate the instrument. Once calibrated, you need an array, to eliminate some of the local variations, and very long time frames. I use the sun and moon as reference points often. I am trying to adapt the seismometer networks to use them as gravimeters, but they all need to be upgraded, something that can be done in some cases by upgrades their amplifiers ADCs and data handling. There is nothing wrong with analog sensors - if you control the amplifier, ADCs, calibration and modelling.
The gravitational potential changes associated with an earthquake, or even with ocean waves breaking on the beach used to out of reach as sources. But now there are increasingly 3D video techniques to essentially measure the 3D distribution of mass over time. Many people can do that now, some if they just tried. If you randomly sample from the points included, you can get a stable estimate of the gravitational potential over time at the detector locations. Two or more sensors, based on their location, can then sample at precise times to focus on any given location. (Please check me on that. I think it is true and have tried some simuatlions. But always cross check myself many many times. I do not have access to hardware, so I have to use ten or fifty papers to get what one simple experiment would show.)
Got to run.
Thanks again for your elegant solution to an otherwise difficult problem.
RichardCollins, The Internet Foundation