 Henryk Plötz
In past projects I've had raging successes by just looking at the raw data, XORing stuff together, and maybe squinting my eyes a little. Spoiler: Not so this time. I'll walk you through the steps anyway.
What we know: Data comes in in packets of 8 bytes each. Somewhere in there should be two data points: temperature and CO₂ readings. The manufacturer protocol data sheet obviously doesn't apply, but maybe the real protocol is at least similar. That would mean that we expect that there should be an opcode (CO₂ vs. temp), a checksum, and a 16-bit data value. Earlier we noticed that there appears to be a structure within each 8-byte-packet, namely two 4-byte-structures with a fixed byte each in second place. That would be consistent with a protocol along the lines of 2 x [checksum, opcode, 16 bit data]. So, ... let's just plot each byte separately, trying to see whether there's any continuity over time (suggesting a slowly changing CO₂ or temperature value) in any byte:
with file("/dev/hidraw0","rb") as src:
	with file("co2_dez.log", "w") as dst:
		while True:
			data = src.read(8)
			print >>dst, " ".join(str(ord(e)) for e in data)
will read packets of 8 byte each from /dev/hidraw0 (you may need to give your user access to that device node) and dump then as decimal numbers, 8 on each line, into co2_dez.log. Press Ctrl-C after letting it run for a minute. The resulting file can then be plotted in GNU octave:a = load("co2_dez.log");
plot(a)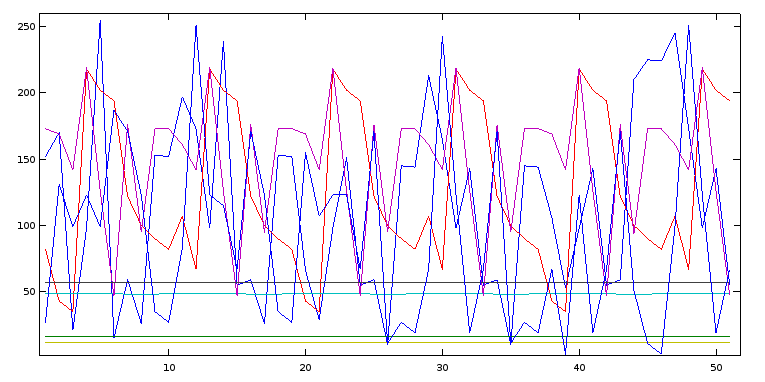
Hmm, nope. Most of the data is all over the place. (The voice of hindsight says: There's some structure I should have noticed, but didn't.)
Next thing to try whenever some protocol wants to annoy you by doing stupid XOR 'encryption' tricks is to XOR successive data packets, which would remove their 'encryption' and give you the XOR of the raw values. So, in Python:
prev = []
with file("/dev/hidraw0","rb") as src:
	while True:
		data = [ord(e) for e in src.read(8)]
		if prev:
			xor = [a^b for a,b in zip(prev, data)]
			print " ".join("%02X" % e for e in xor)
		prev = data
yielding output similar to:
D6 00 00 00 A2 00 00 60
63 00 08 00 57 00 00 78
DC 00 B8 01 9E 00 00 F8
42 00 1E 00 E8 00 00 D0
49 00 3E 00 F3 00 00 E0
03 00 08 01 00 00 00 08
FE 00 39 00 0A 00 00 C8
B8 00 28 00 2F 00 00 F8
27 00 99 00 55 00 00 E8
CE 00 10 00 A2 00 00 48
7B 00 08 00 57 00 00 50
DC 00 B8 01 9E 00 00 F8
42 00 1E 00 E8 00 00 D0
49 00 3E 00 F3 00 00 E0
03 00 08 01 00 00 00 08
61 00 79 00 02 00 00 18
AF 00 08 00 20 00 00 80
AF 00 F9 00 52 00 00 40
C6 00 10 00 A2 00 00 50
73 00 08 00 57 00 00 48
For slowly shifting values we'd expect a lot of 0s (if the value stays the same), a couple of low bits set only (f.e. when going from 0x42 to 0x43) and the occasional almost full byte (f.e. when going from 0x5f to 0x60). None of the bytes here match that. But there's something odd going on in the fourth byte: 01, twice 00, 01, five times 00, 01, twice 00, 01 etc.
We only assumed that each data packet contains CO₂ and temperature, but what if there are different types of data packets? Or what if the XOR key is not the same per packet? In this case simply XORing successive 8-byte-units wouldn't leave any useful results. … As we seem to have seen.
So, new theory: successive 8-byte-packets are not directly related, but there may be some larger structure.
To analyze this possibility we need a new data file that treats all bytes as independent:
with file("/dev/hidraw0","rb") as src:
	with file("co2_dez_ind.log", "w") as dst:
		while True:
			data = [ord(e) for e in src.read(8)]
			print >>dst, "\n".join(str(e) for e in data)
Now we can do a cross correlation. This is based on the idea that functionally identical bytes in the incoming data stream will also be numerically similar, at least as long as we're not violently changing data values (and CO₂ concentration and temperature remain rather constant in the short term). For this reason we will also be running the data gathering for a rather long time (upwards of 5 minutes) so that the correlation will shine through whatever bullshit was layered on top of it. Then, in GNU octave:a = load("co2_dez_ind.log");
[b c] = xcorr(a);
plot(c, b)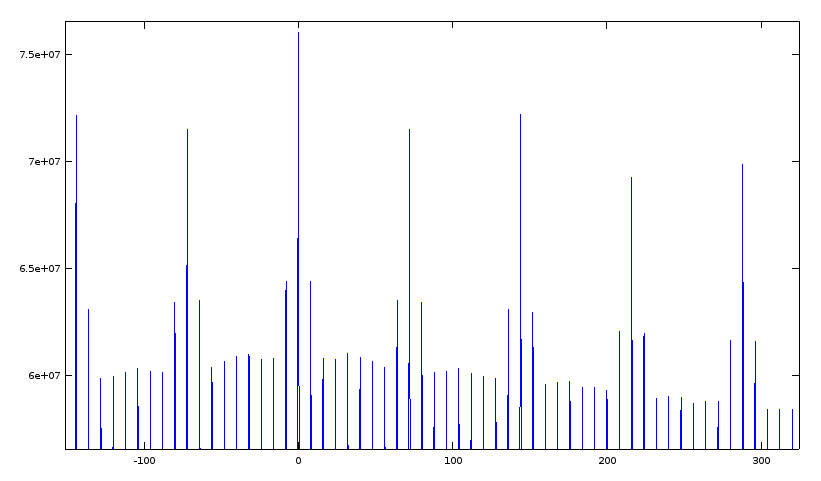
(I've zoomed into an interesting section for this screenshot.) Now that's more useful: Apart from the trivial correlation at offset 0 there are regular peaks every 72 bytes (that's 9 8-byte-packets), and, surprisingly, an even slightly stronger correlation at 144 bytes (that's 18 8-byte packets).
Re-trying the XOR thing for 144 bytes per packet and then trying to discern anything didn't seem too attractive. A friend of mine was also looking into the protocol from this angle, so I decided to shift gears here and try something completely new to me: Software reverse engineering. To the IDA Pro!
Discussions
Become a Hackaday.io Member
Create an account to leave a comment. Already have an account? Log In.