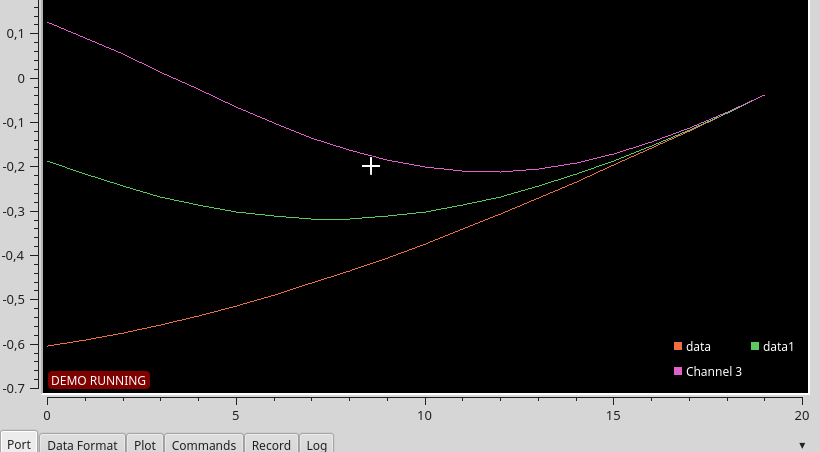
SerialPlot accepts 3 different types of data input:
- simple binary stream, supports different number formats (unsigned/signed - 8/16/32 bits and float)
- ASCII data in CSV format
- user defined custom frame format (frame start byte, frame size, checksum etc..)
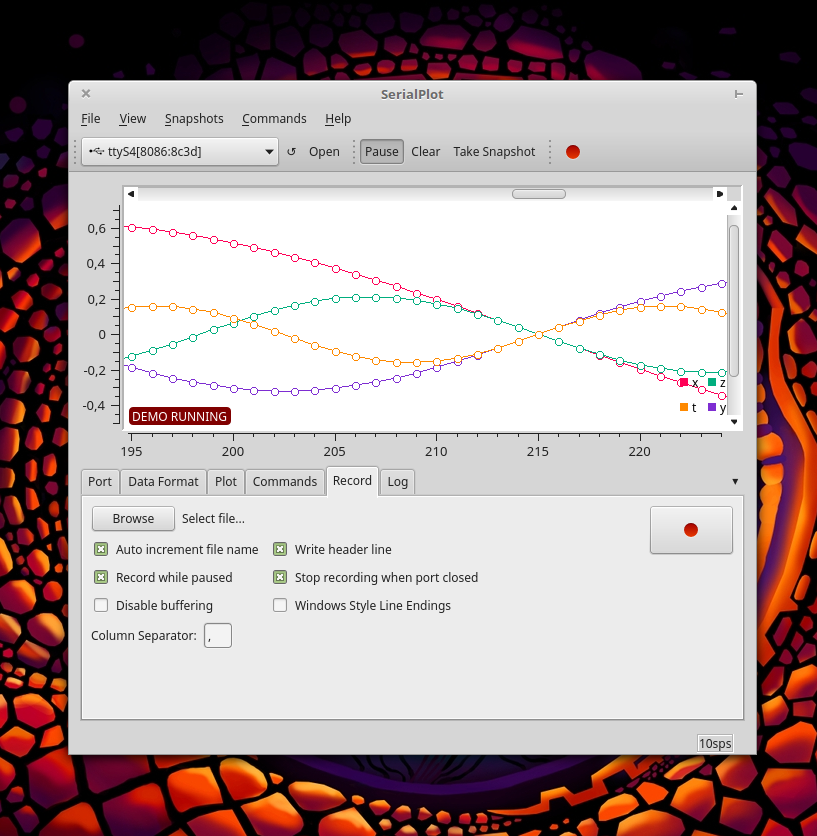
You can take snapshots of current view and store them in CSV files. You can also load them back from csv files, for convenient viewing.User can also define "commands" to be sent to the serial port device with a click. Commands can be defined in HEX or ASCII format.
In the sidebar you can find links to Linux and Windows downloads and source code.


 lpauly
 Bharbour
 Yann Guidon / YGDES
 Ken Yap
SerialPlot - Elevate your real-time plotting experience with GPT Writing Prompts integration. Seamlessly solve plotting complexities, ensuring dynamic and efficient data visualization in this innovative software.