 Paul Kocyla
Note: Battery got weak in the end of the experiment, but the trend is still visible.
I should have also make the on/off phases longer and homogenious, sorry for that. I couldn´t guard the experiment all the time so i came from time to time and toggled the thruster.
But after a test is before a test - new one to come.
Now that a trend is visible, I´ll prepare a better test.
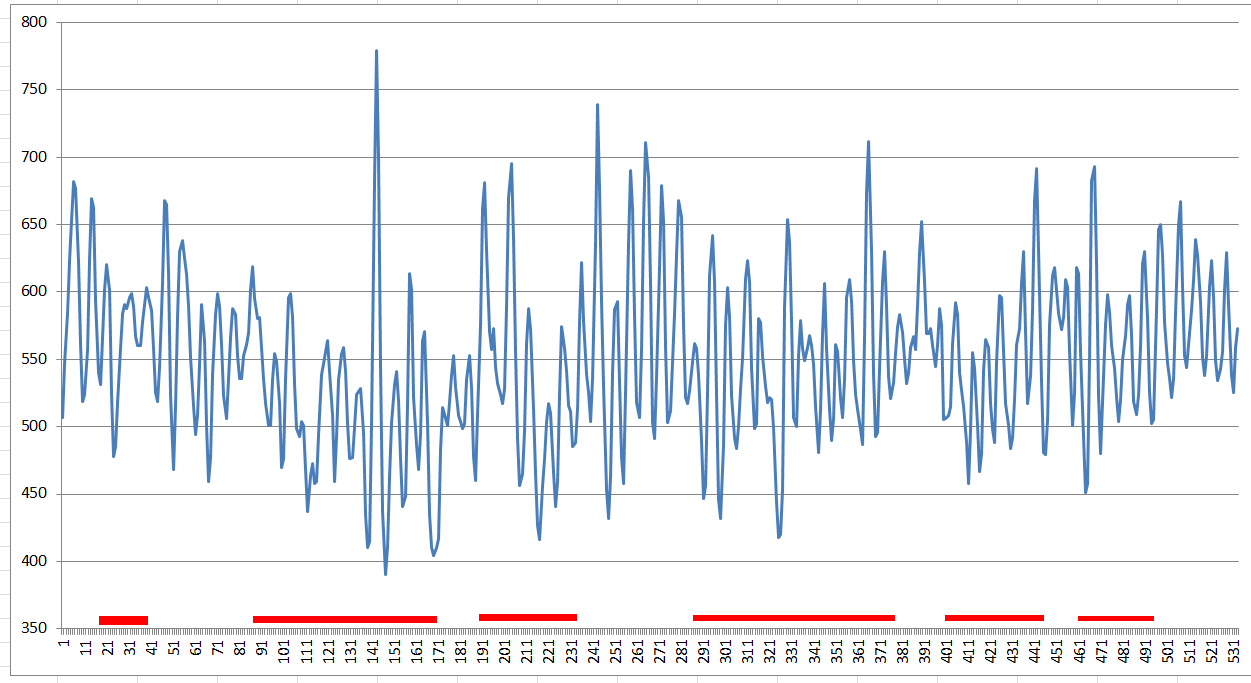
X Axis: frame number (533 frames for complete video)
Y Axis: x coordinate of testrig edge (lower <-> rotated clockwise)
Data for download:
https://www.dropbox.com/s/jjmg8qa44q250z7/data_torsion2.txt?dl=0
Due to questions - Thruster was active for following data positions:
18..39, 87..170, 189..233, 285..376, 400..443, 460..494
Video file:
Discussions
Become a Hackaday.io Member
Create an account to leave a comment. Already have an account? Log In.
It can be seen on the spline chart that the 1st derivative grows on intervals between X and O - which means the 2nd derivative (acceleration) is positive.
Are you sure? yes | no
I think testing in-motion is a bad idea to start with, especially when tested object is moving back and forth. In critical situation where thrust is only observable for few hundred ns, and object is moving against it, data would be obfuscated beyond recognition.
Why not create perfectly still floating test-bed? Change the device setup from continuous power into short, higher-powered condensed harmonic bursts. If the device will start making micro-waves, you will know something is up.
Last thing, I'm not a big fan of on-board battery, I think test-bed should only contain the RF generator and cavity, power should come via gently hanging cables coming form power source above, IMO.
Are you sure? yes | no
Here is an analysis using Fourier transform filtering.
All time domain signals can be represented in terms of their component frequencies, in this experiment we aren't interested in the high frequencies components because the experimental perturbation isn't rapidly switched, so we can filter them out, which is what I've done. I've also overlayed the ranges when the drive was active.
The Y axis is displacement because I subtracted the mean.
Are you sure? yes | no
Thanx a lot. Looks good to me, the result leaves room for hope.
I´ll make another test today with longer on/off times and with the cavity turned by 180°
Are you sure? yes | no
Simple interpolaton with 5th degree splines with knots fixed to ON (X) and OFF (O) points.
1st derivative of the interpolation (disregard the edges).
Are you sure? yes | no
Here's some shabby analysis. If I saw anything I would've gone deeper!
https://www.dropbox.com/s/t2syuuj8mtw2h04/emdrive.xlsx?dl=0
Are you sure? yes | no