 Koen Hufkens
What is phenology?
Phenology is the study of (the timing of) recurring life cycle events. This includes both animals and plants alike. However, my particular research interest goes out to plant phenology. Plant phenology studies when plants leaf out, when they drop their leaves or when other life cycle events happen (flowering, shoot elongation, needle drop, ... ). Plant phenology is also tightly coupled to our climate, as it influence how much CO2 is captured through photosynthesis from the atmosphere and how bright the surface of the earth is (it's albedo). In addition it also mediates the flow of water and energy (through transpiration). In the animation below you see the seasonal changes across the globe as the growing season switches from one hemisphere to the next.
This process removes substantial amounts of CO2 from the atmosphere, more so in our warming world the growing season length is increasing by 3-5 days per decade. These extra days of photosynthesis provide a negative feedback to the CO2 induced warming of our world. However, how much more CO2 will be removed and how plants will respond to a warmer but also more CO2 rich world remains a question. To answer these questions we can formulate mathematical constructions which model plant phenology in response to various climatological drivers. The output of detailed atmospheric model displaying variations in CO2 across a year is shown below.
However, such a model must be validated against real data. One of these sources of data is remote sensing data from various satellites circling the earth. Sadly, these satellites are limited by a spatio-temporal trade off, where one can get either high resolution data at a low temporal scale or low resolution data at a high frequency. In order to optimize current phenological models a high frequency, high resolution view on plant growth would be ideal. This is where PhenoCam project comes into the picture
The PhenoCam Project
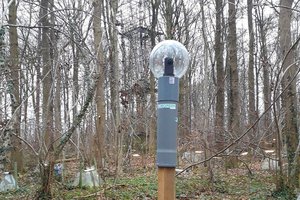
The PhenoCam project is a project started and run by Dr. Andrew D. Richarson at Harvard University which uses PhenoCams to keep watch of vegetation at both a high spatial and temporal resolution using conventional cameras. PhenoCams register a standard RGB jpeg every half hour. These images are than converted to time series of vegetation greenness using a green chromatic coordinate (Gcc) index; which is the ratio of green pixels and the images brightness (sum of all channels).
Below you find an image illustrating how various biomes respond to changes in both temperature and precipitation (image by A. D. Richardson). You see that vegetation growth in a temperate deciduous forest (A) is mostly triggered by temperature rather than precipitation. A Mediterranean oak forest (B) on the other hand is more dependent on pulses of precipitation. A similar response is recorded when comparing a northern temperate grassland with a moisture limited tropical grassland location. These PhenoCams provide us with the necessary data to validate our phenology models.

Most of the PhenoCams are installed by the project or researchers around the country. Unlike other projects such as project budburst and the National Phenology Network which rely heavily on citizen scientists to observer changes in (plant) phenology the PhenoCam project does not offer such opportunity. Although citizen science involvement for data processing is being worked on, the financial burden of the current PhenoCams (~$500-900) makes involving citizen science in data collection difficult.
PhenoPi
I recognized that people often have a window pointing towards some street trees or their garden. A lot of people watch their gardens change throughout the season and do so with enthousiasm. This is a missed opportunity I feel. I was hoping to engage citizens in collecting digital repeat imagery data. This could only be achieved if the price point of the camera used was lowered, and the process of installing the software would be rather trouble free.
Involvement of citizens would...


 Pranav Gulati
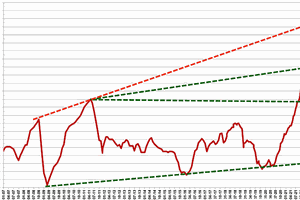
 Kemal Ficici