 Daniel
凸凹
( Dekoboko / でこぼこ )
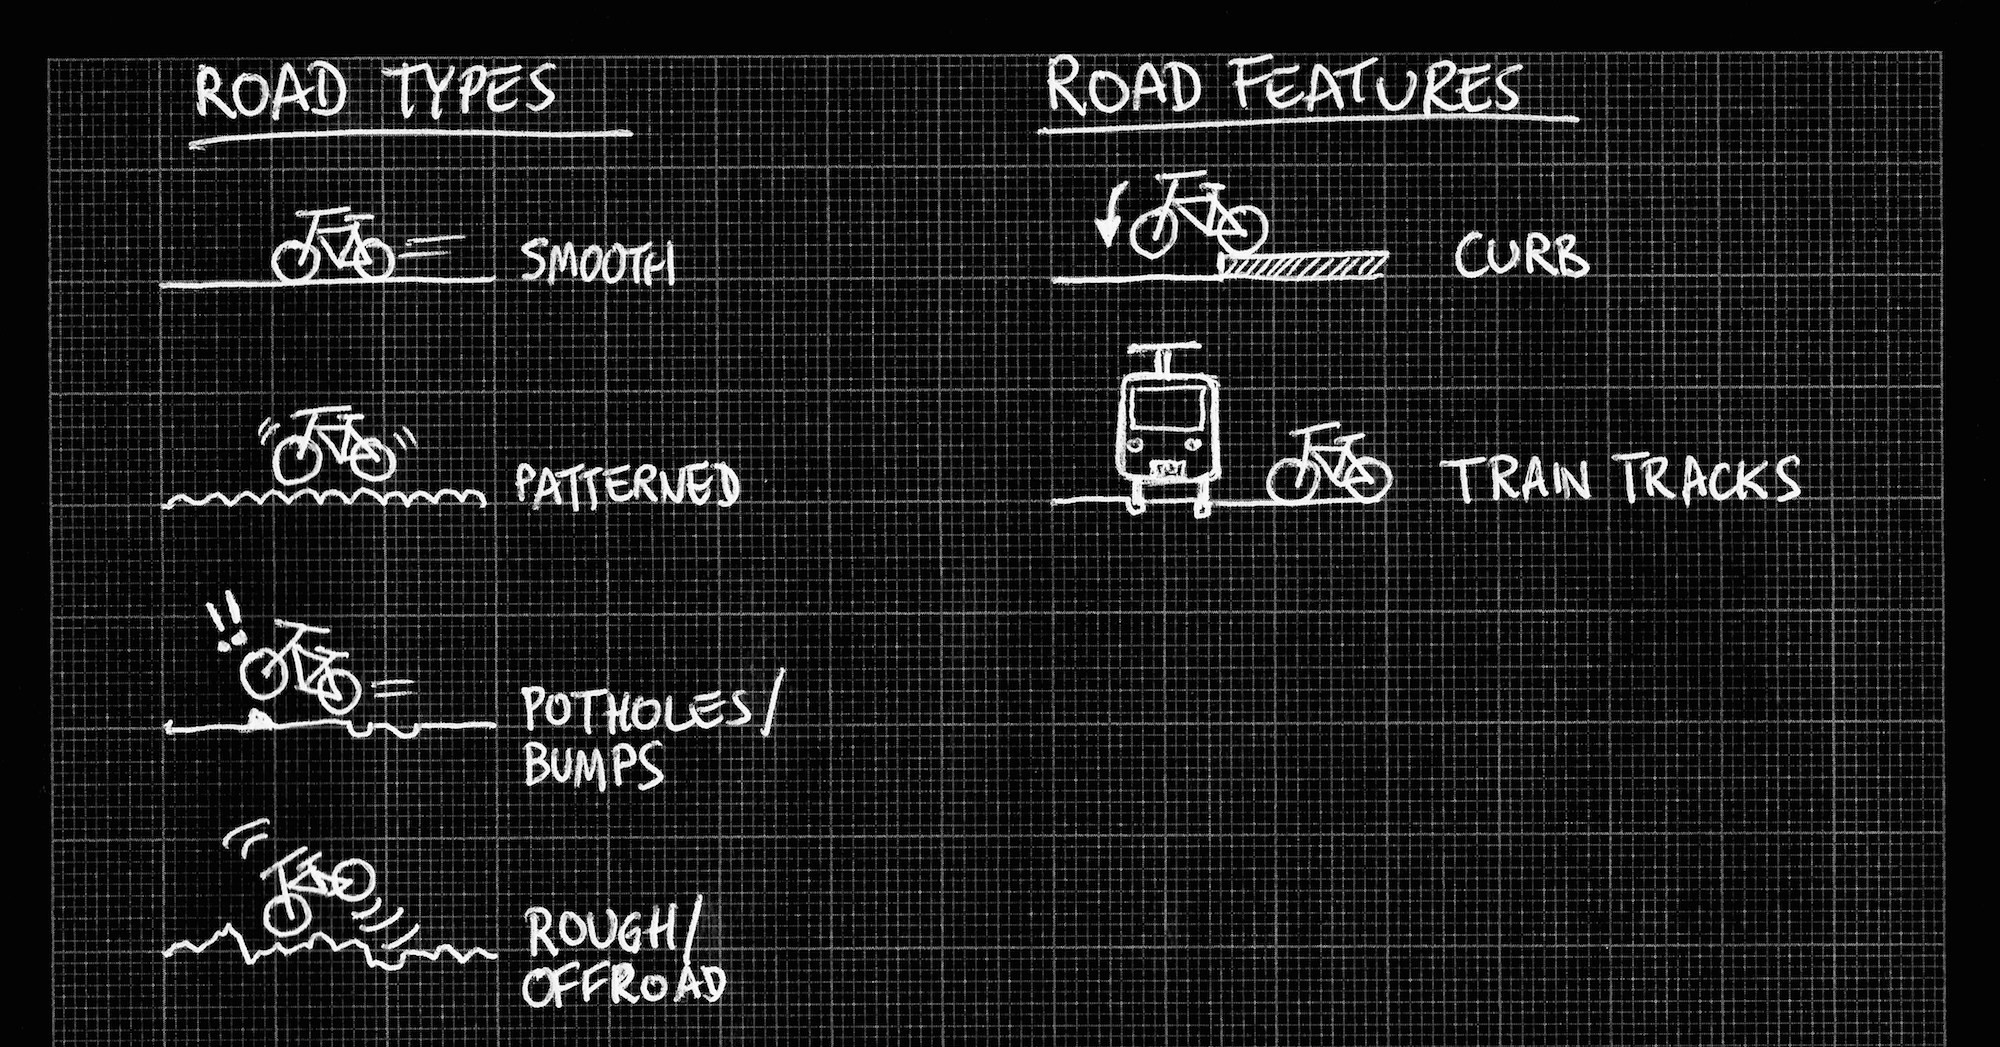
adjective, Japanese: bumpy, rough, uneven, irregular
We want to make your ride less bumpy!
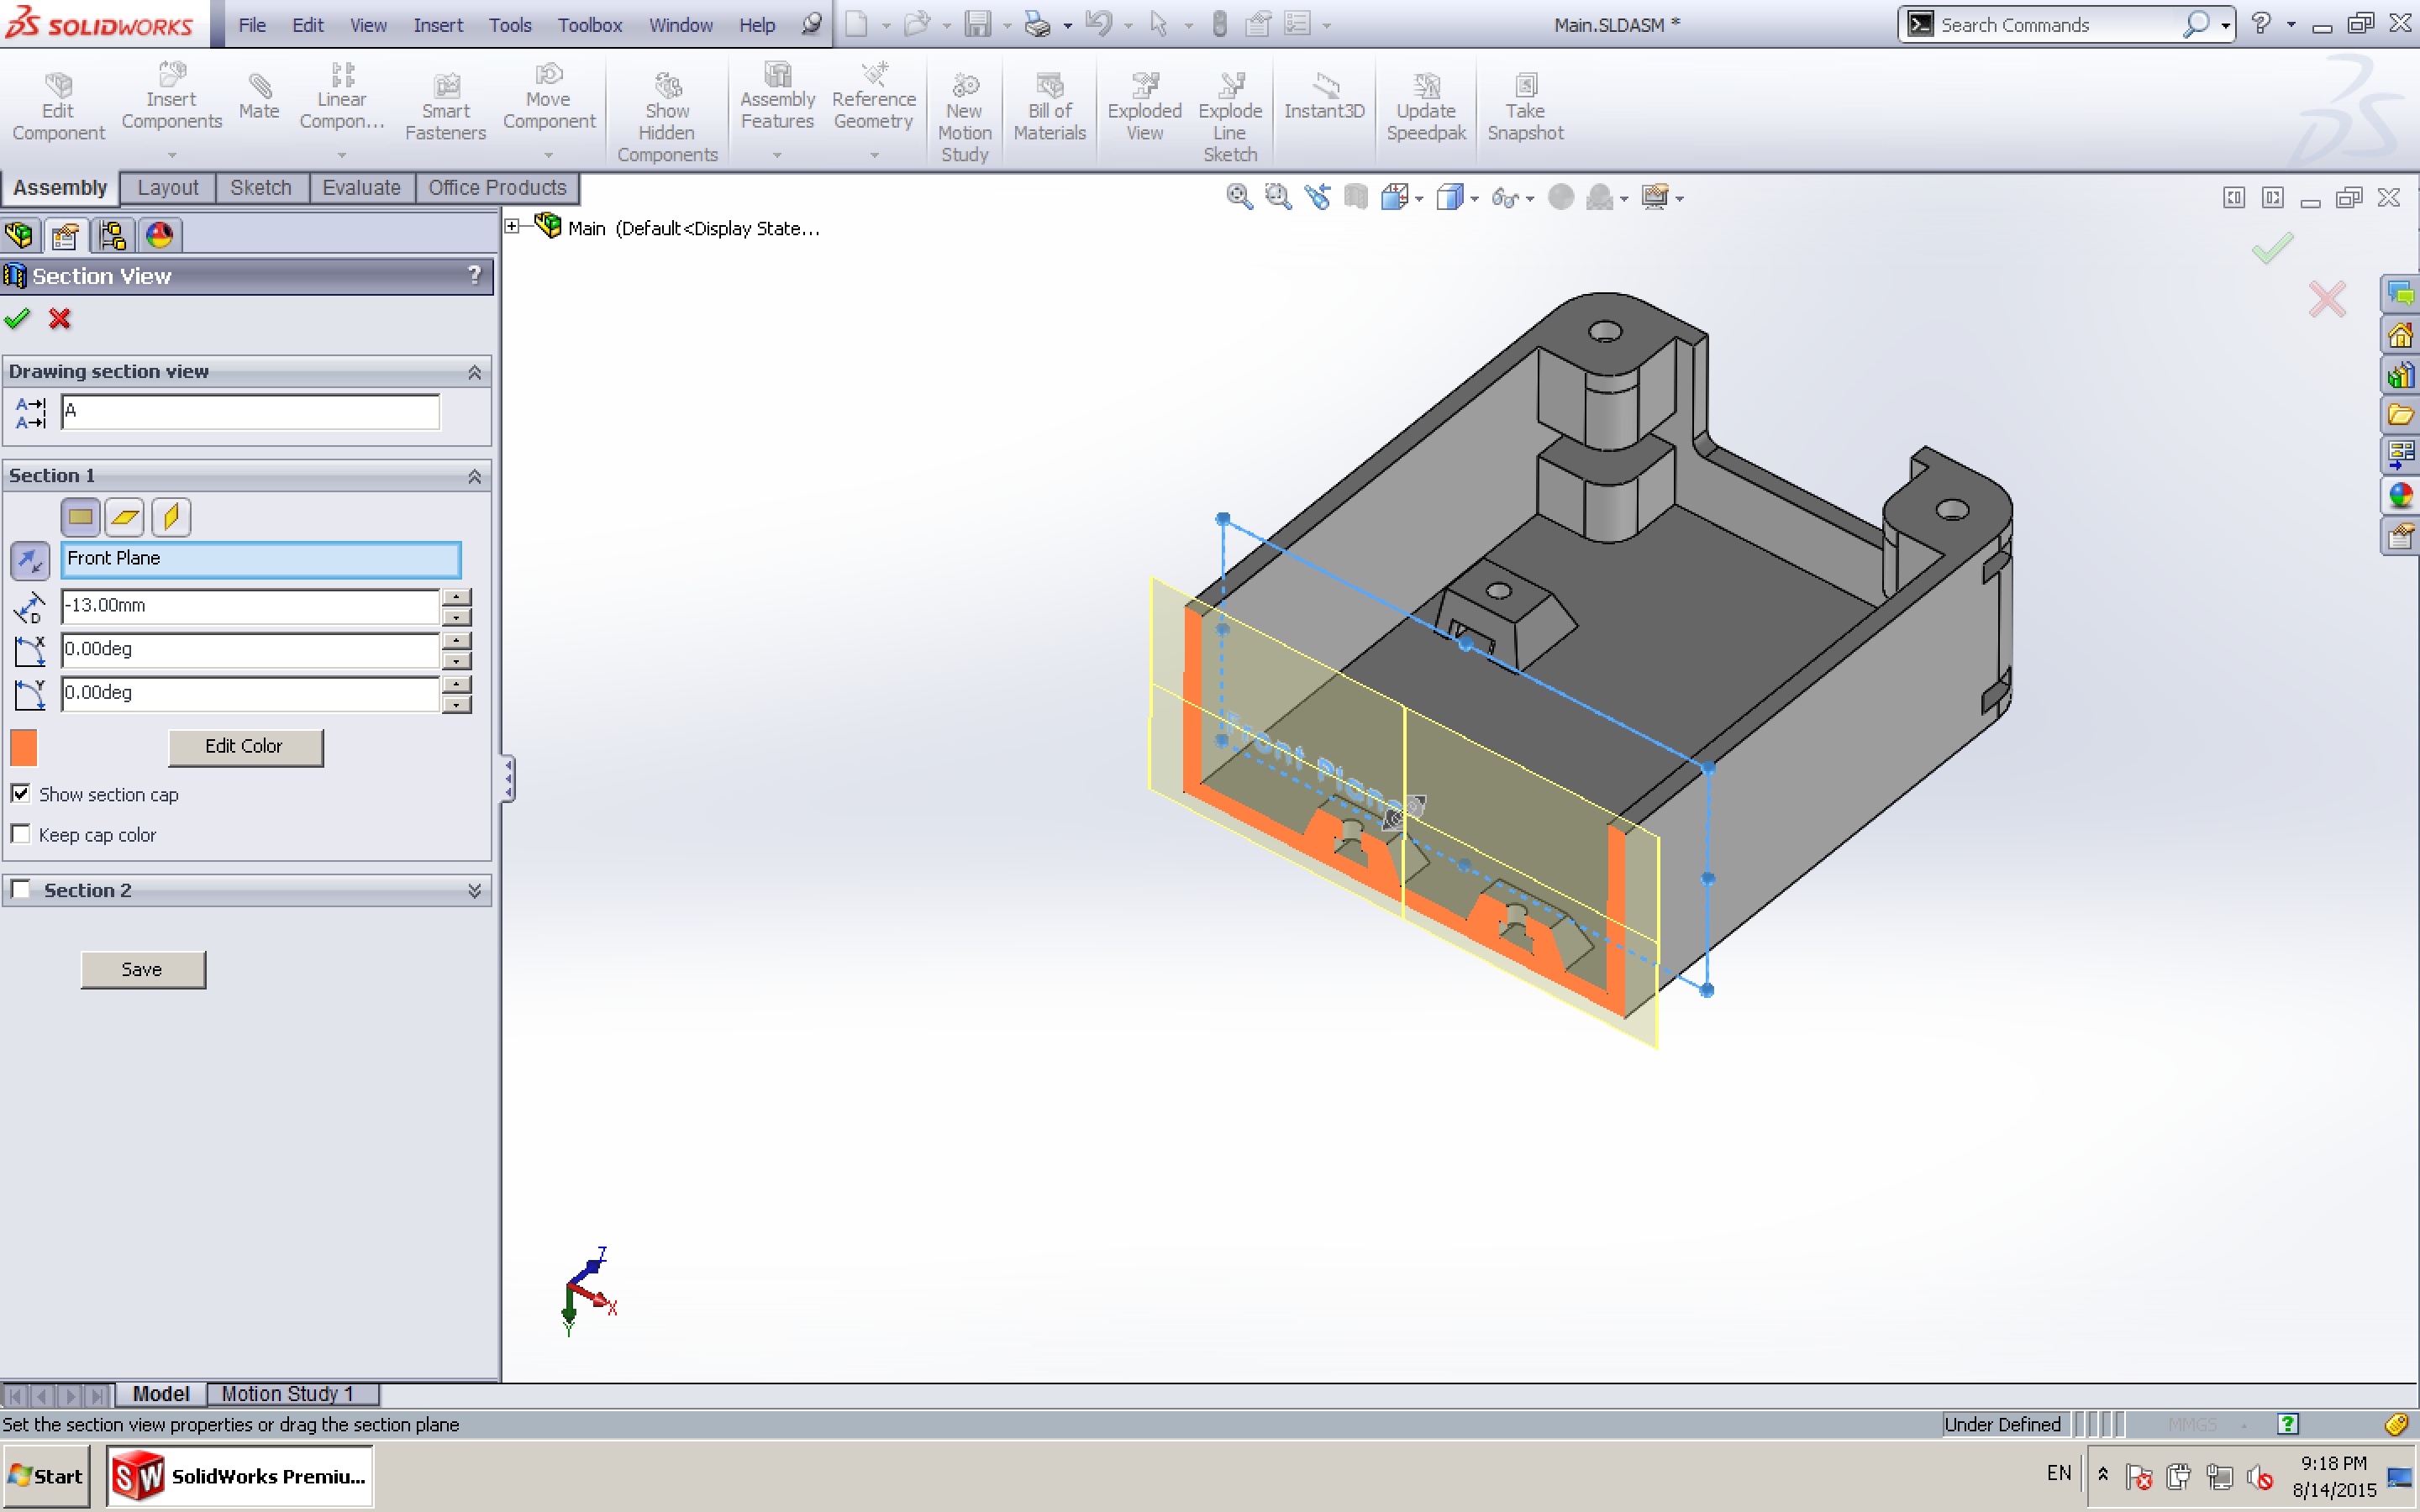
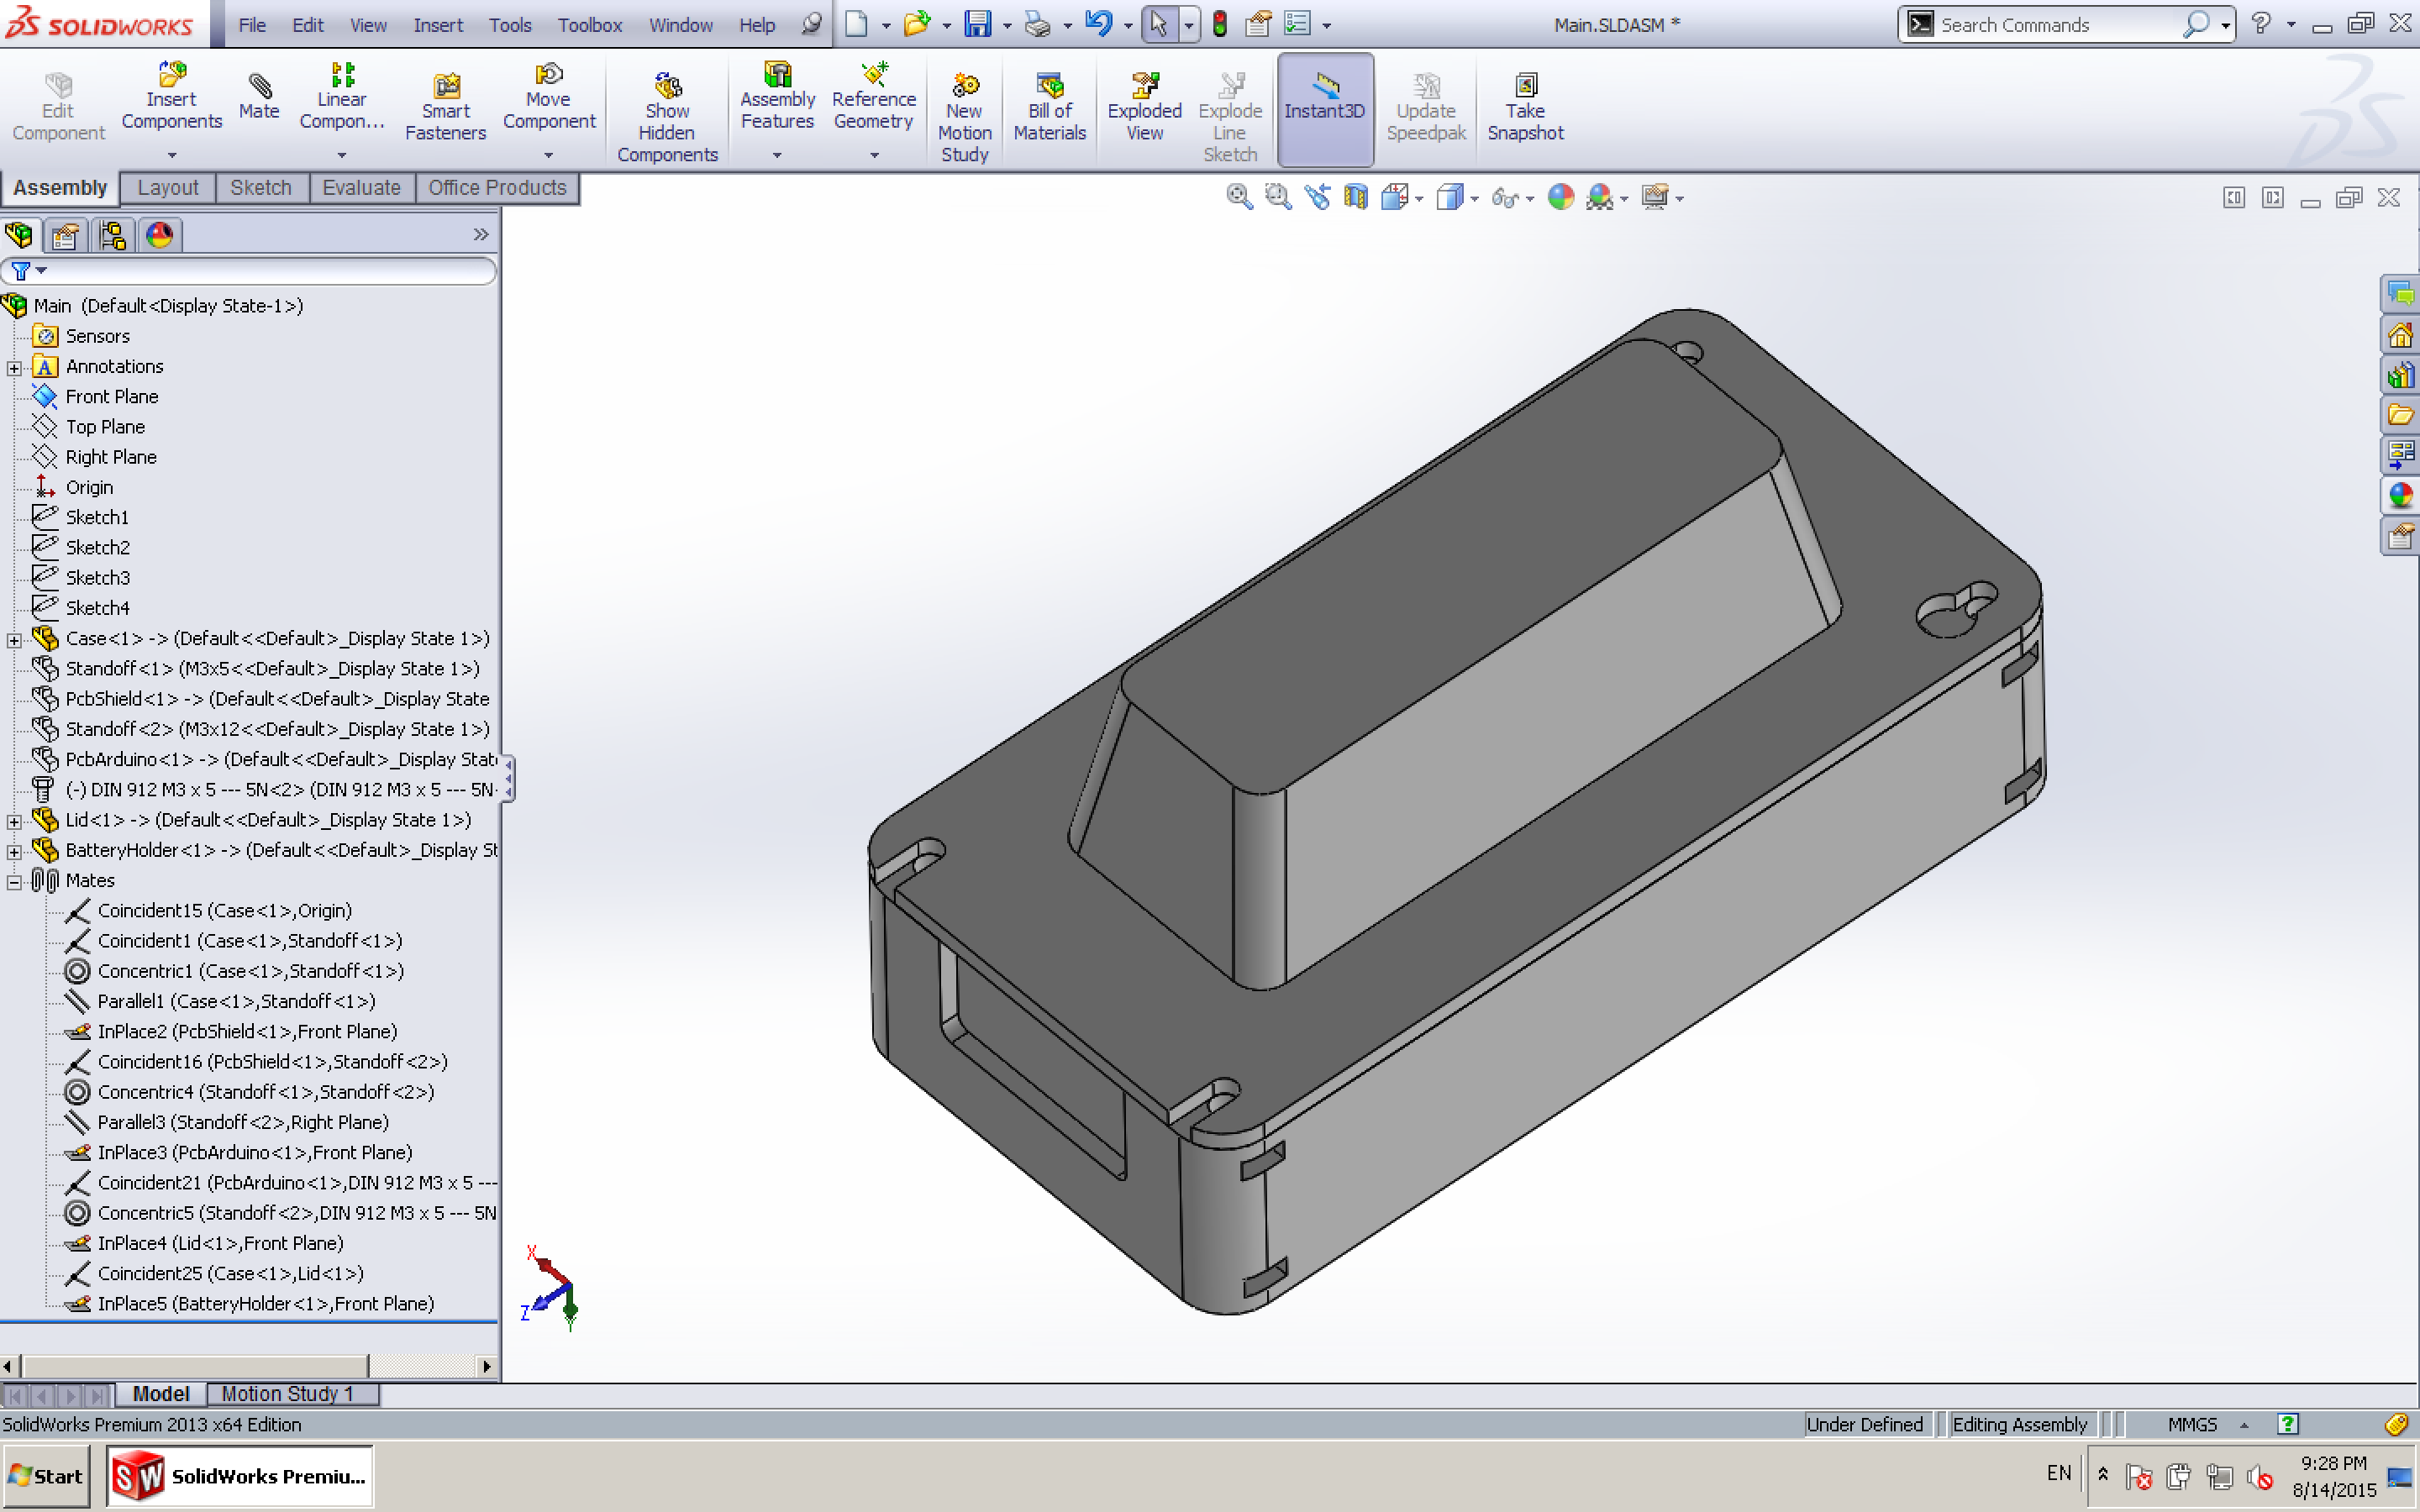
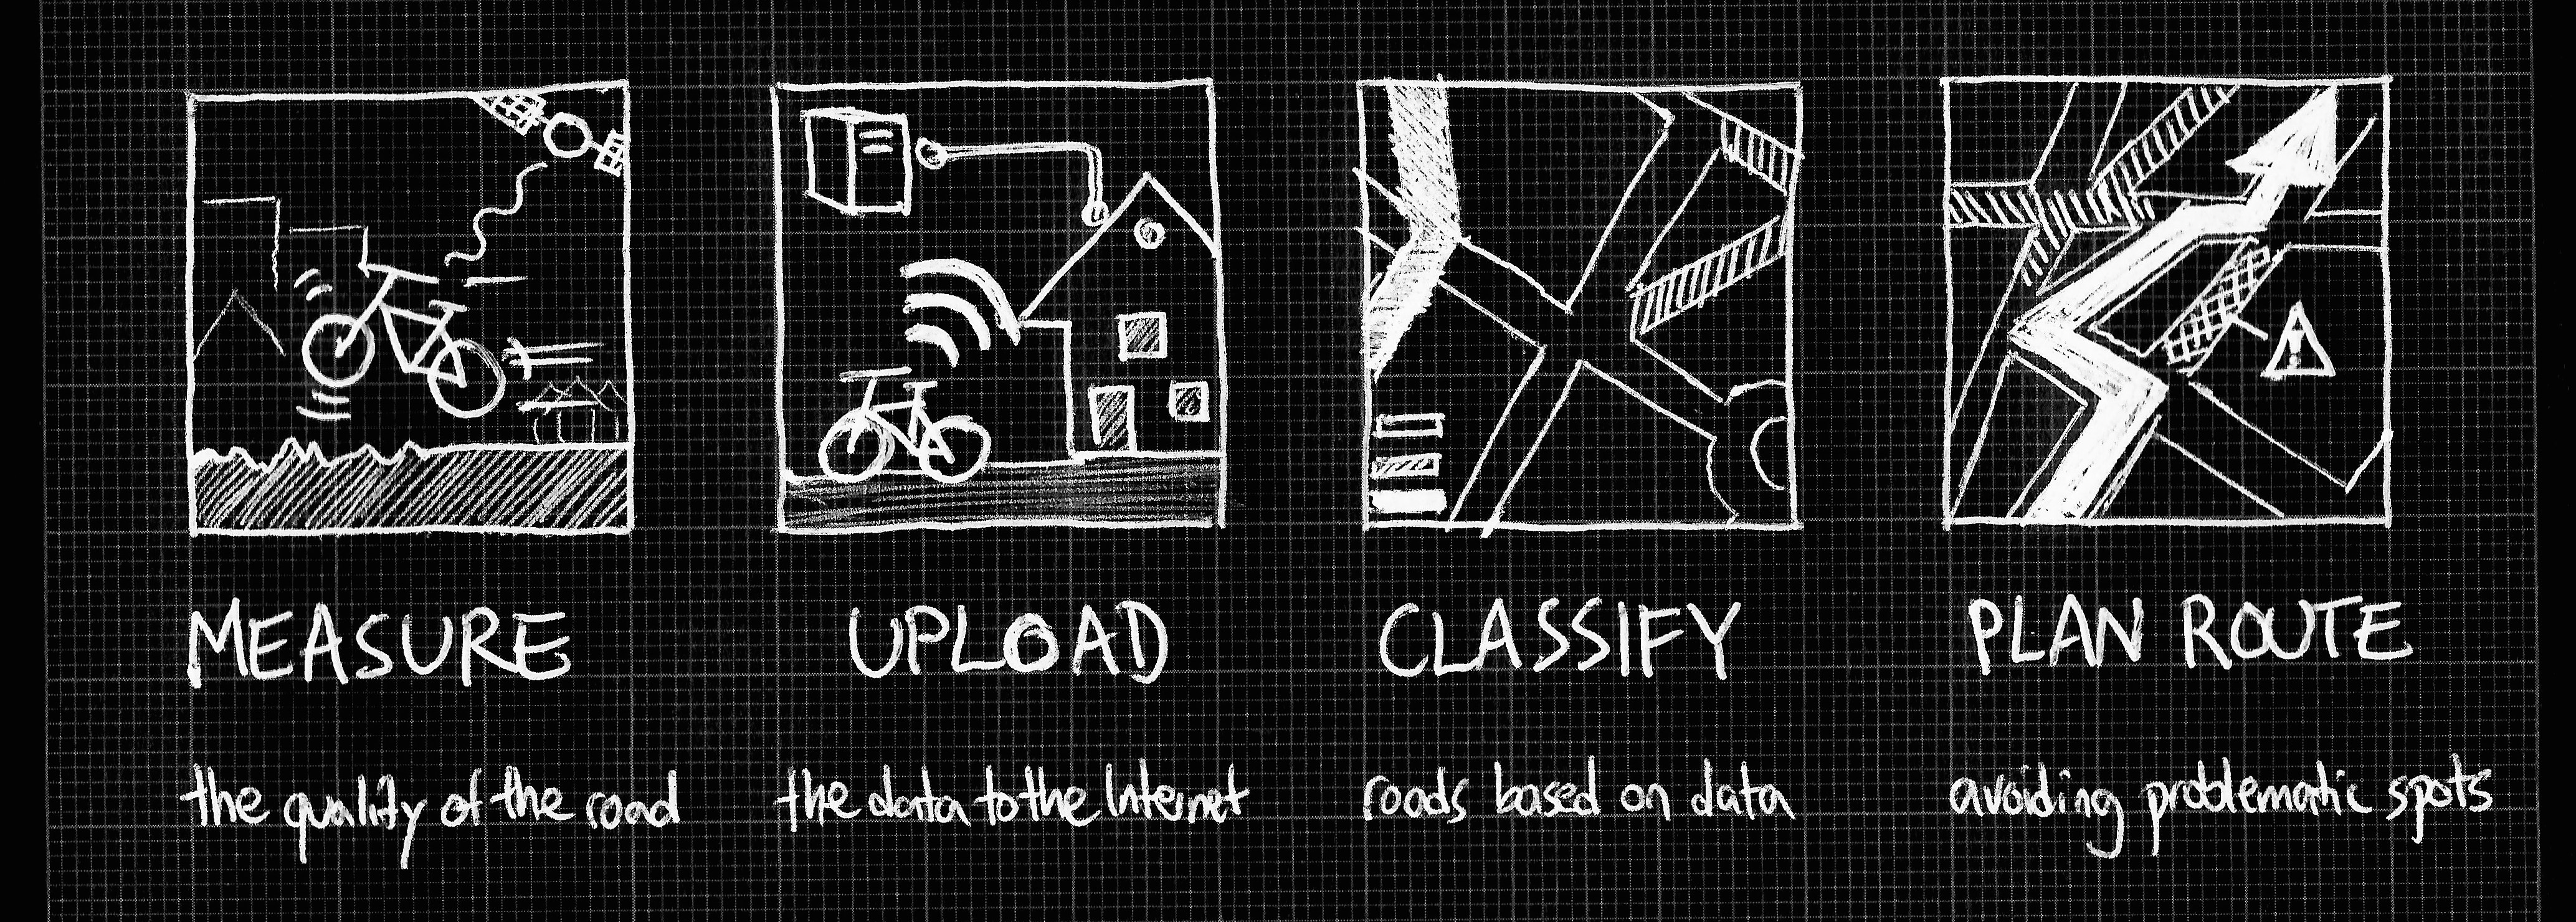 The workflow.


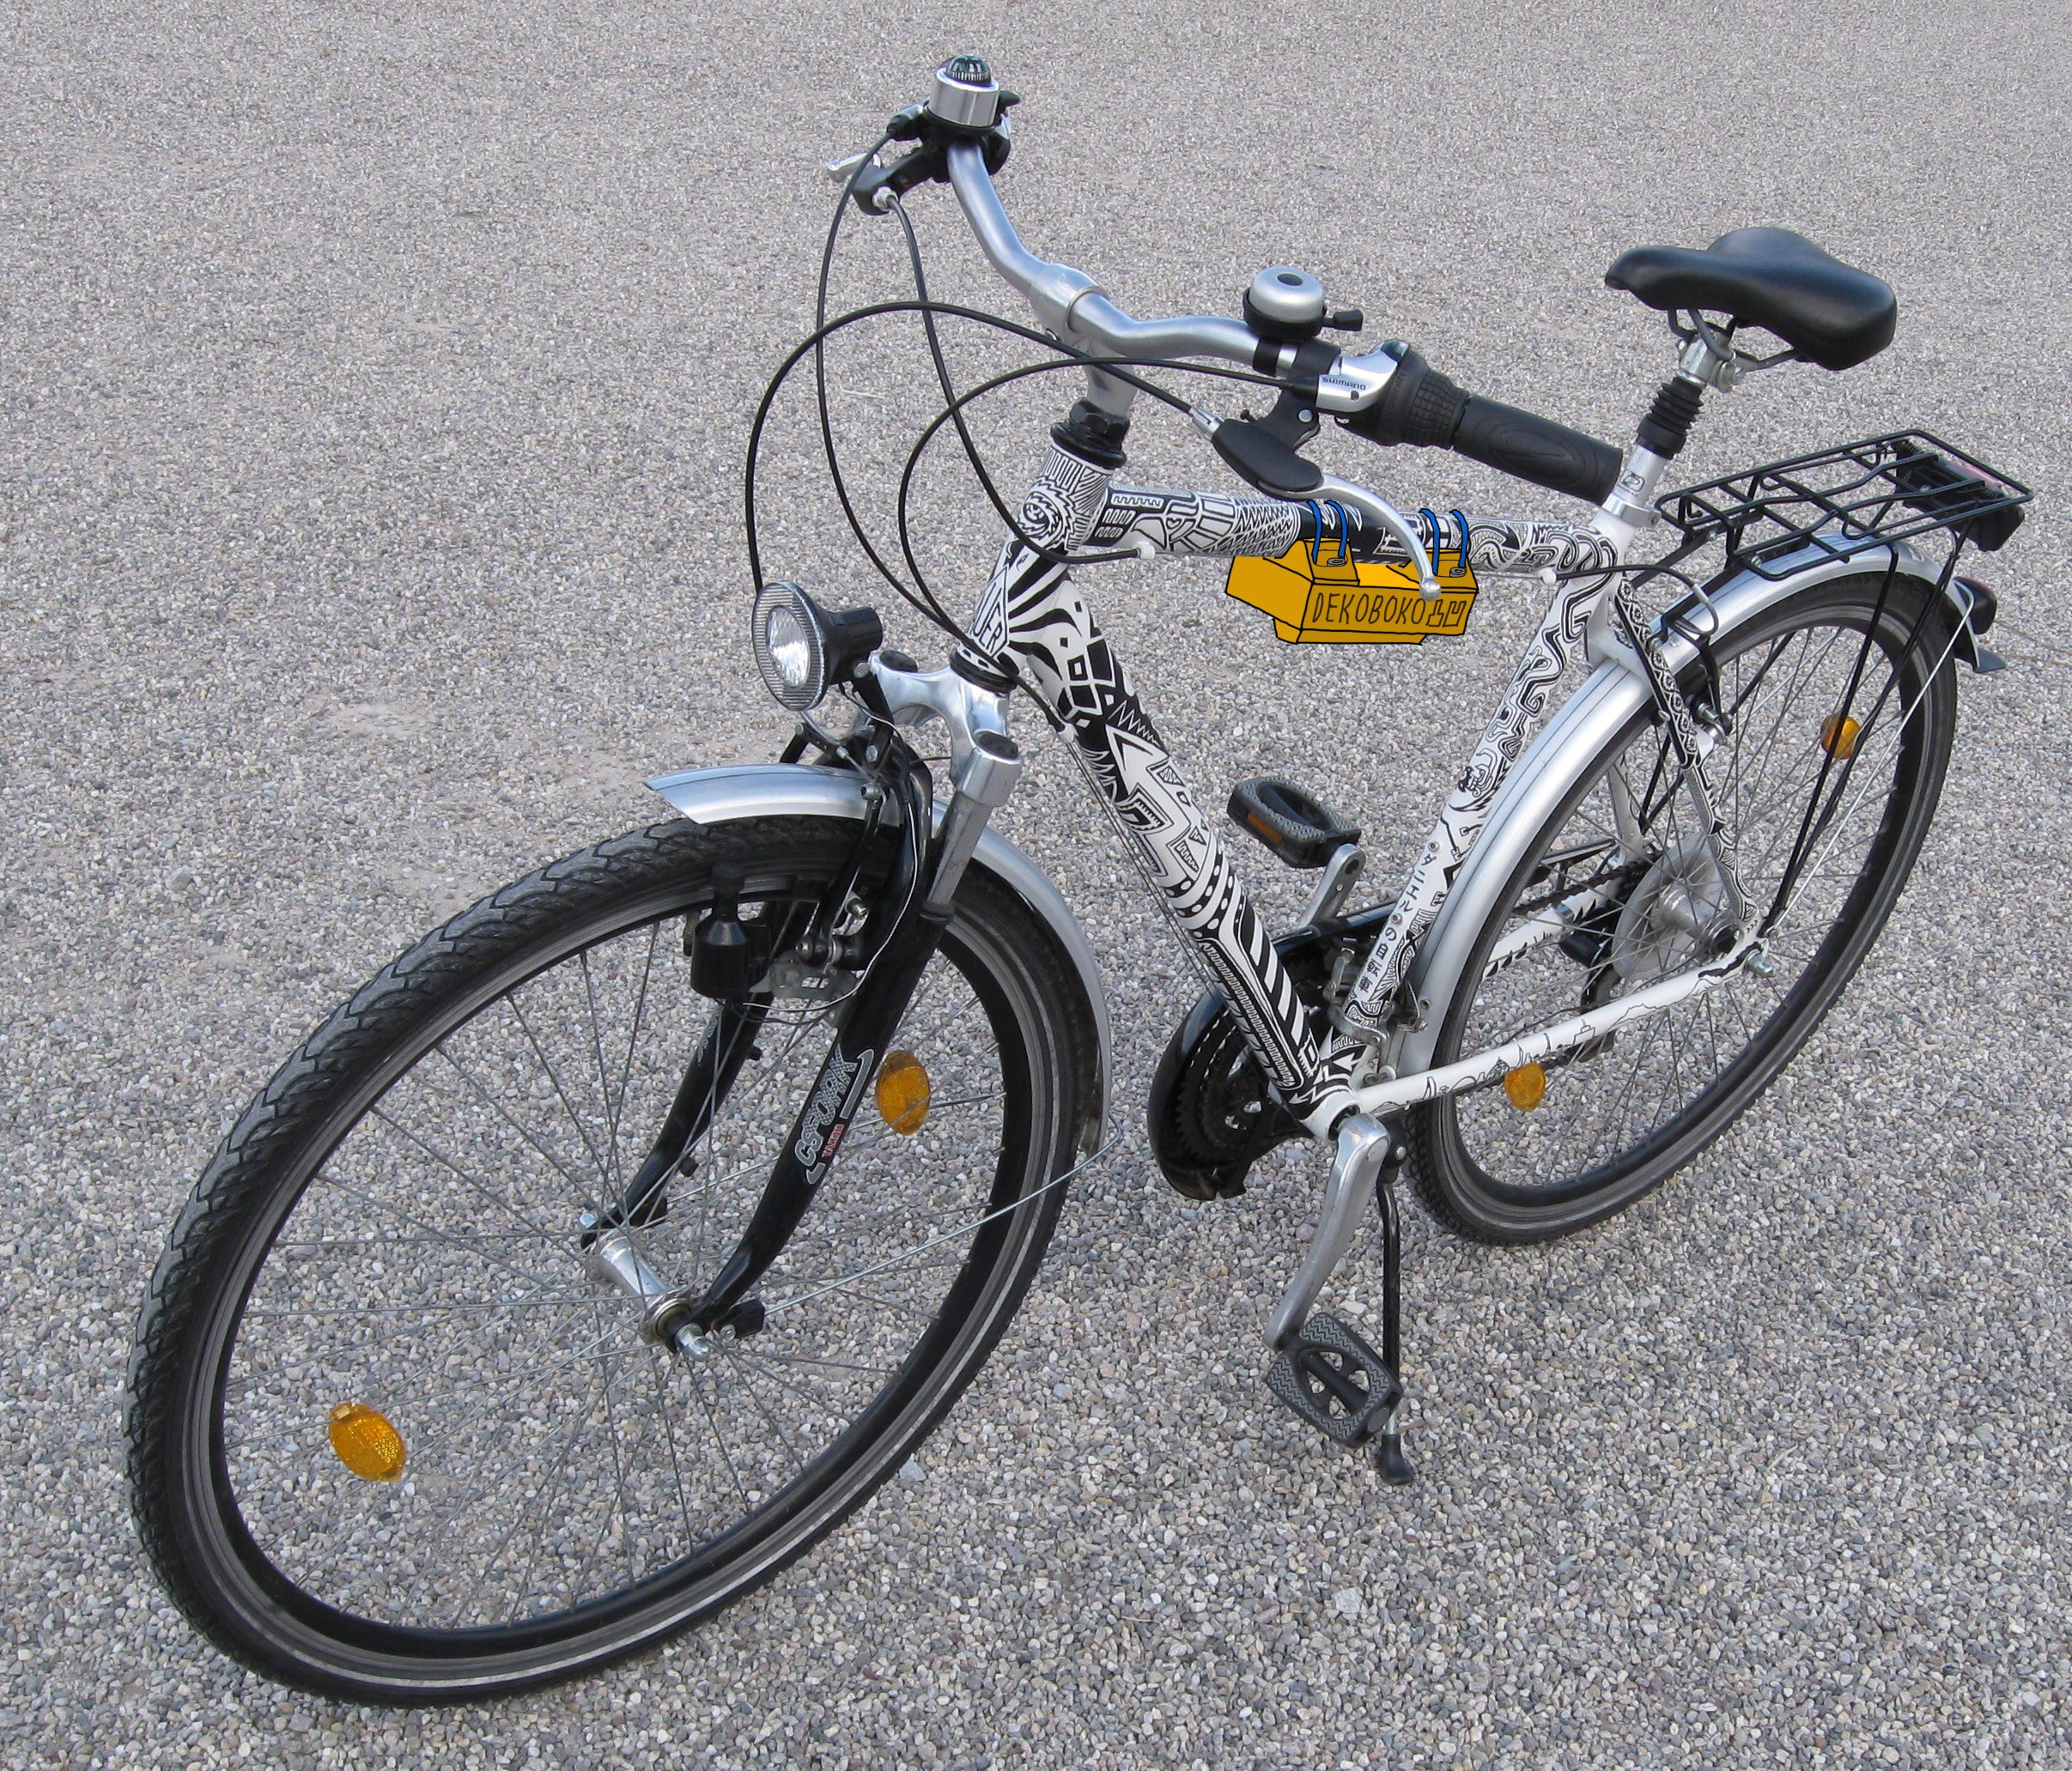
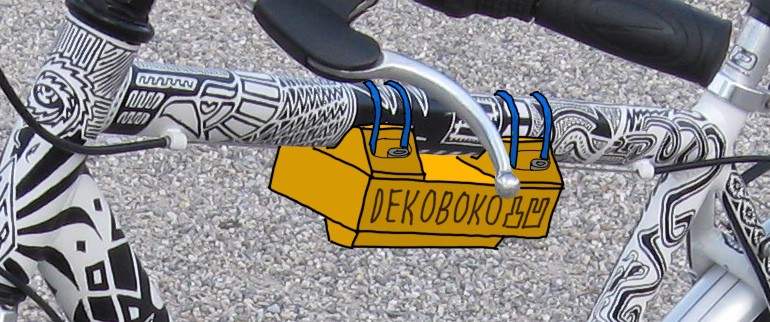
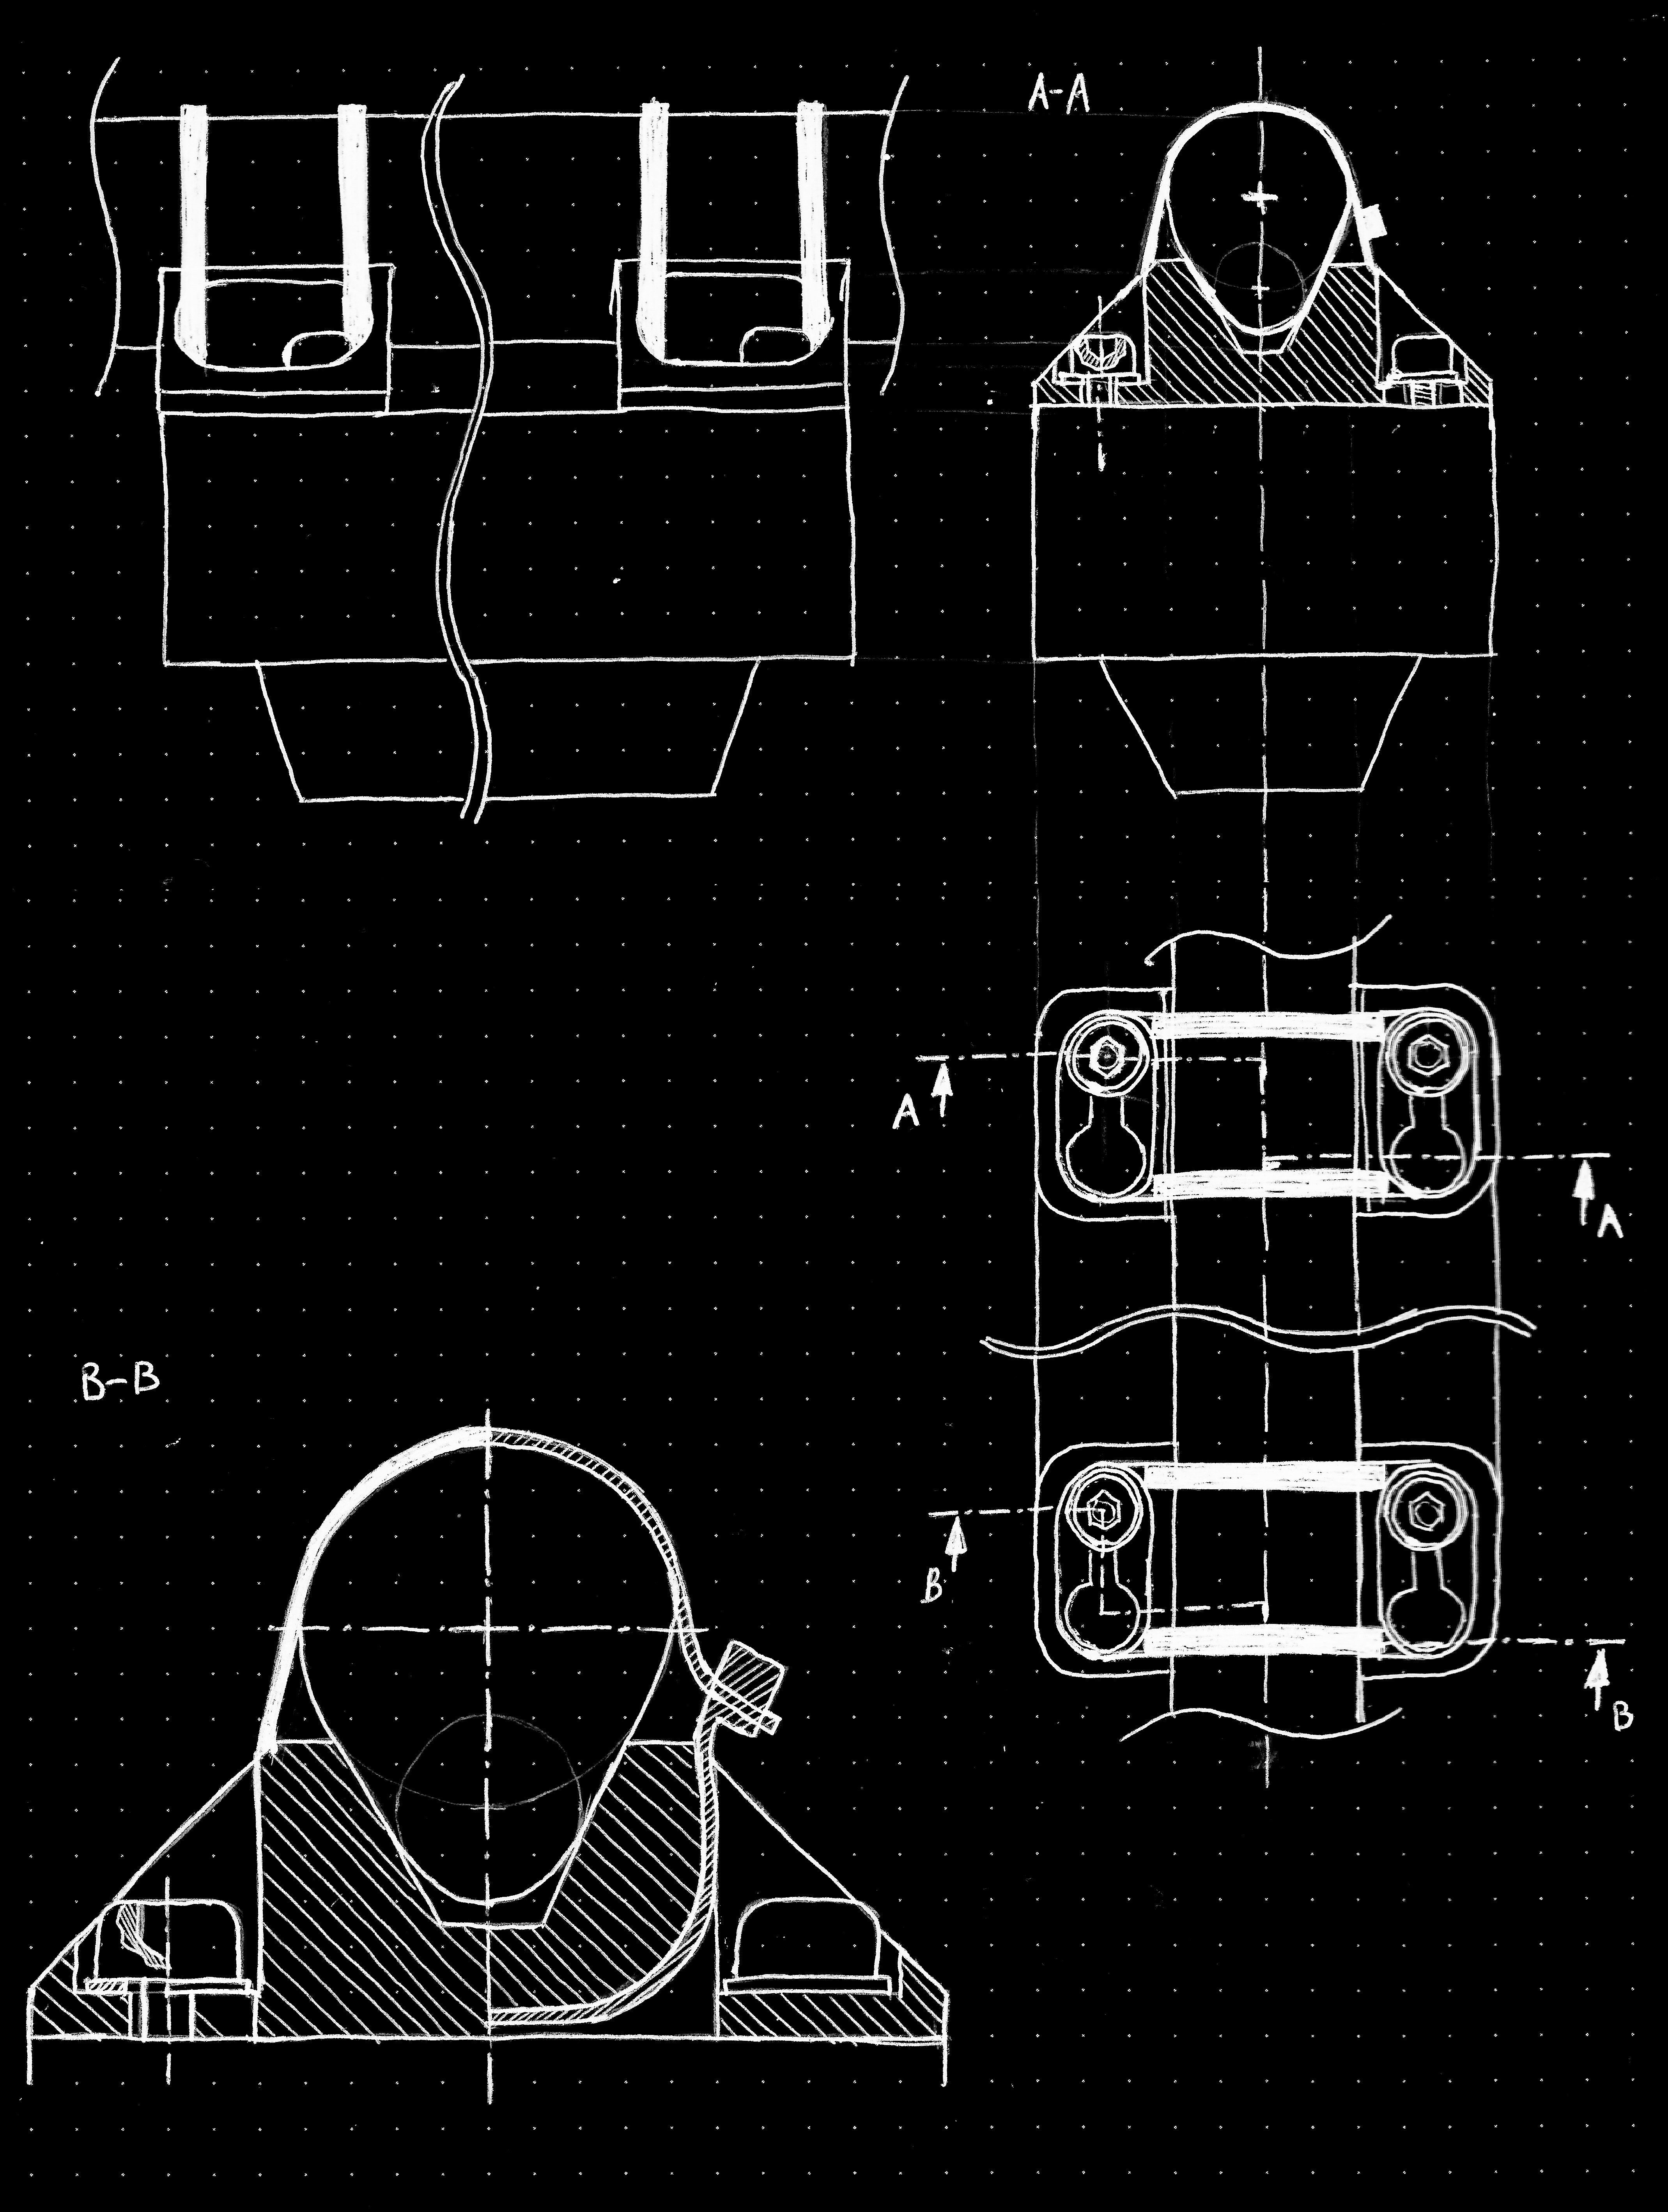
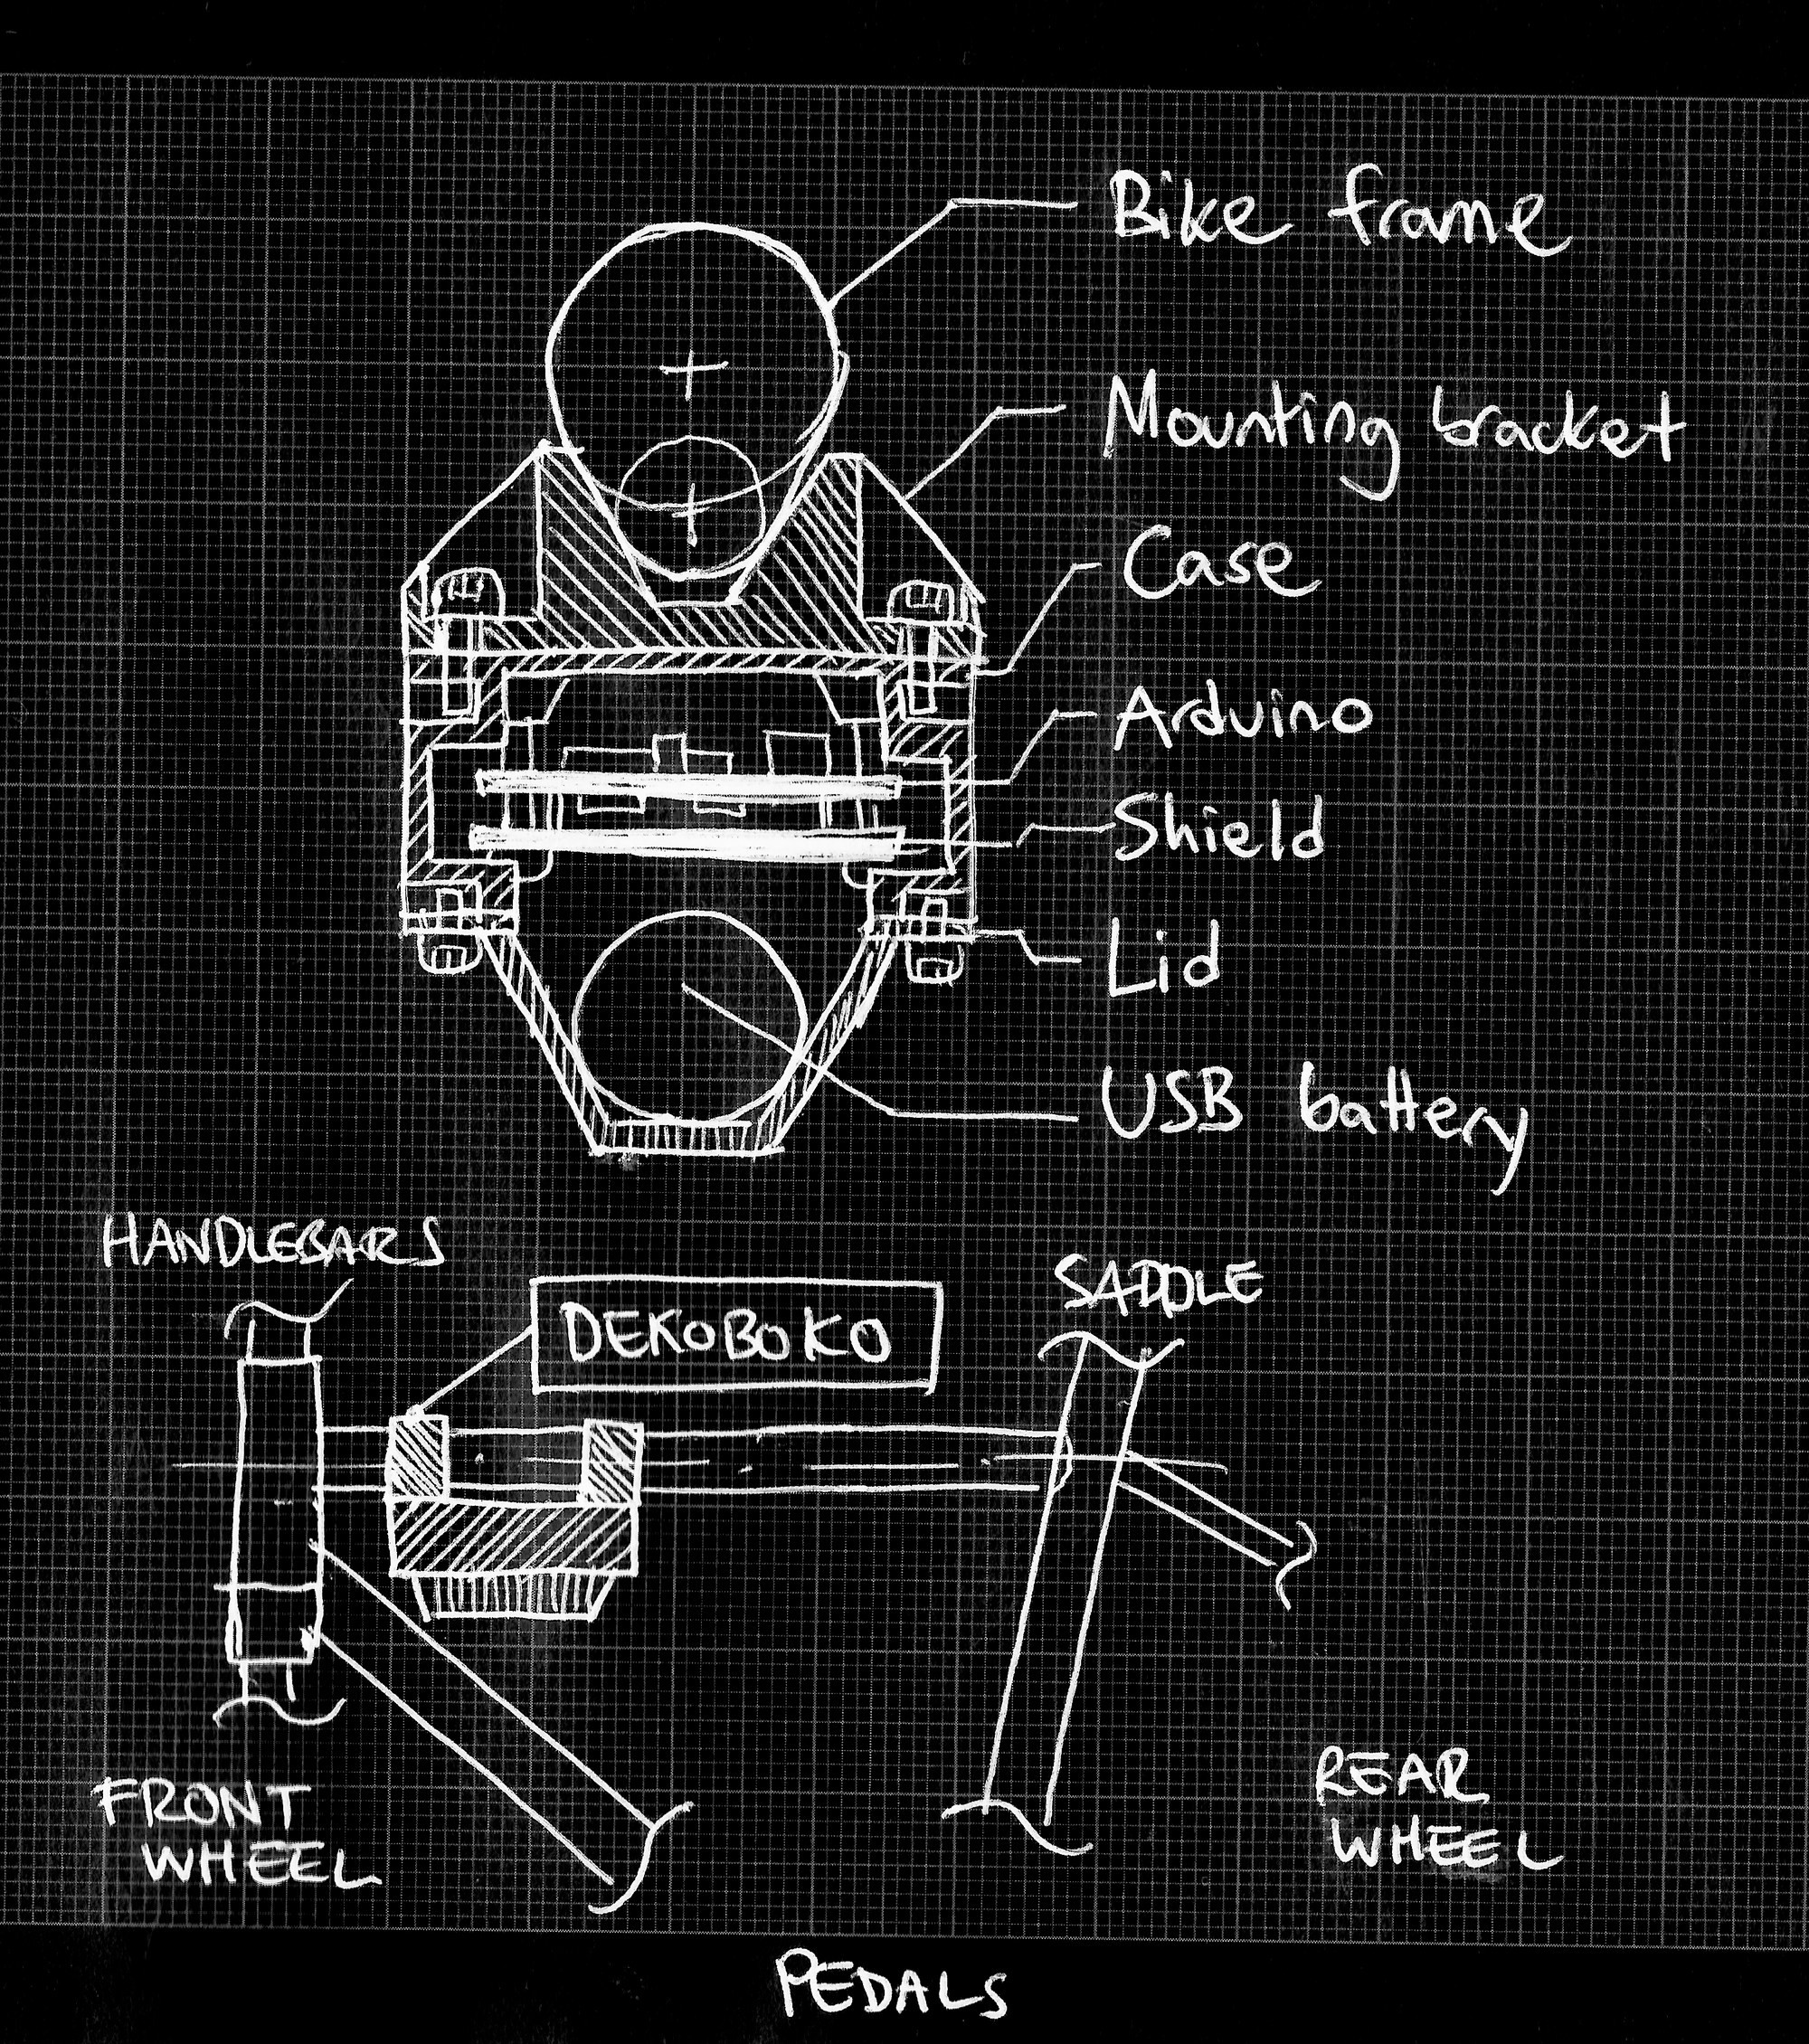
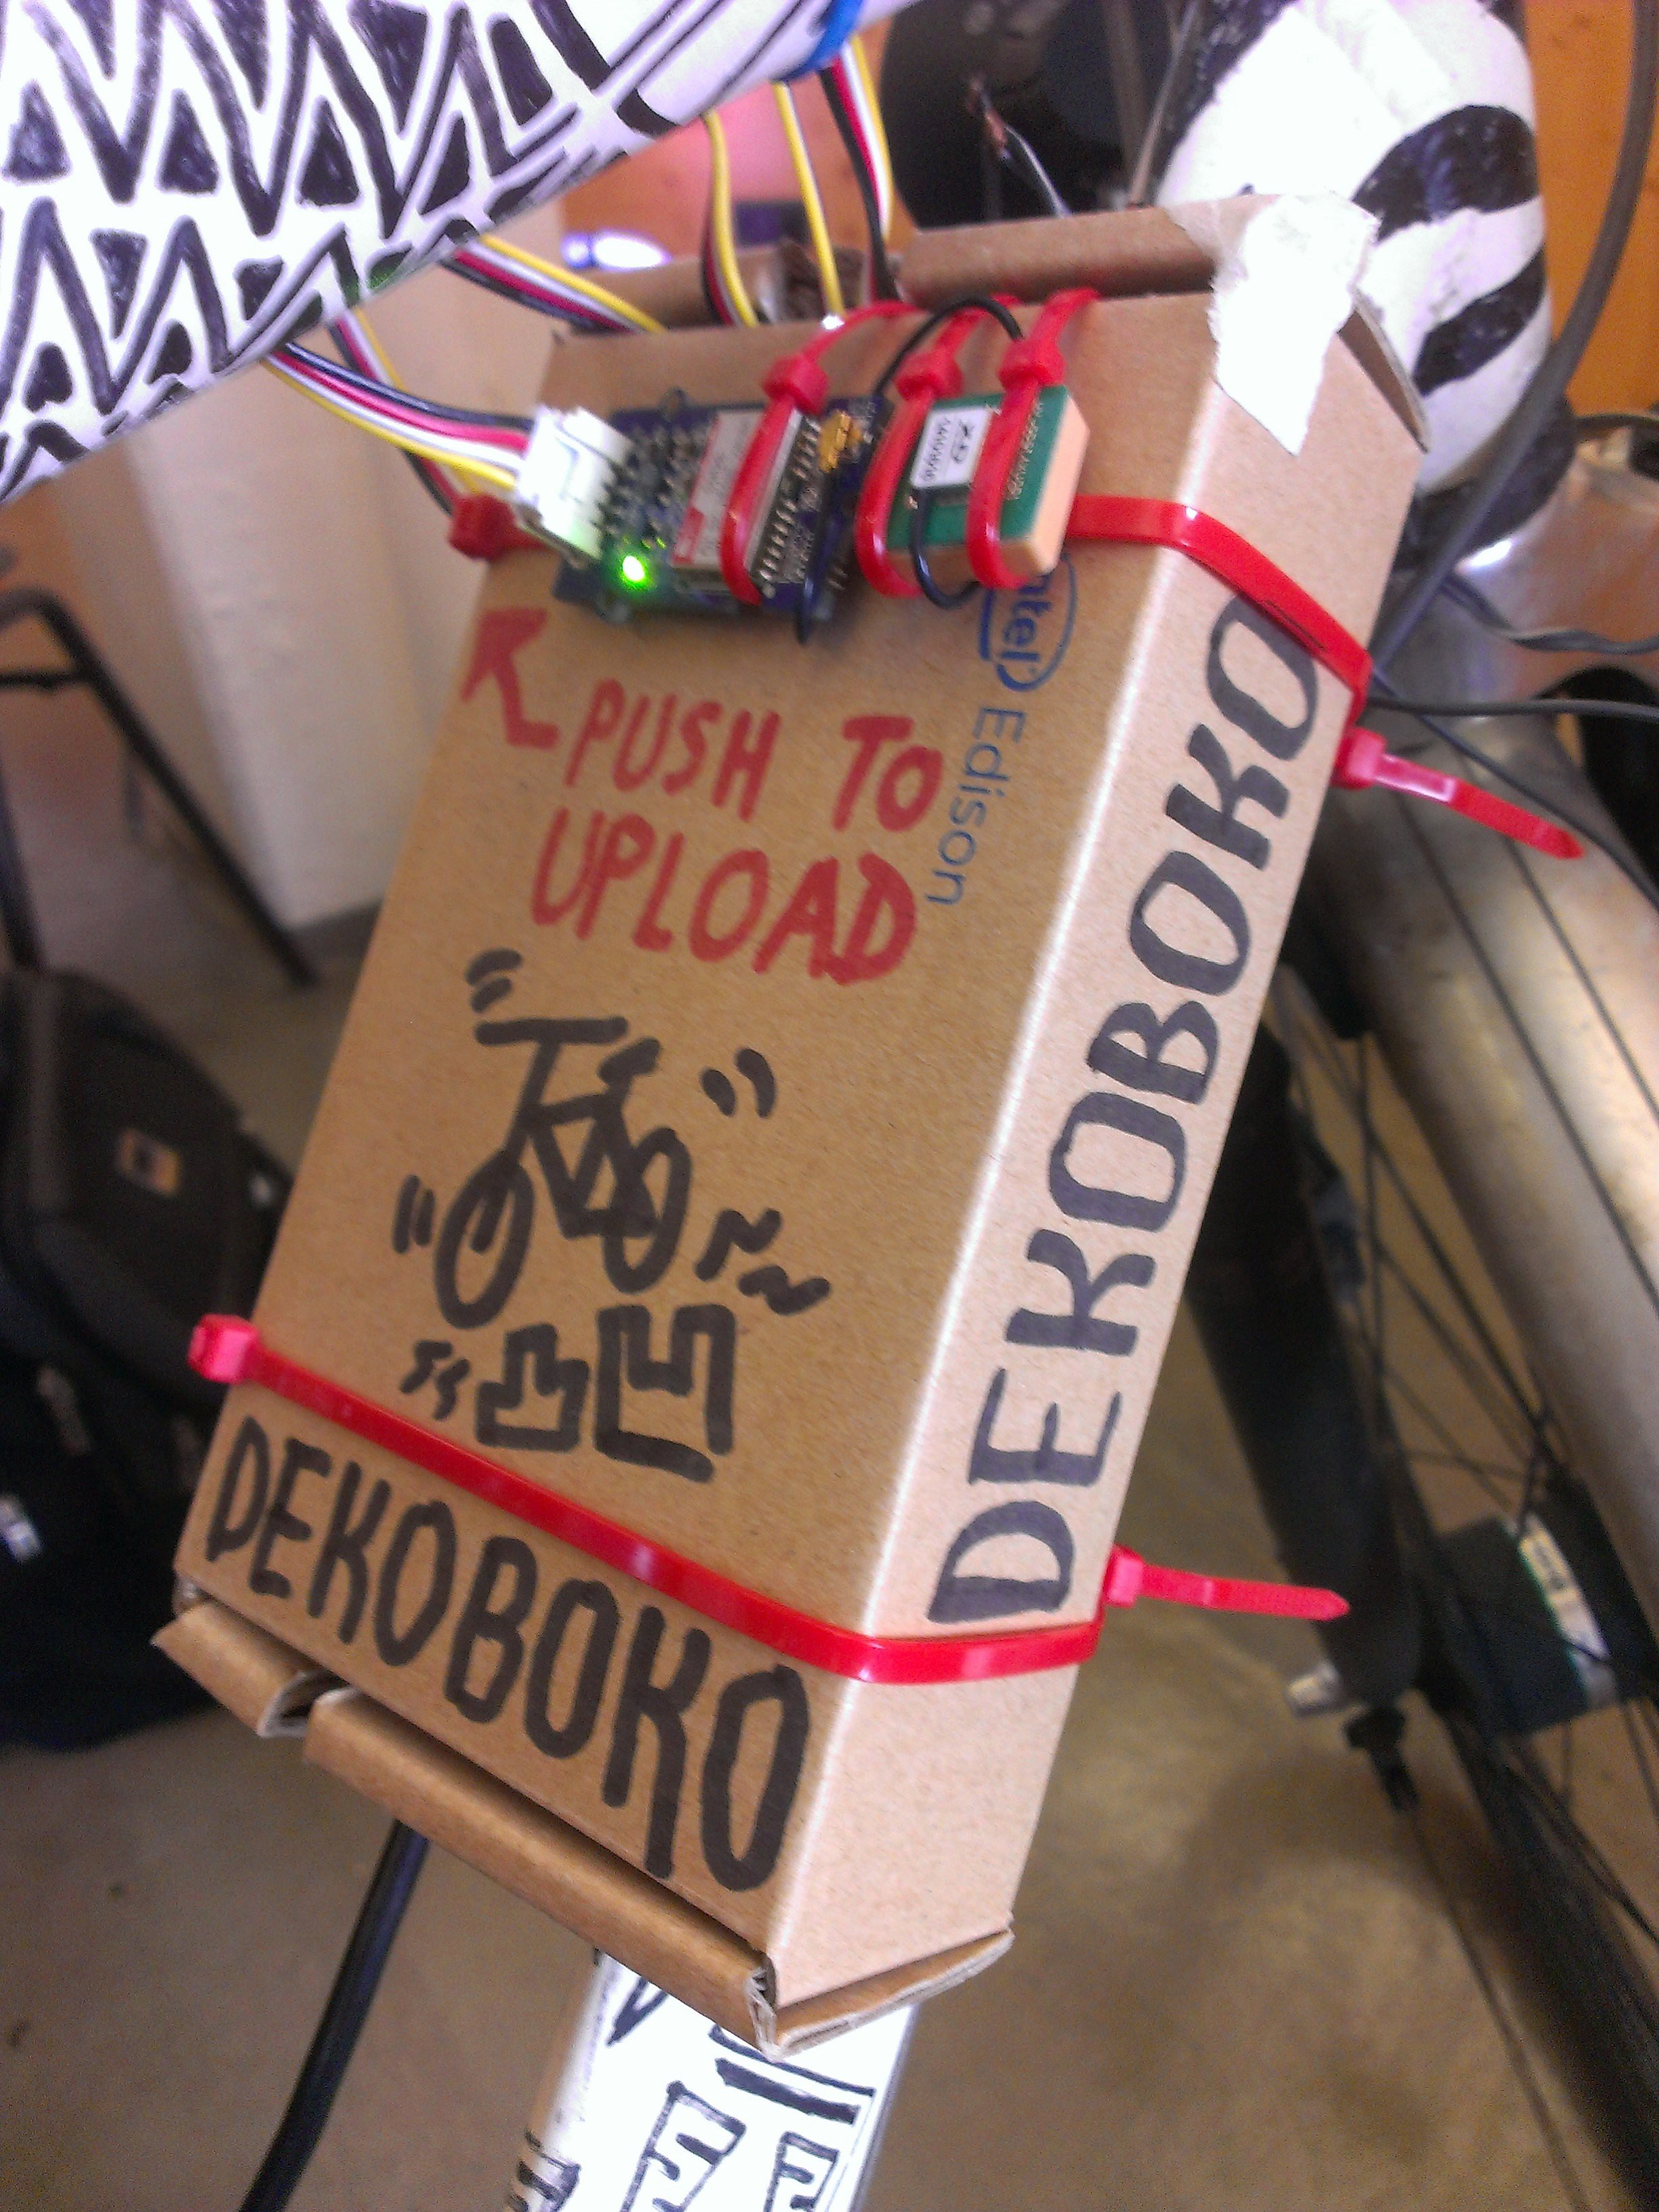
Artist's rendition of the final product attached to the bike frame.
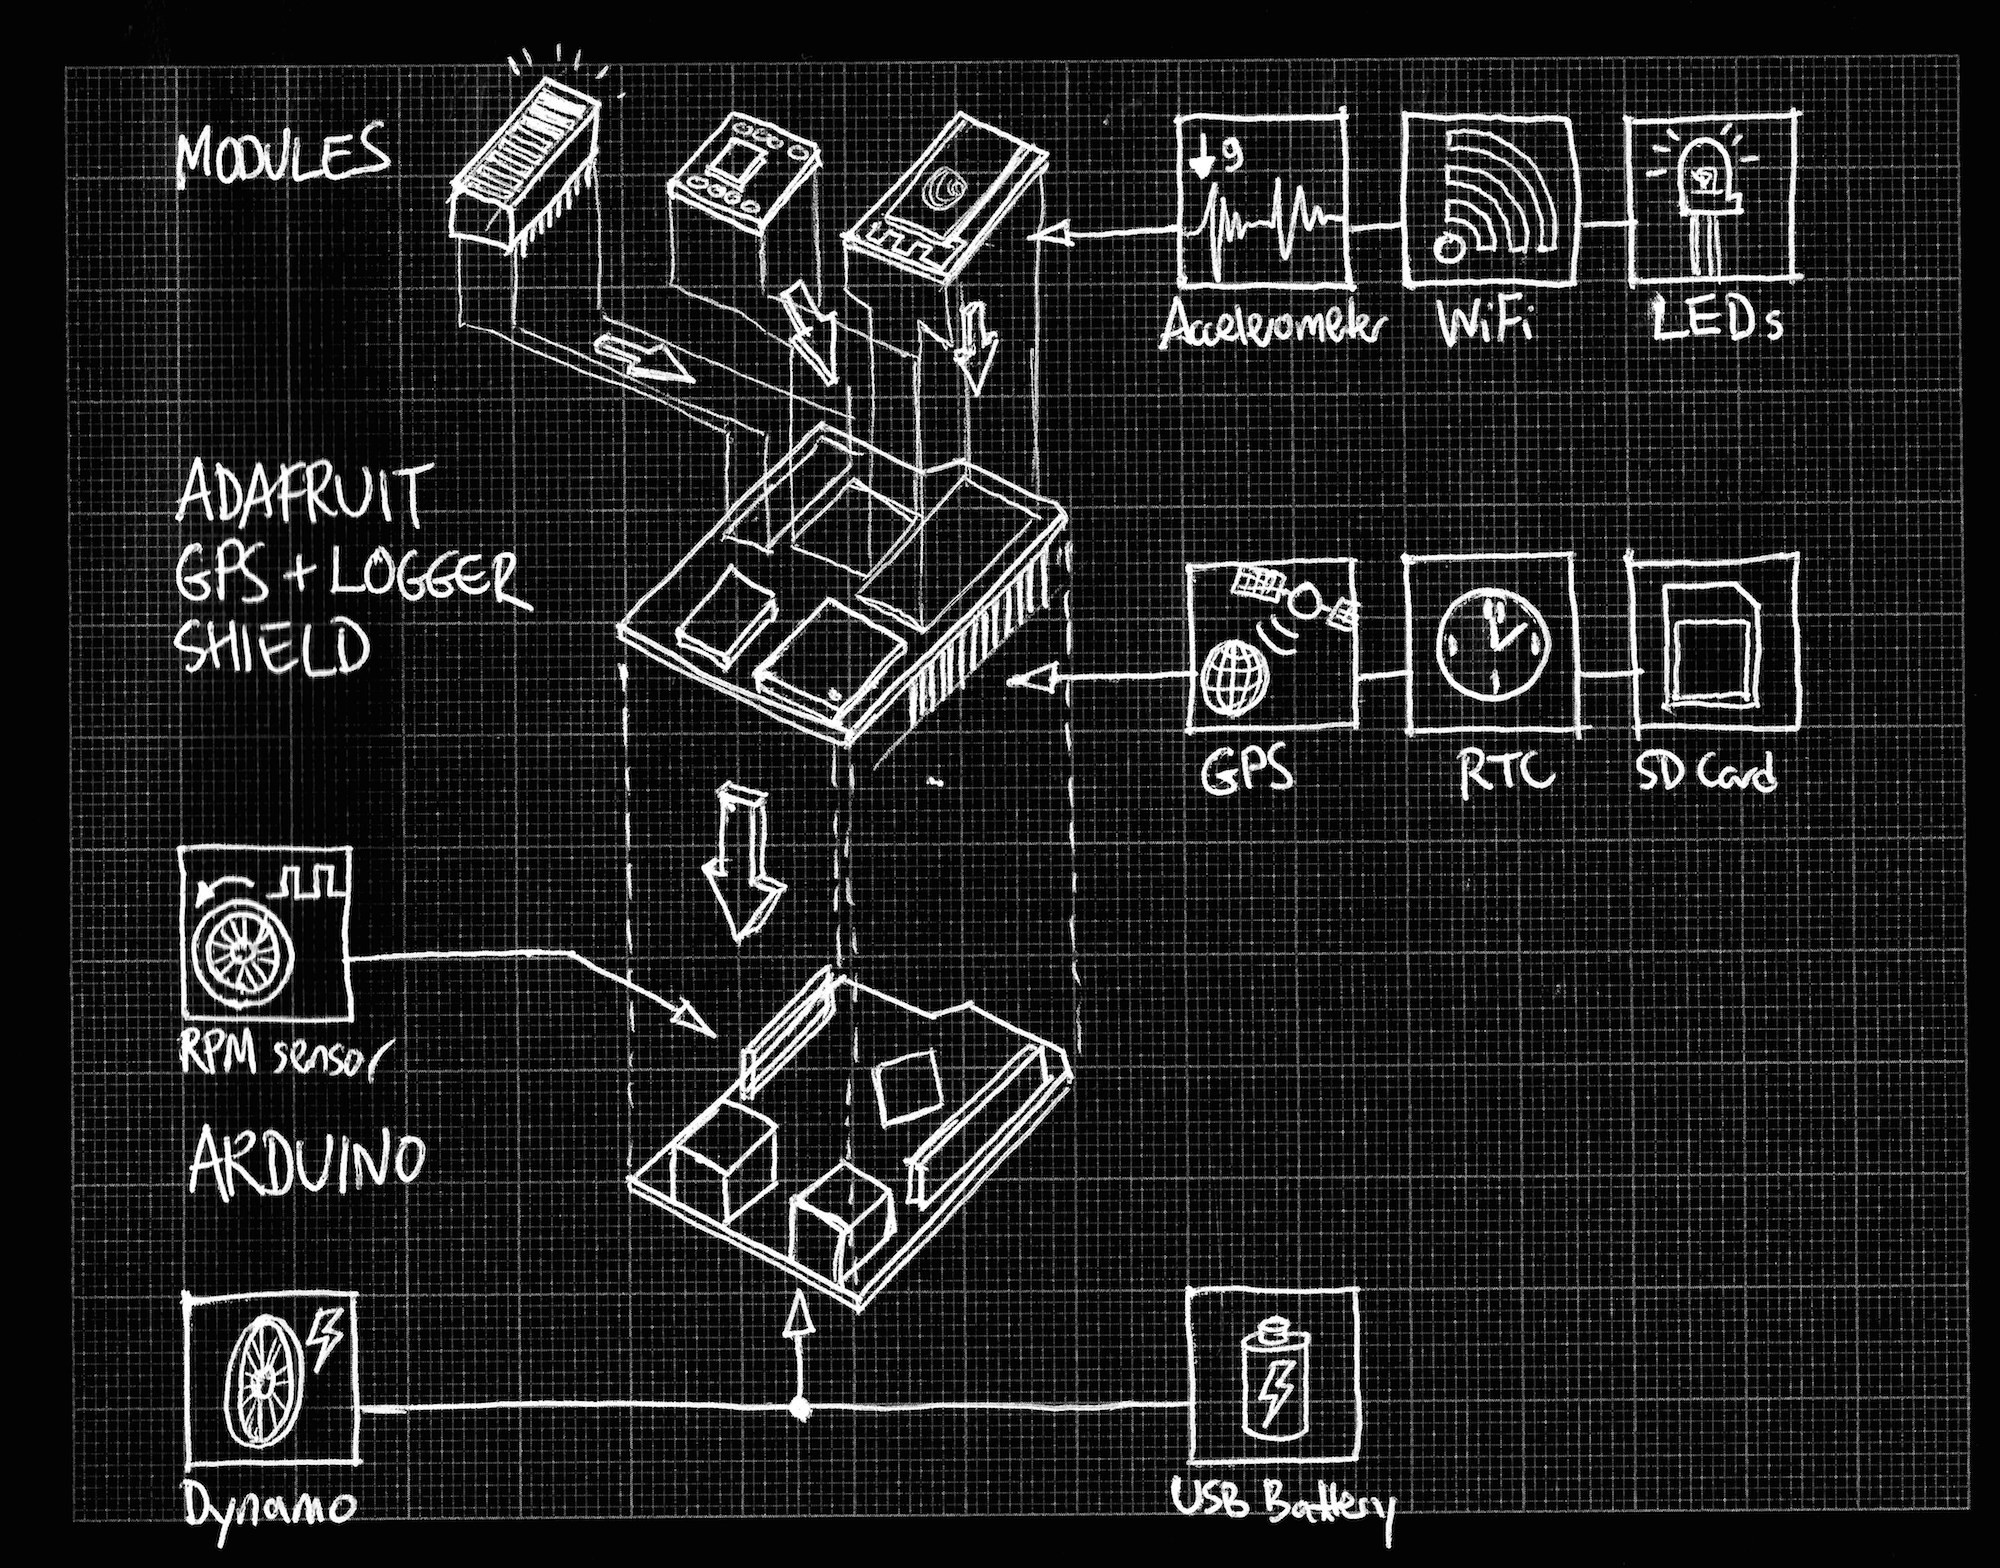
The system architecture.

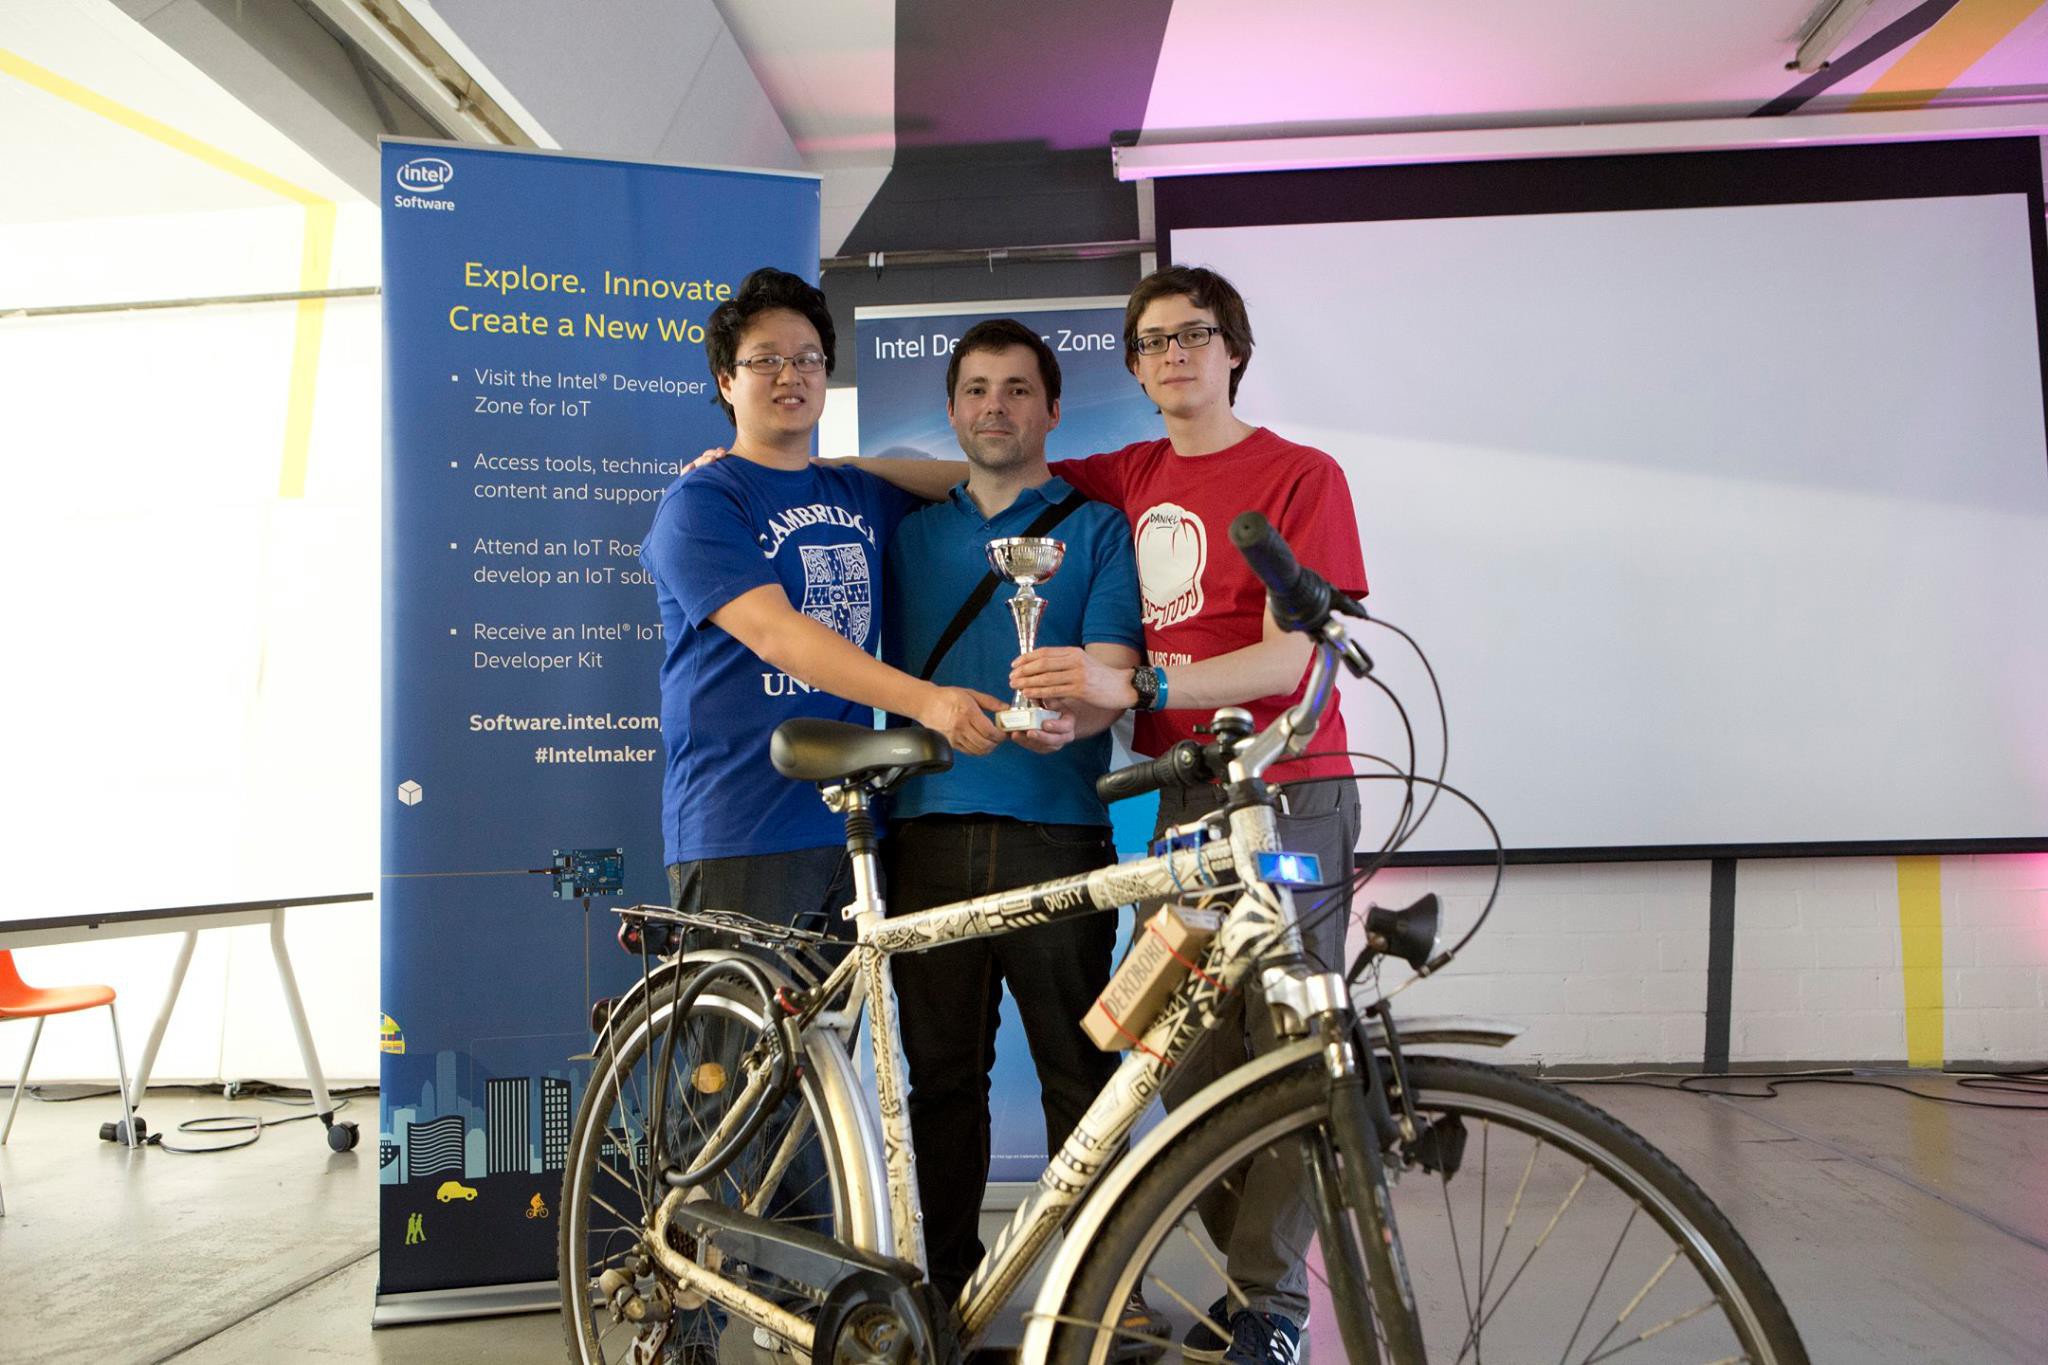
Team Dekoboko 凸凹 after winning the Intel IoT Hackathon in Berlin!
Left to right: Ben, Maxim and Daniel
Current status:
Working:
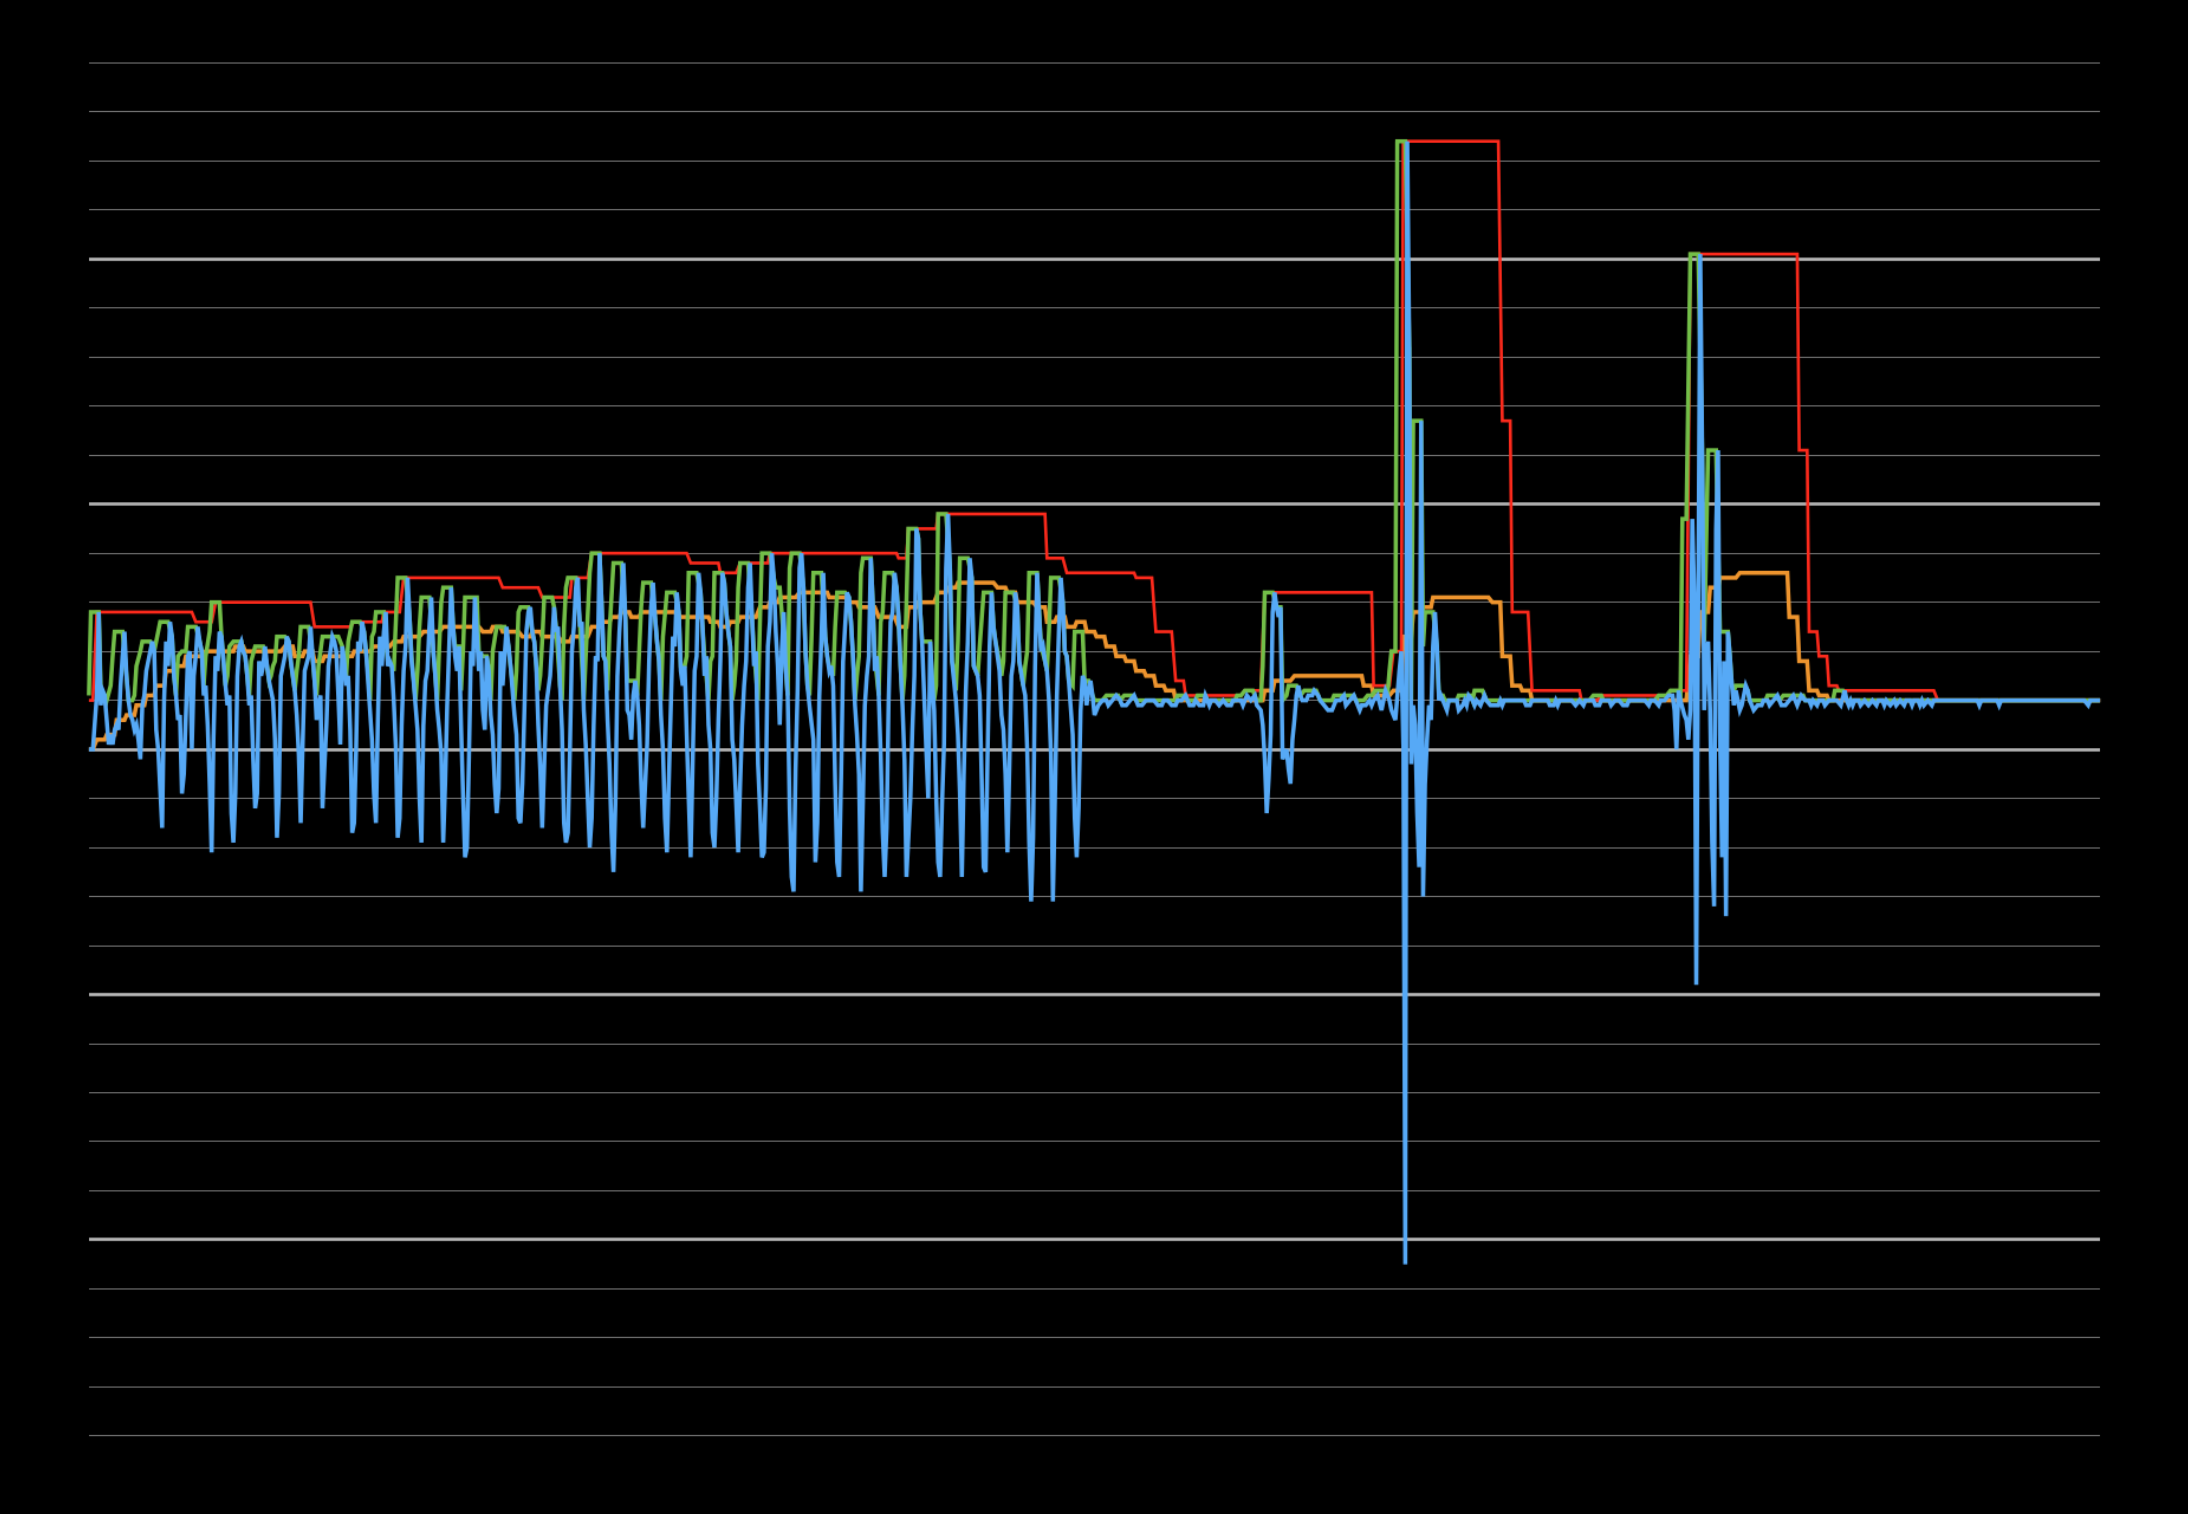
- Recording accelerometer data, smoothing
- Parsing GPS data
- Logging timestamped data
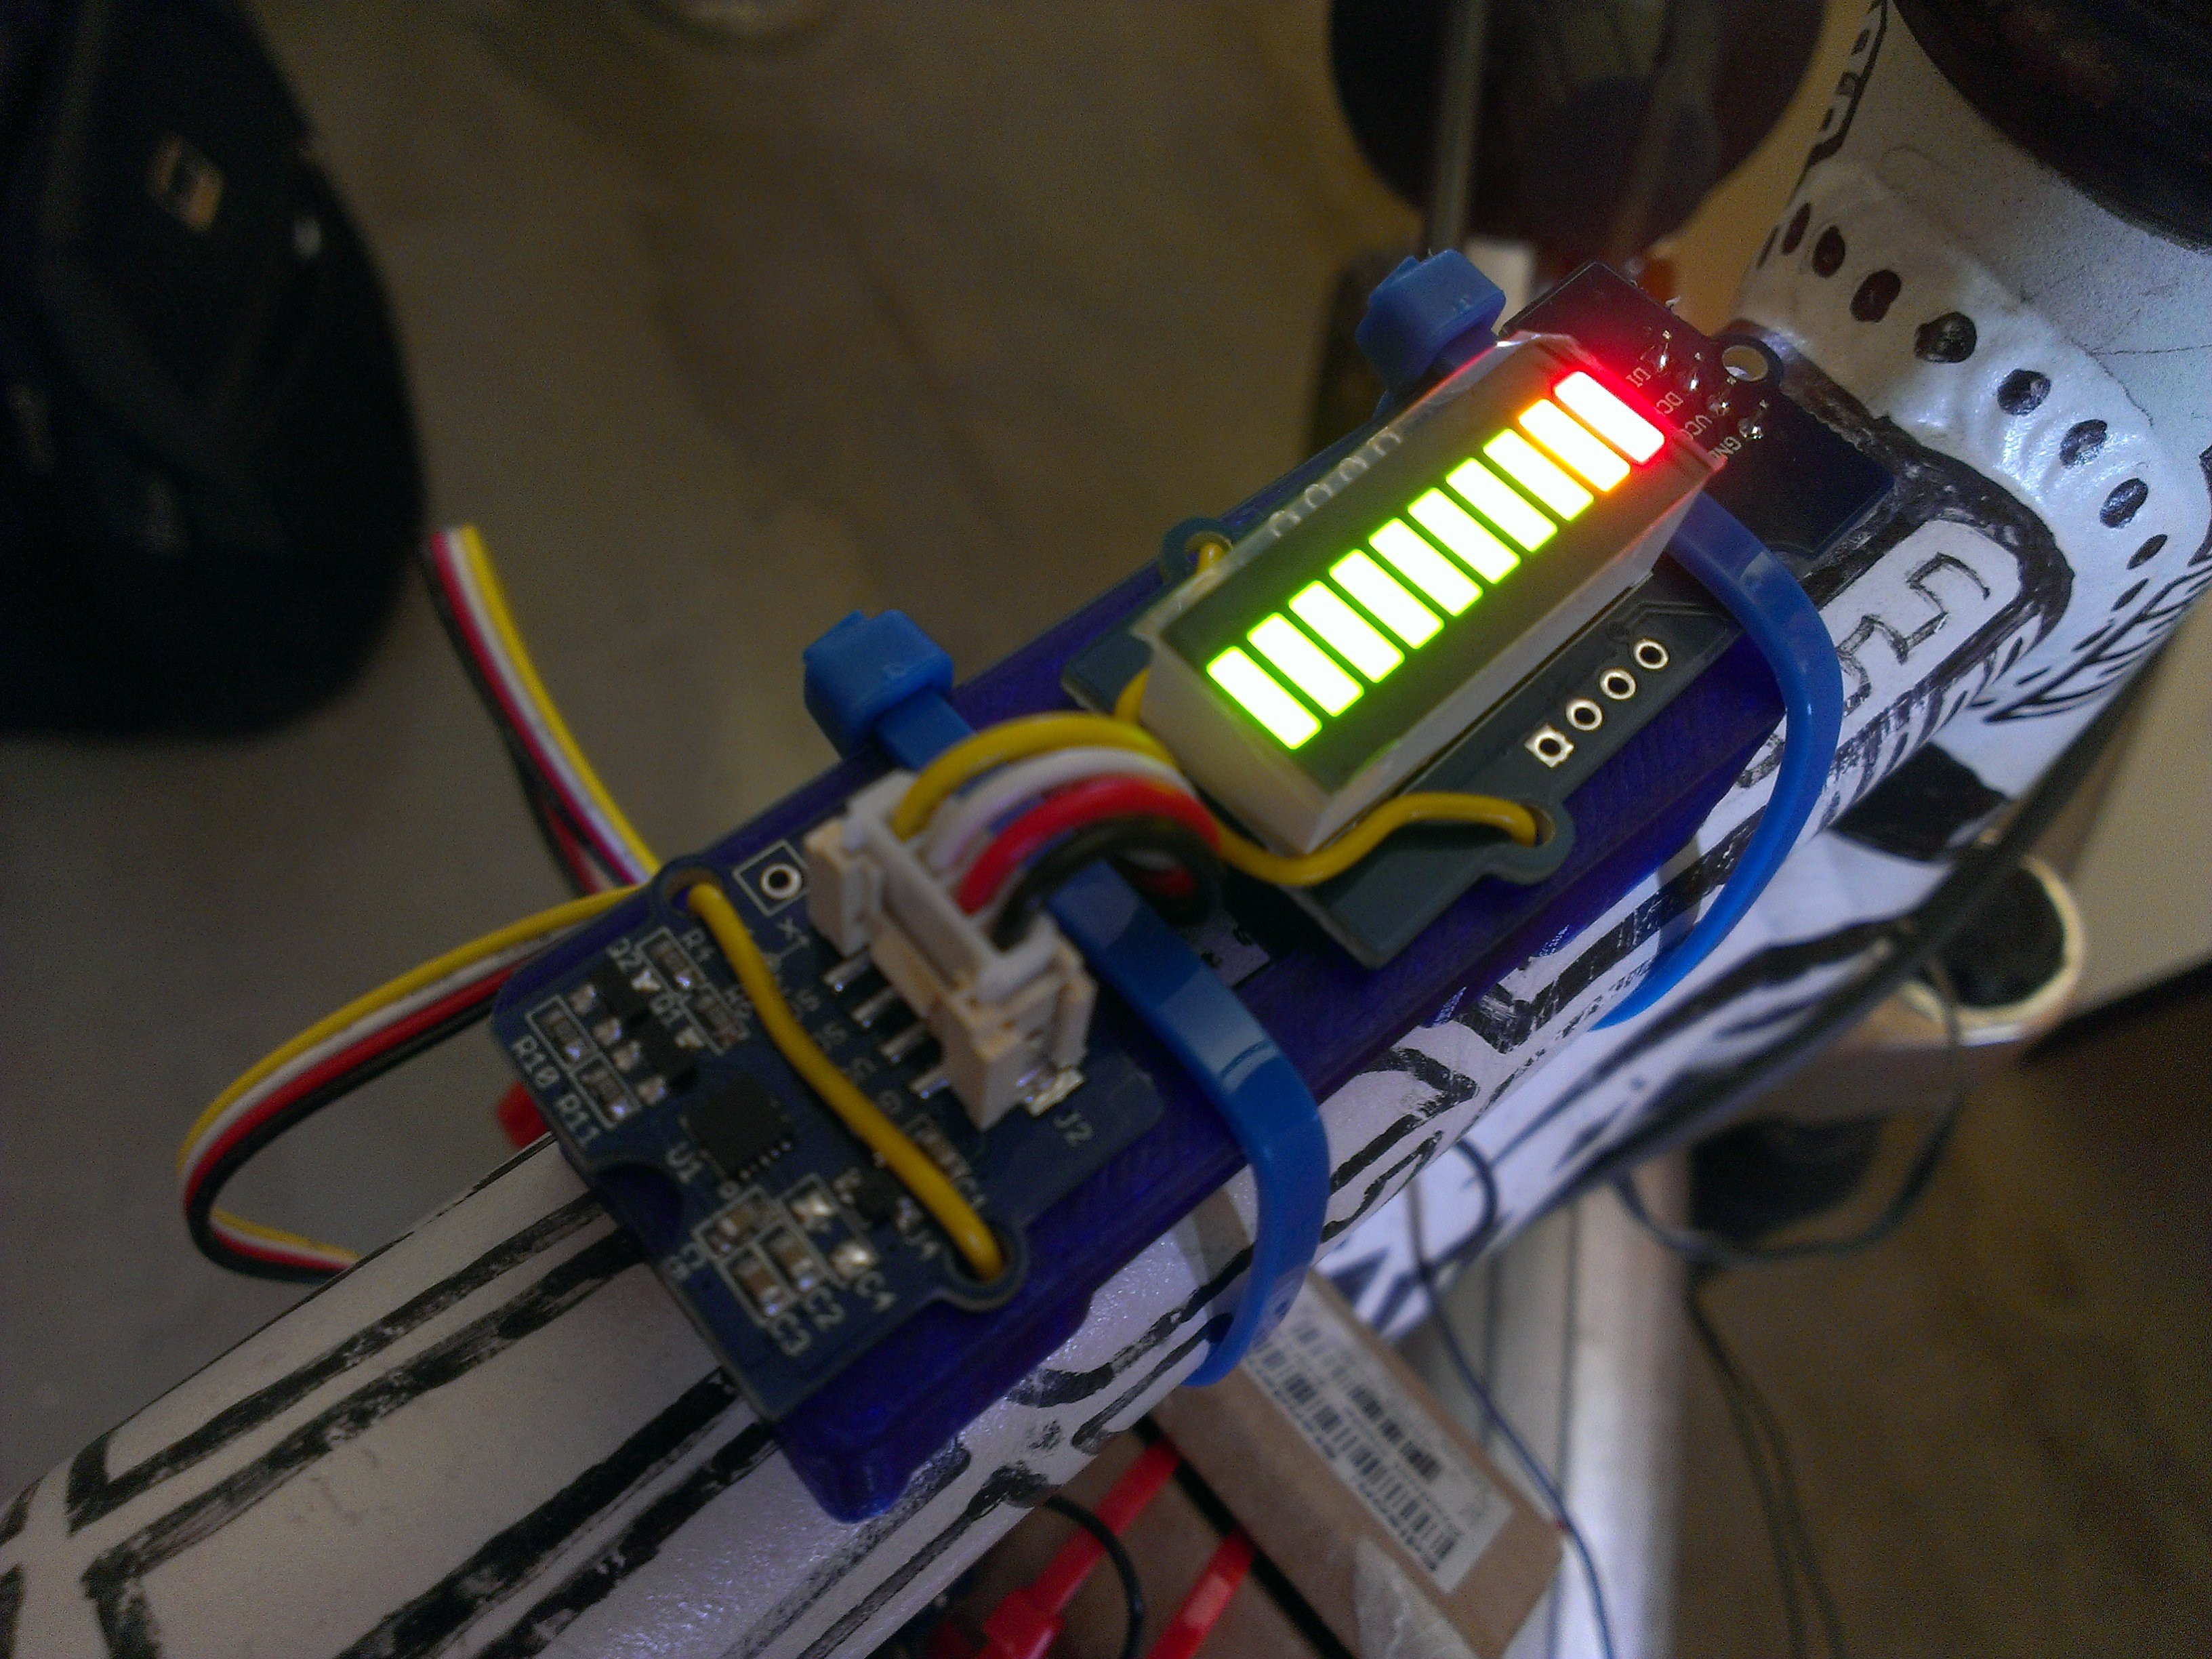
- Basic pothole detection (indicated by dedicated LED)
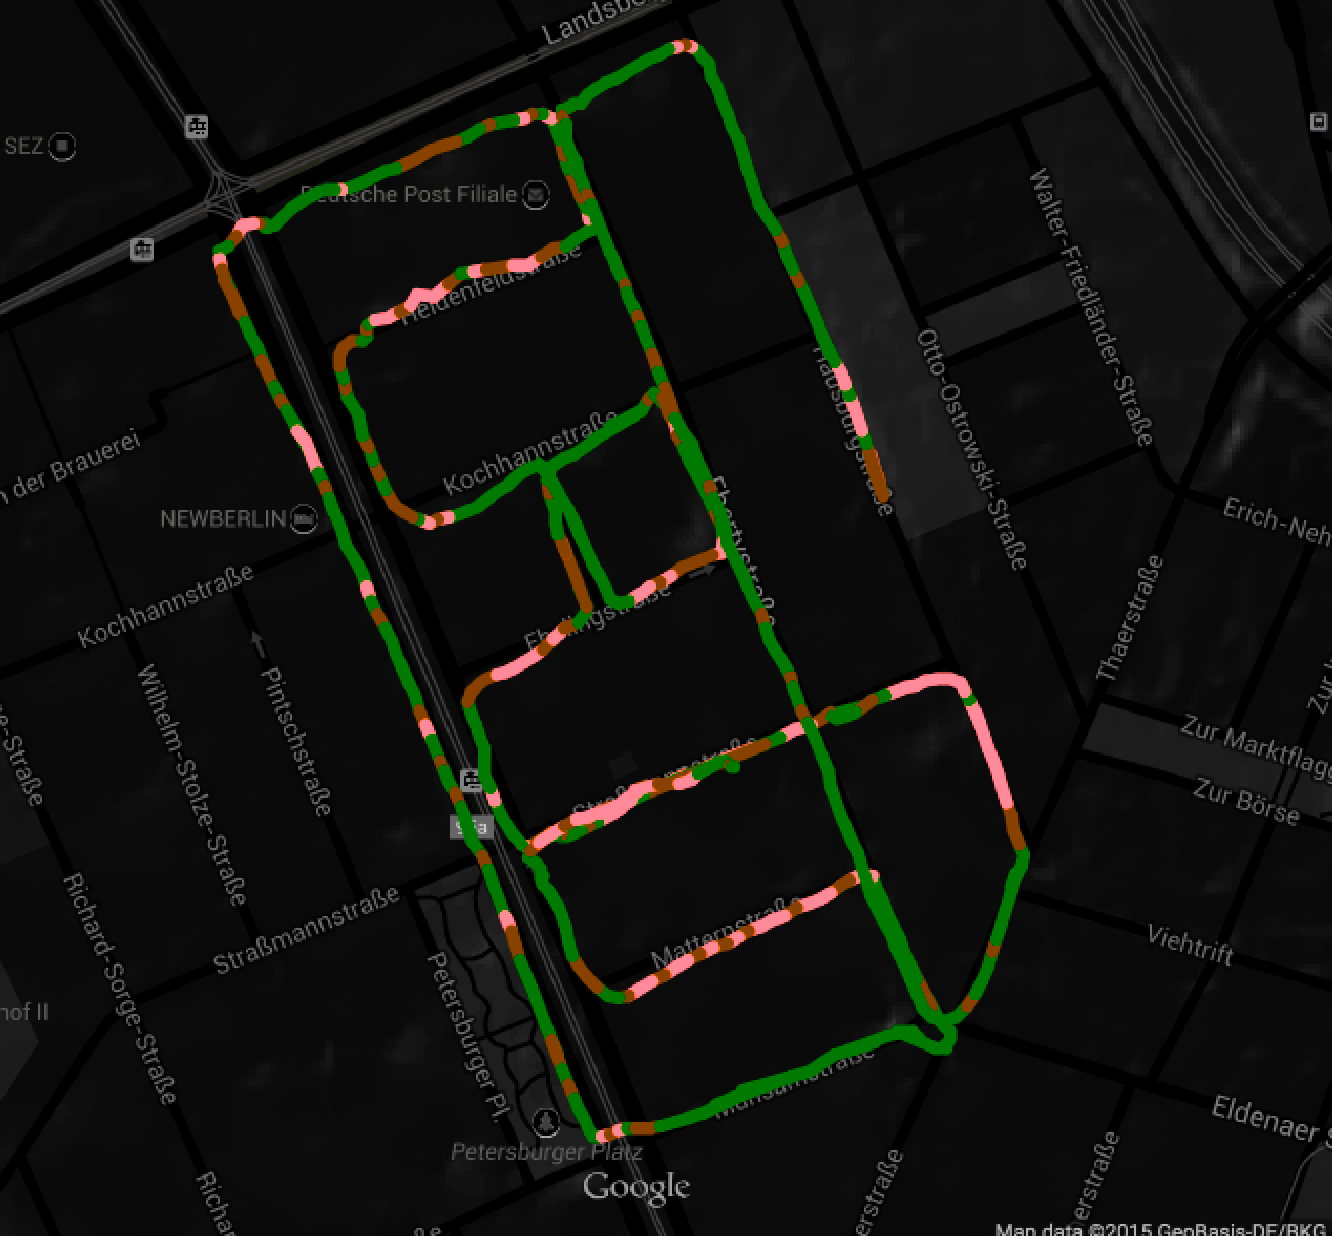
- Basic visualization of route and road quality
To-do:
- One-touch upload (integrate ESP8266)
- Detailed analysis of data
Version history:
First version:
Created during the Intel IoT Roadshow Hackathon, using the Intel Edison and Grove modules for the accelerometer, GPS, LED bar graph and upload button.
Visualization website is up and running.
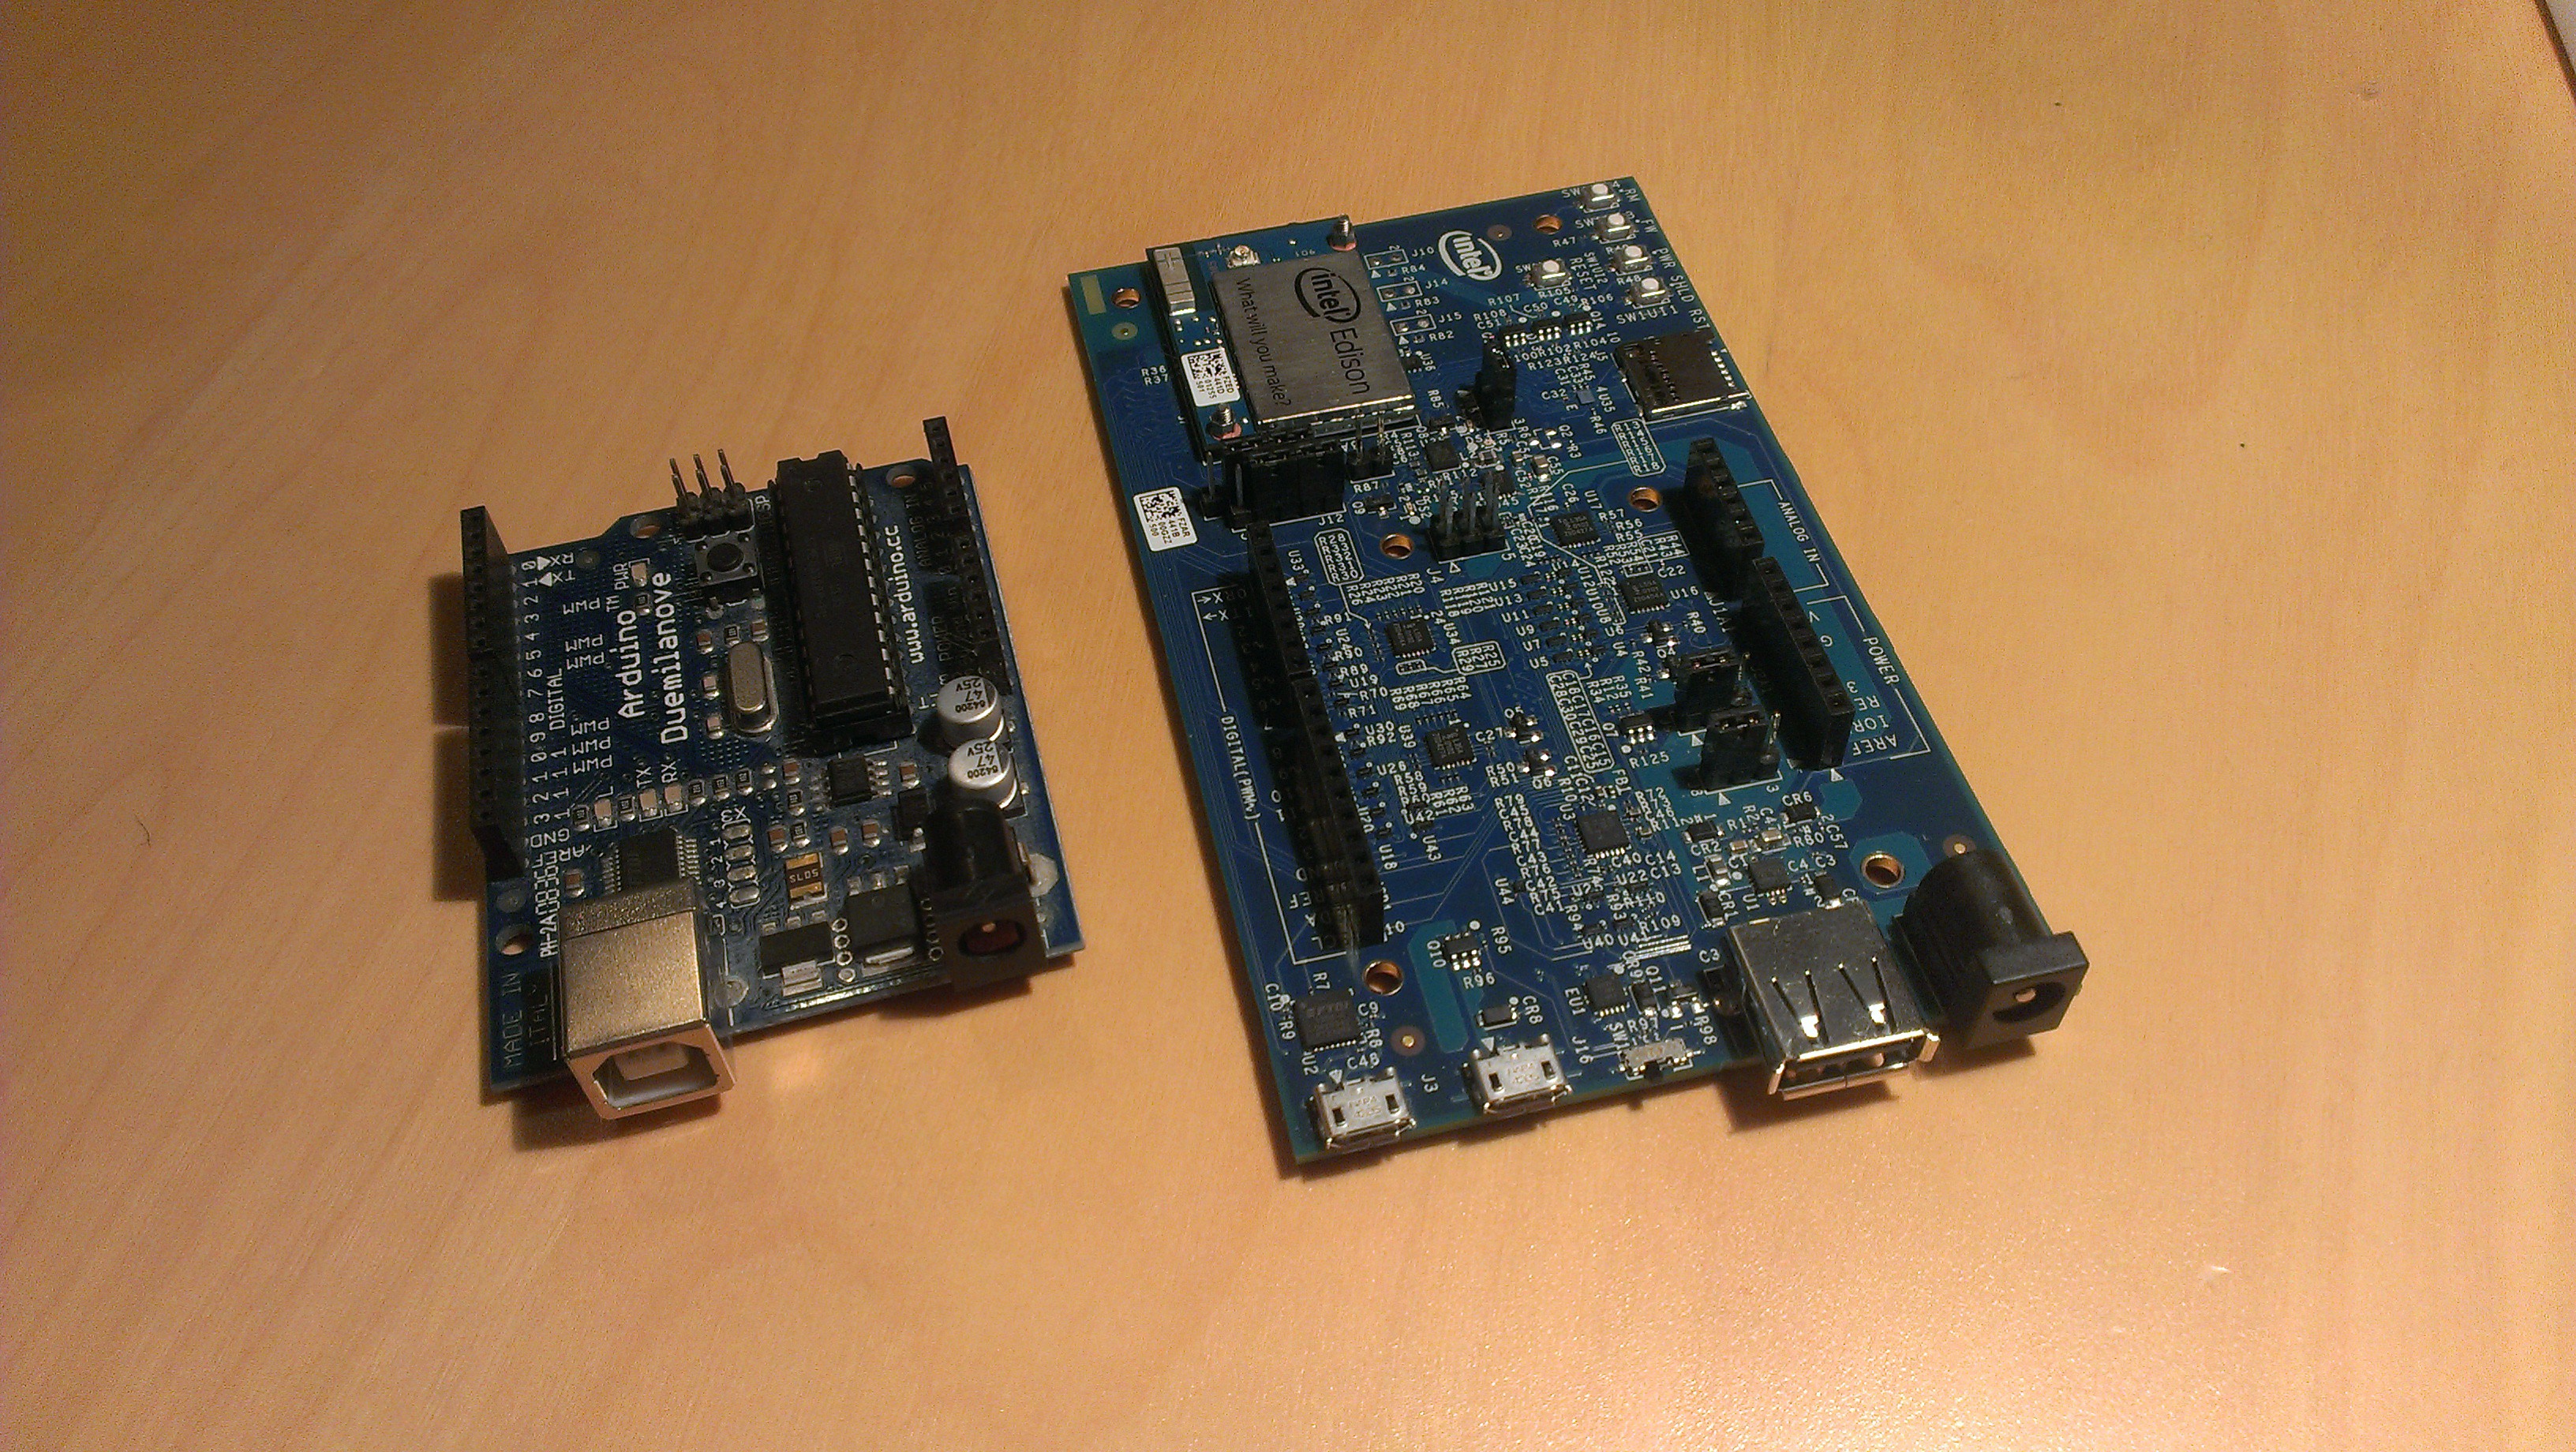
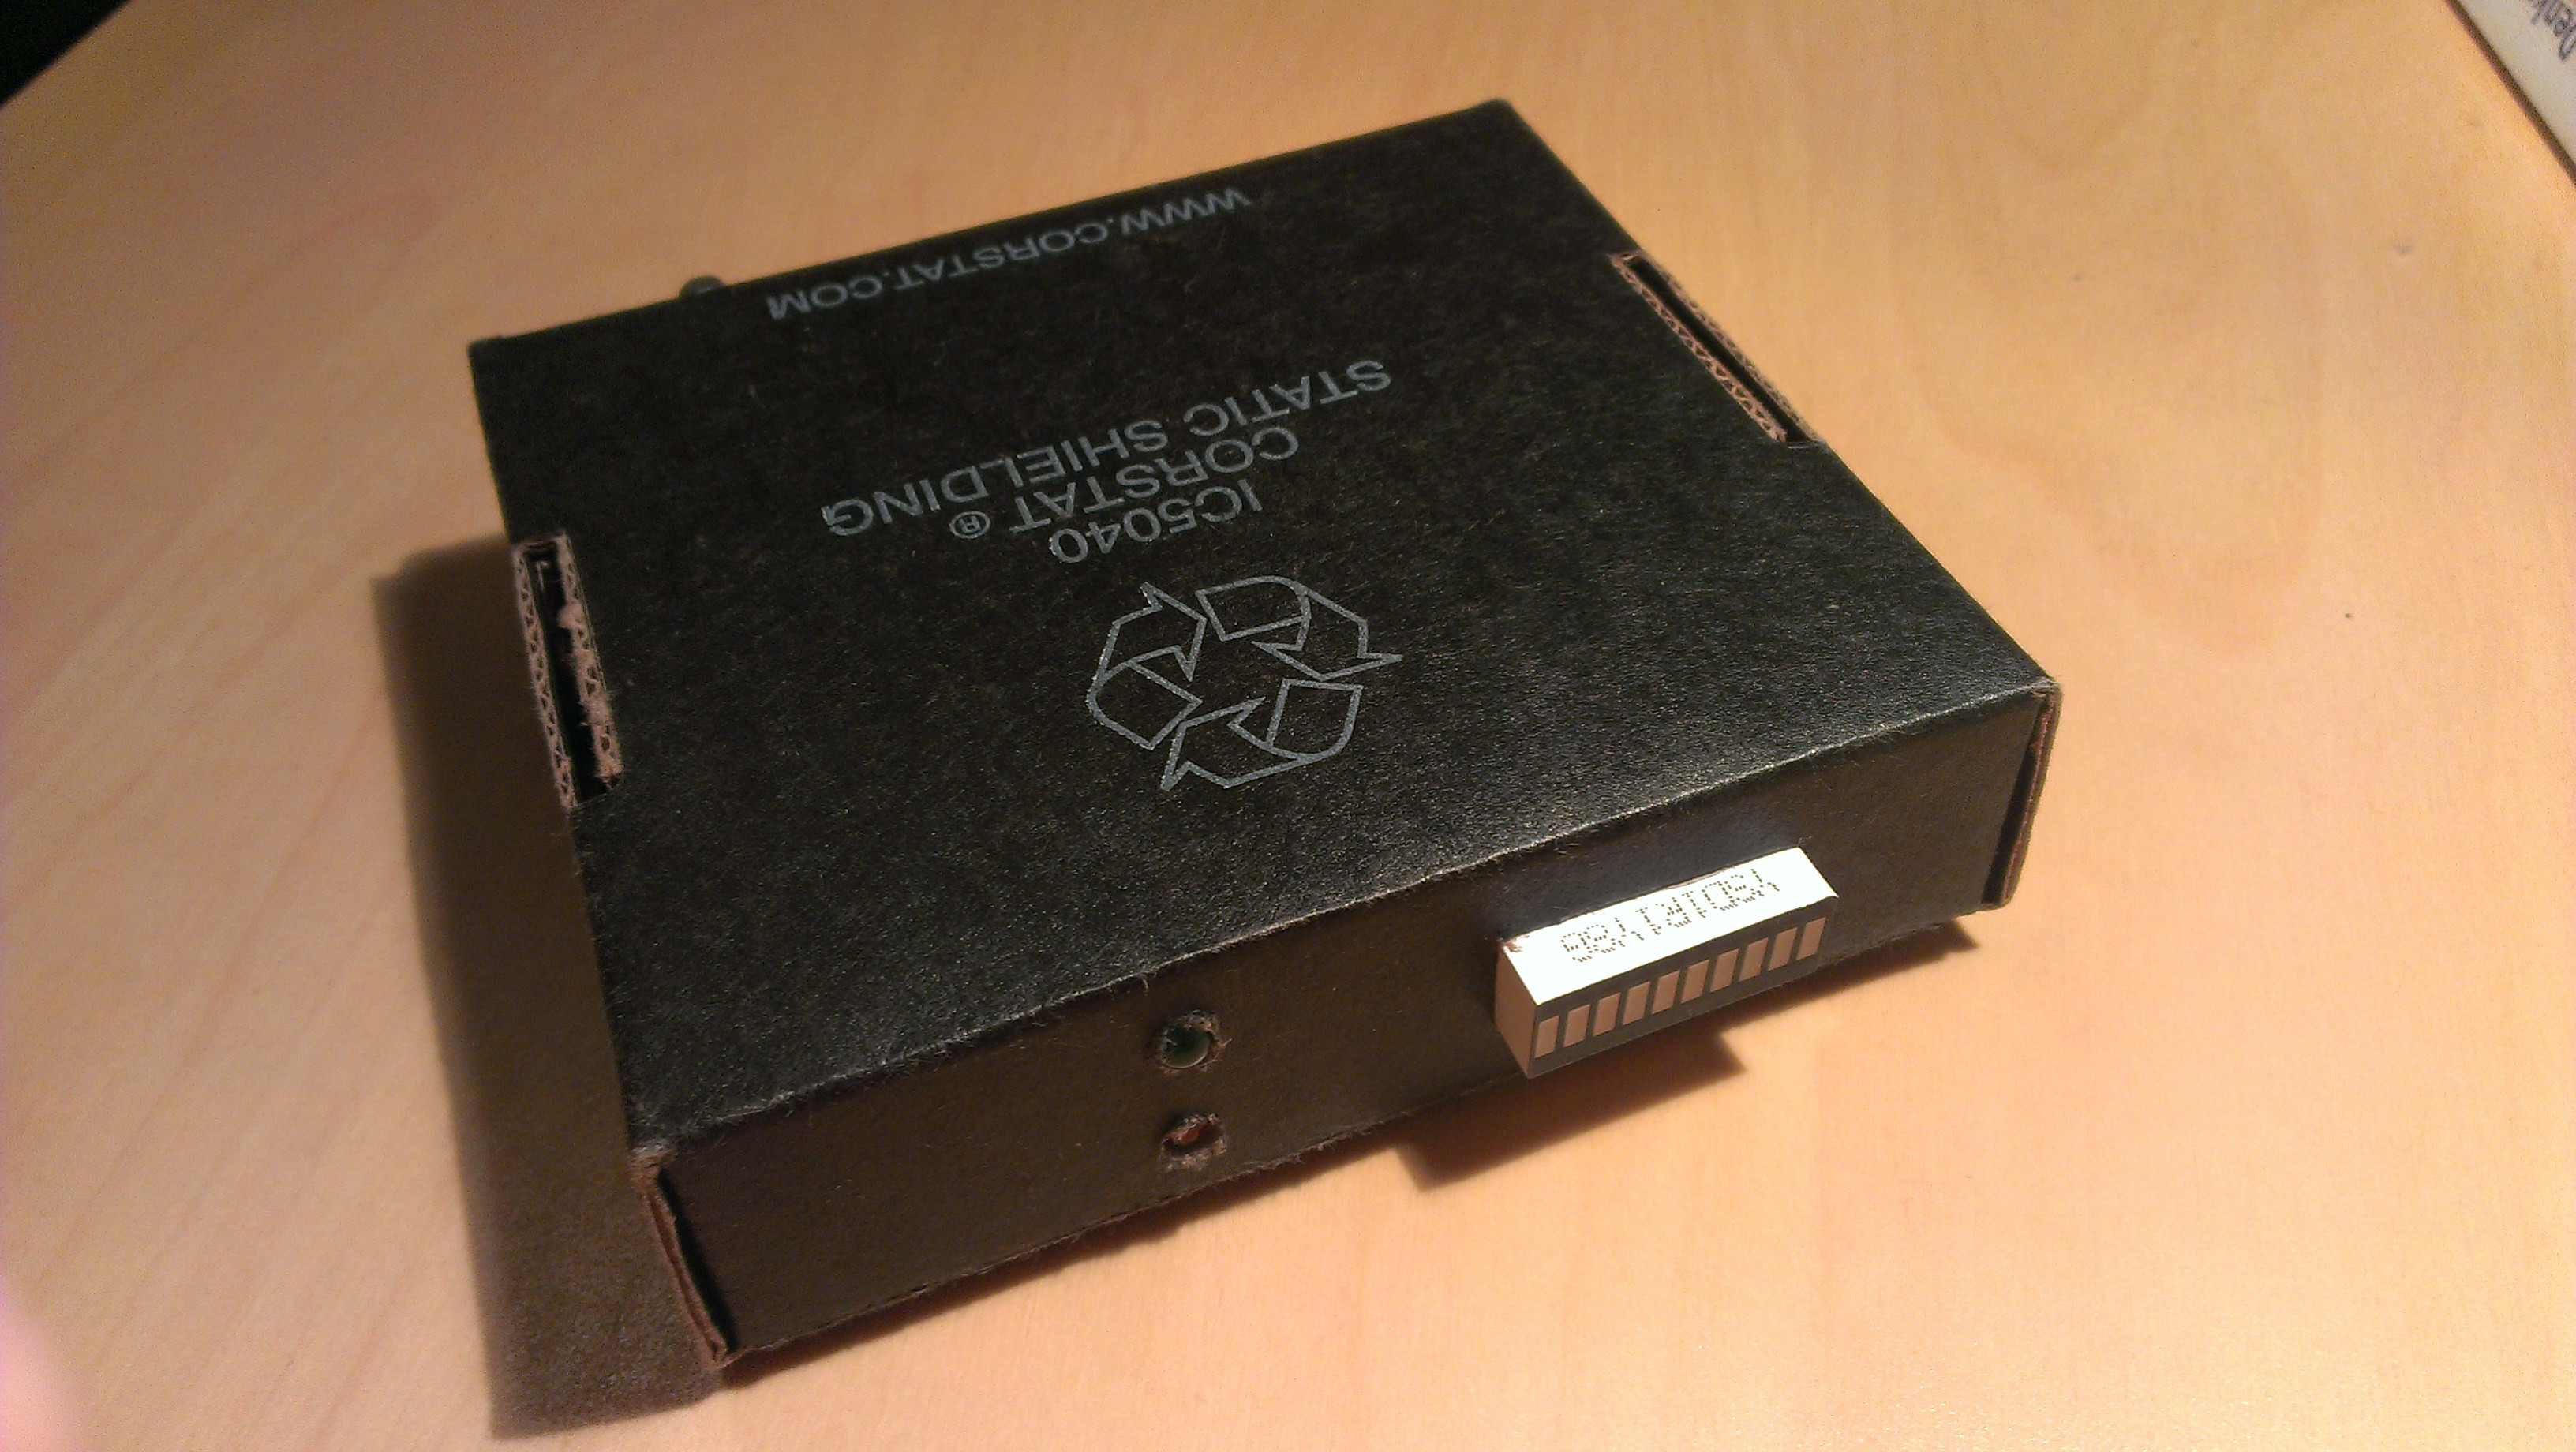
Second version:
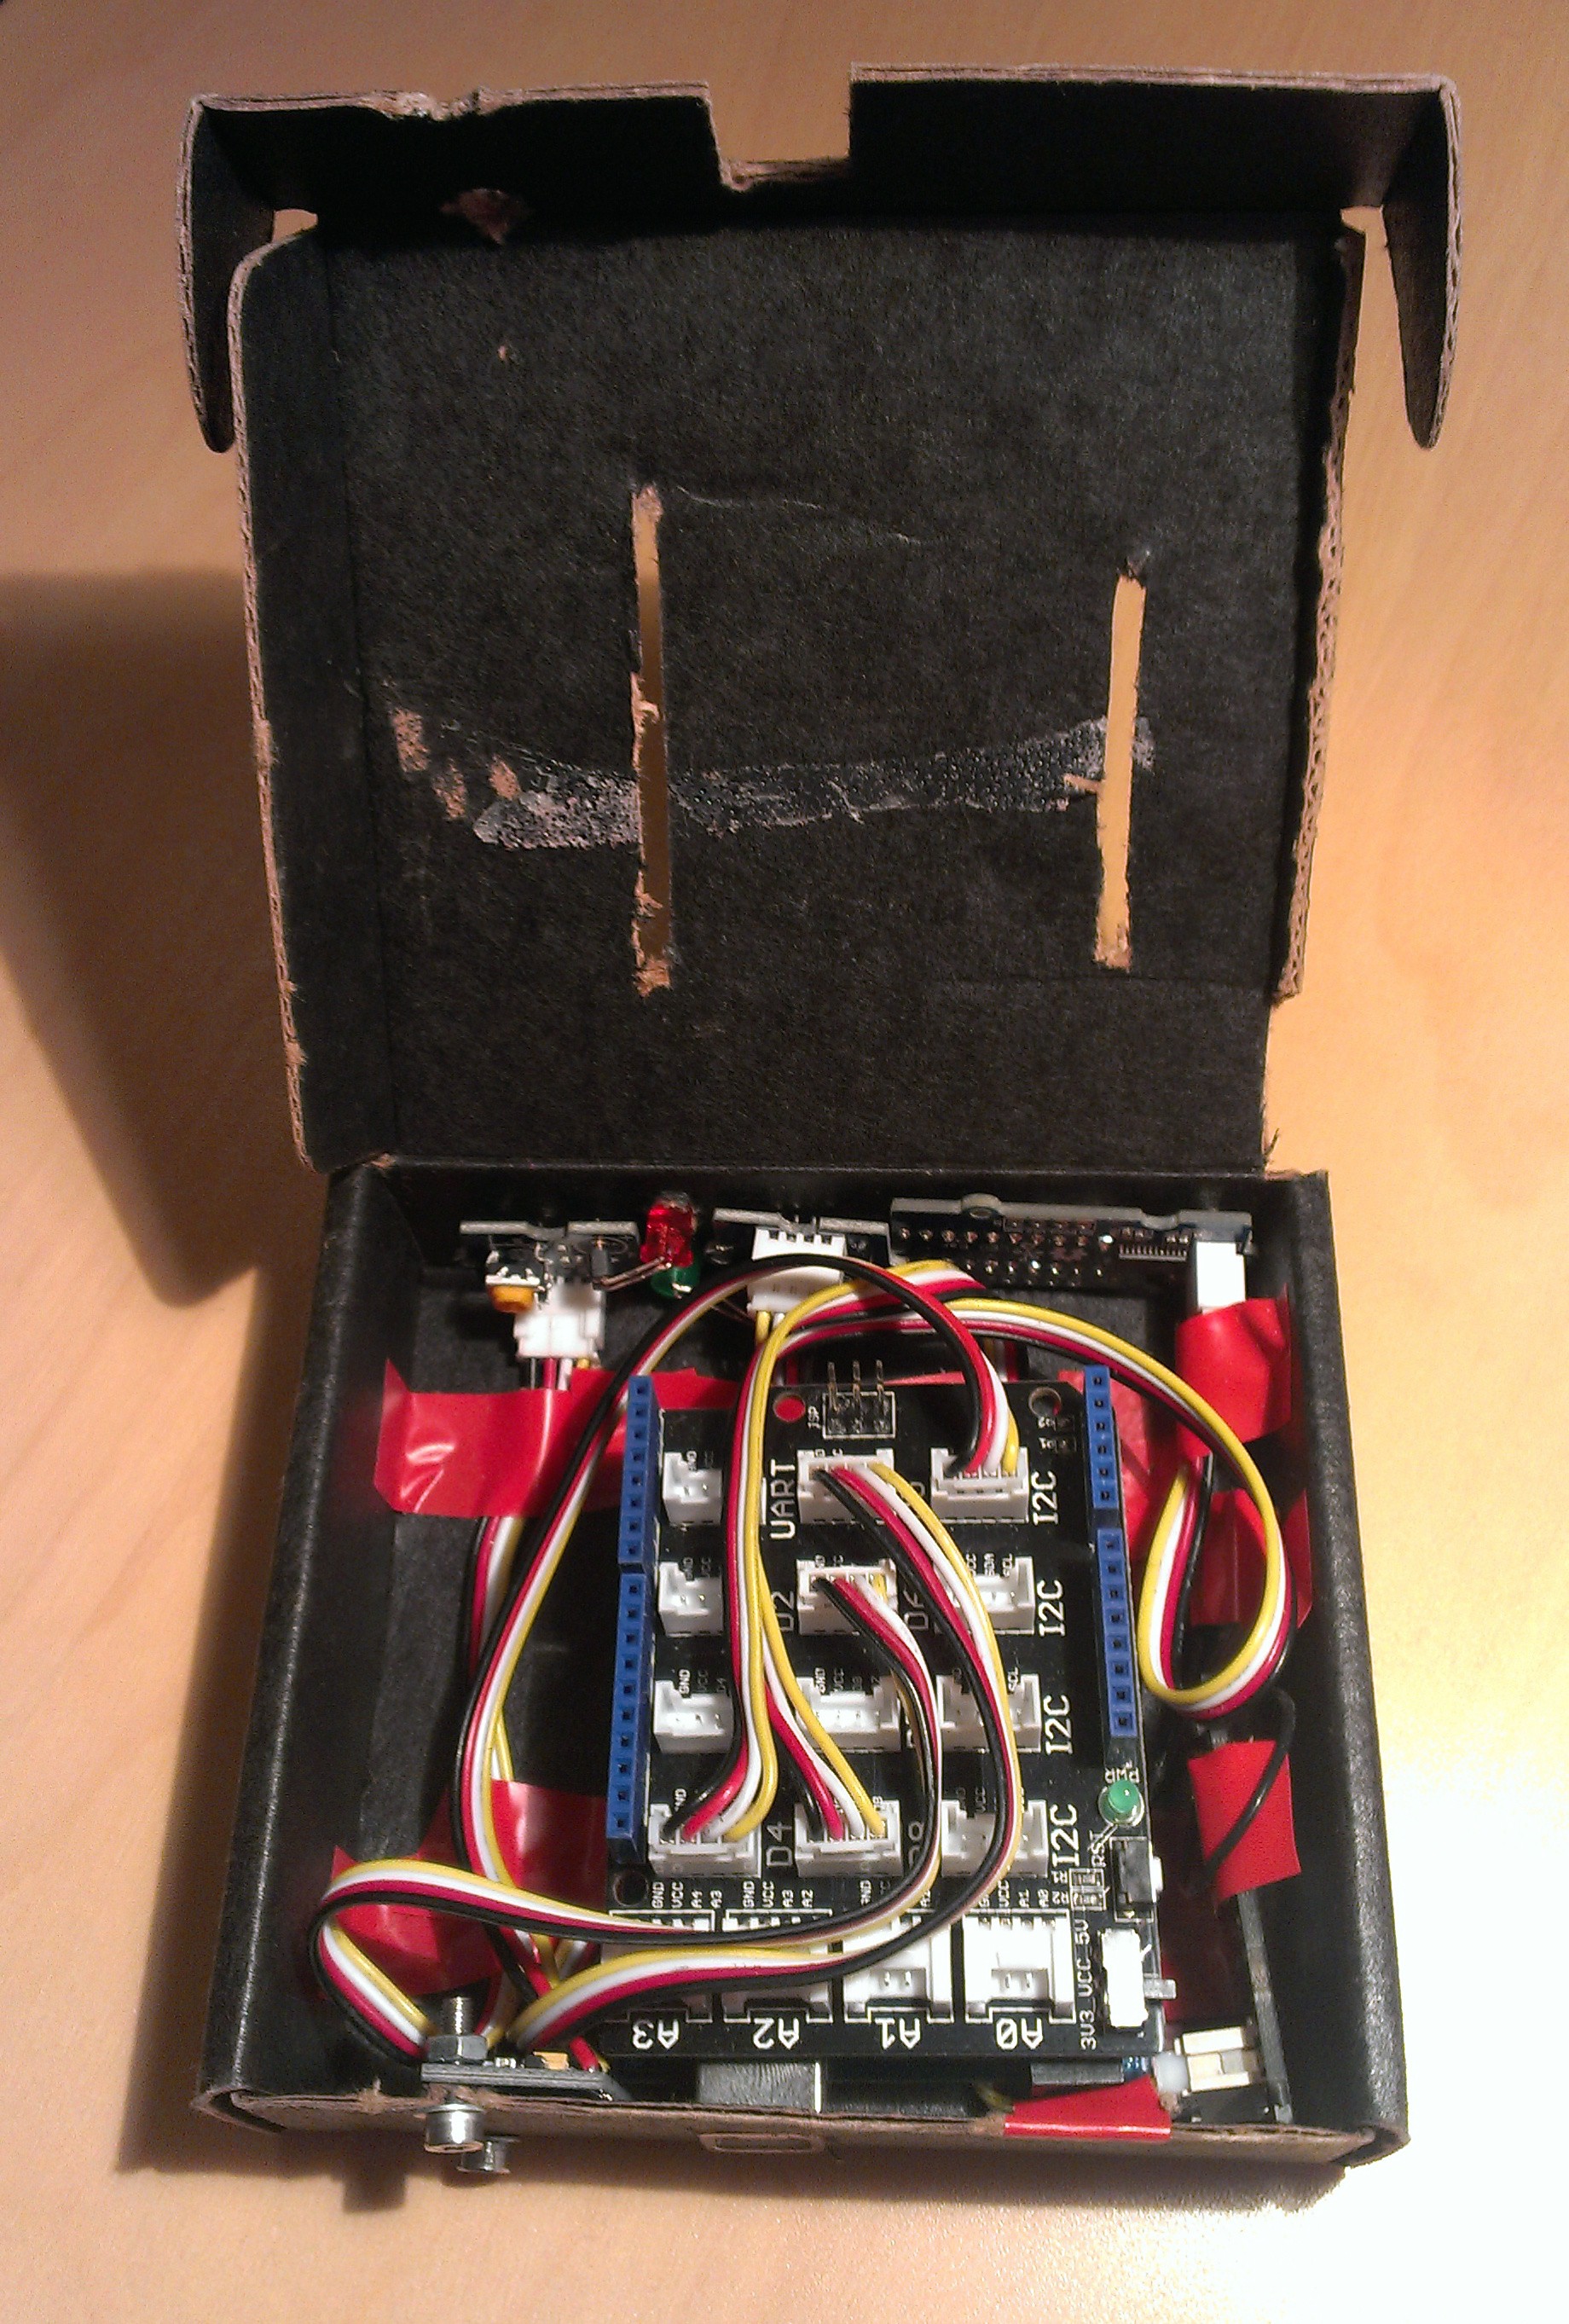
Switched to Arduino plaftform, still using the Grove modules. Rewrote firmware from scratch. New custom cardboard box to keep wiring under control. Data is output through the serial port, as no WiFi chip was available at the time.
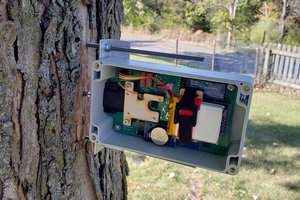
Third version:
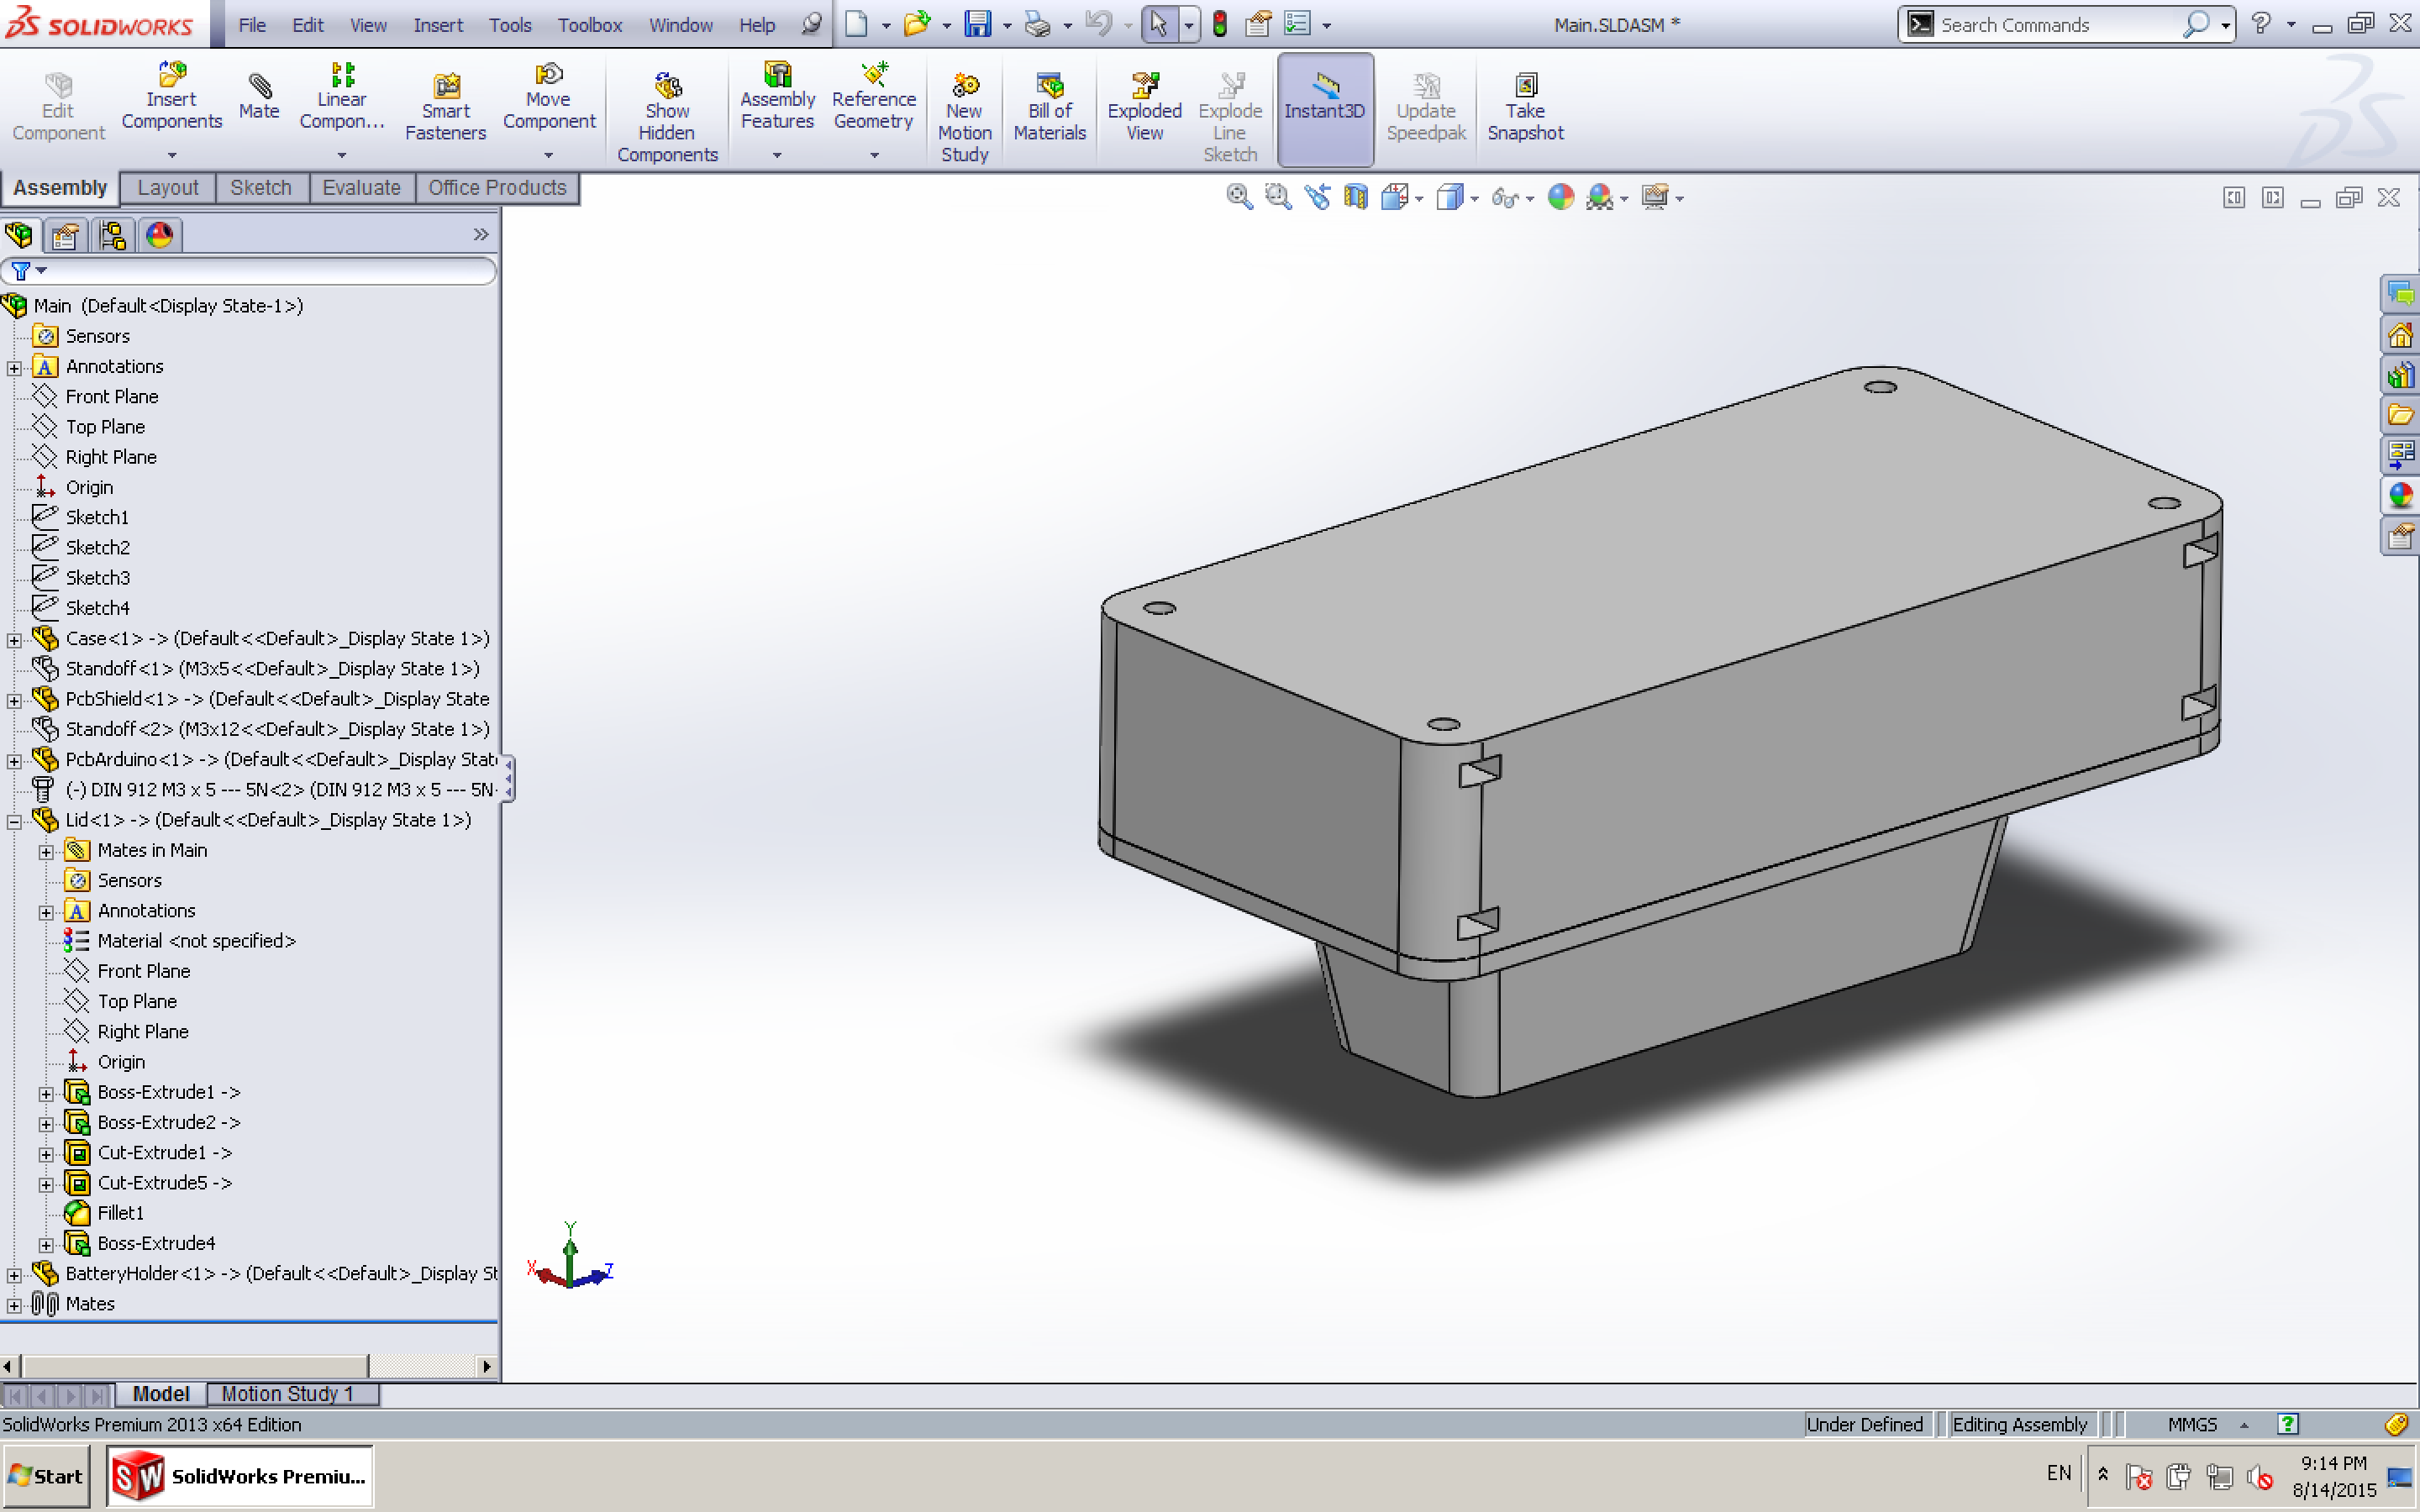
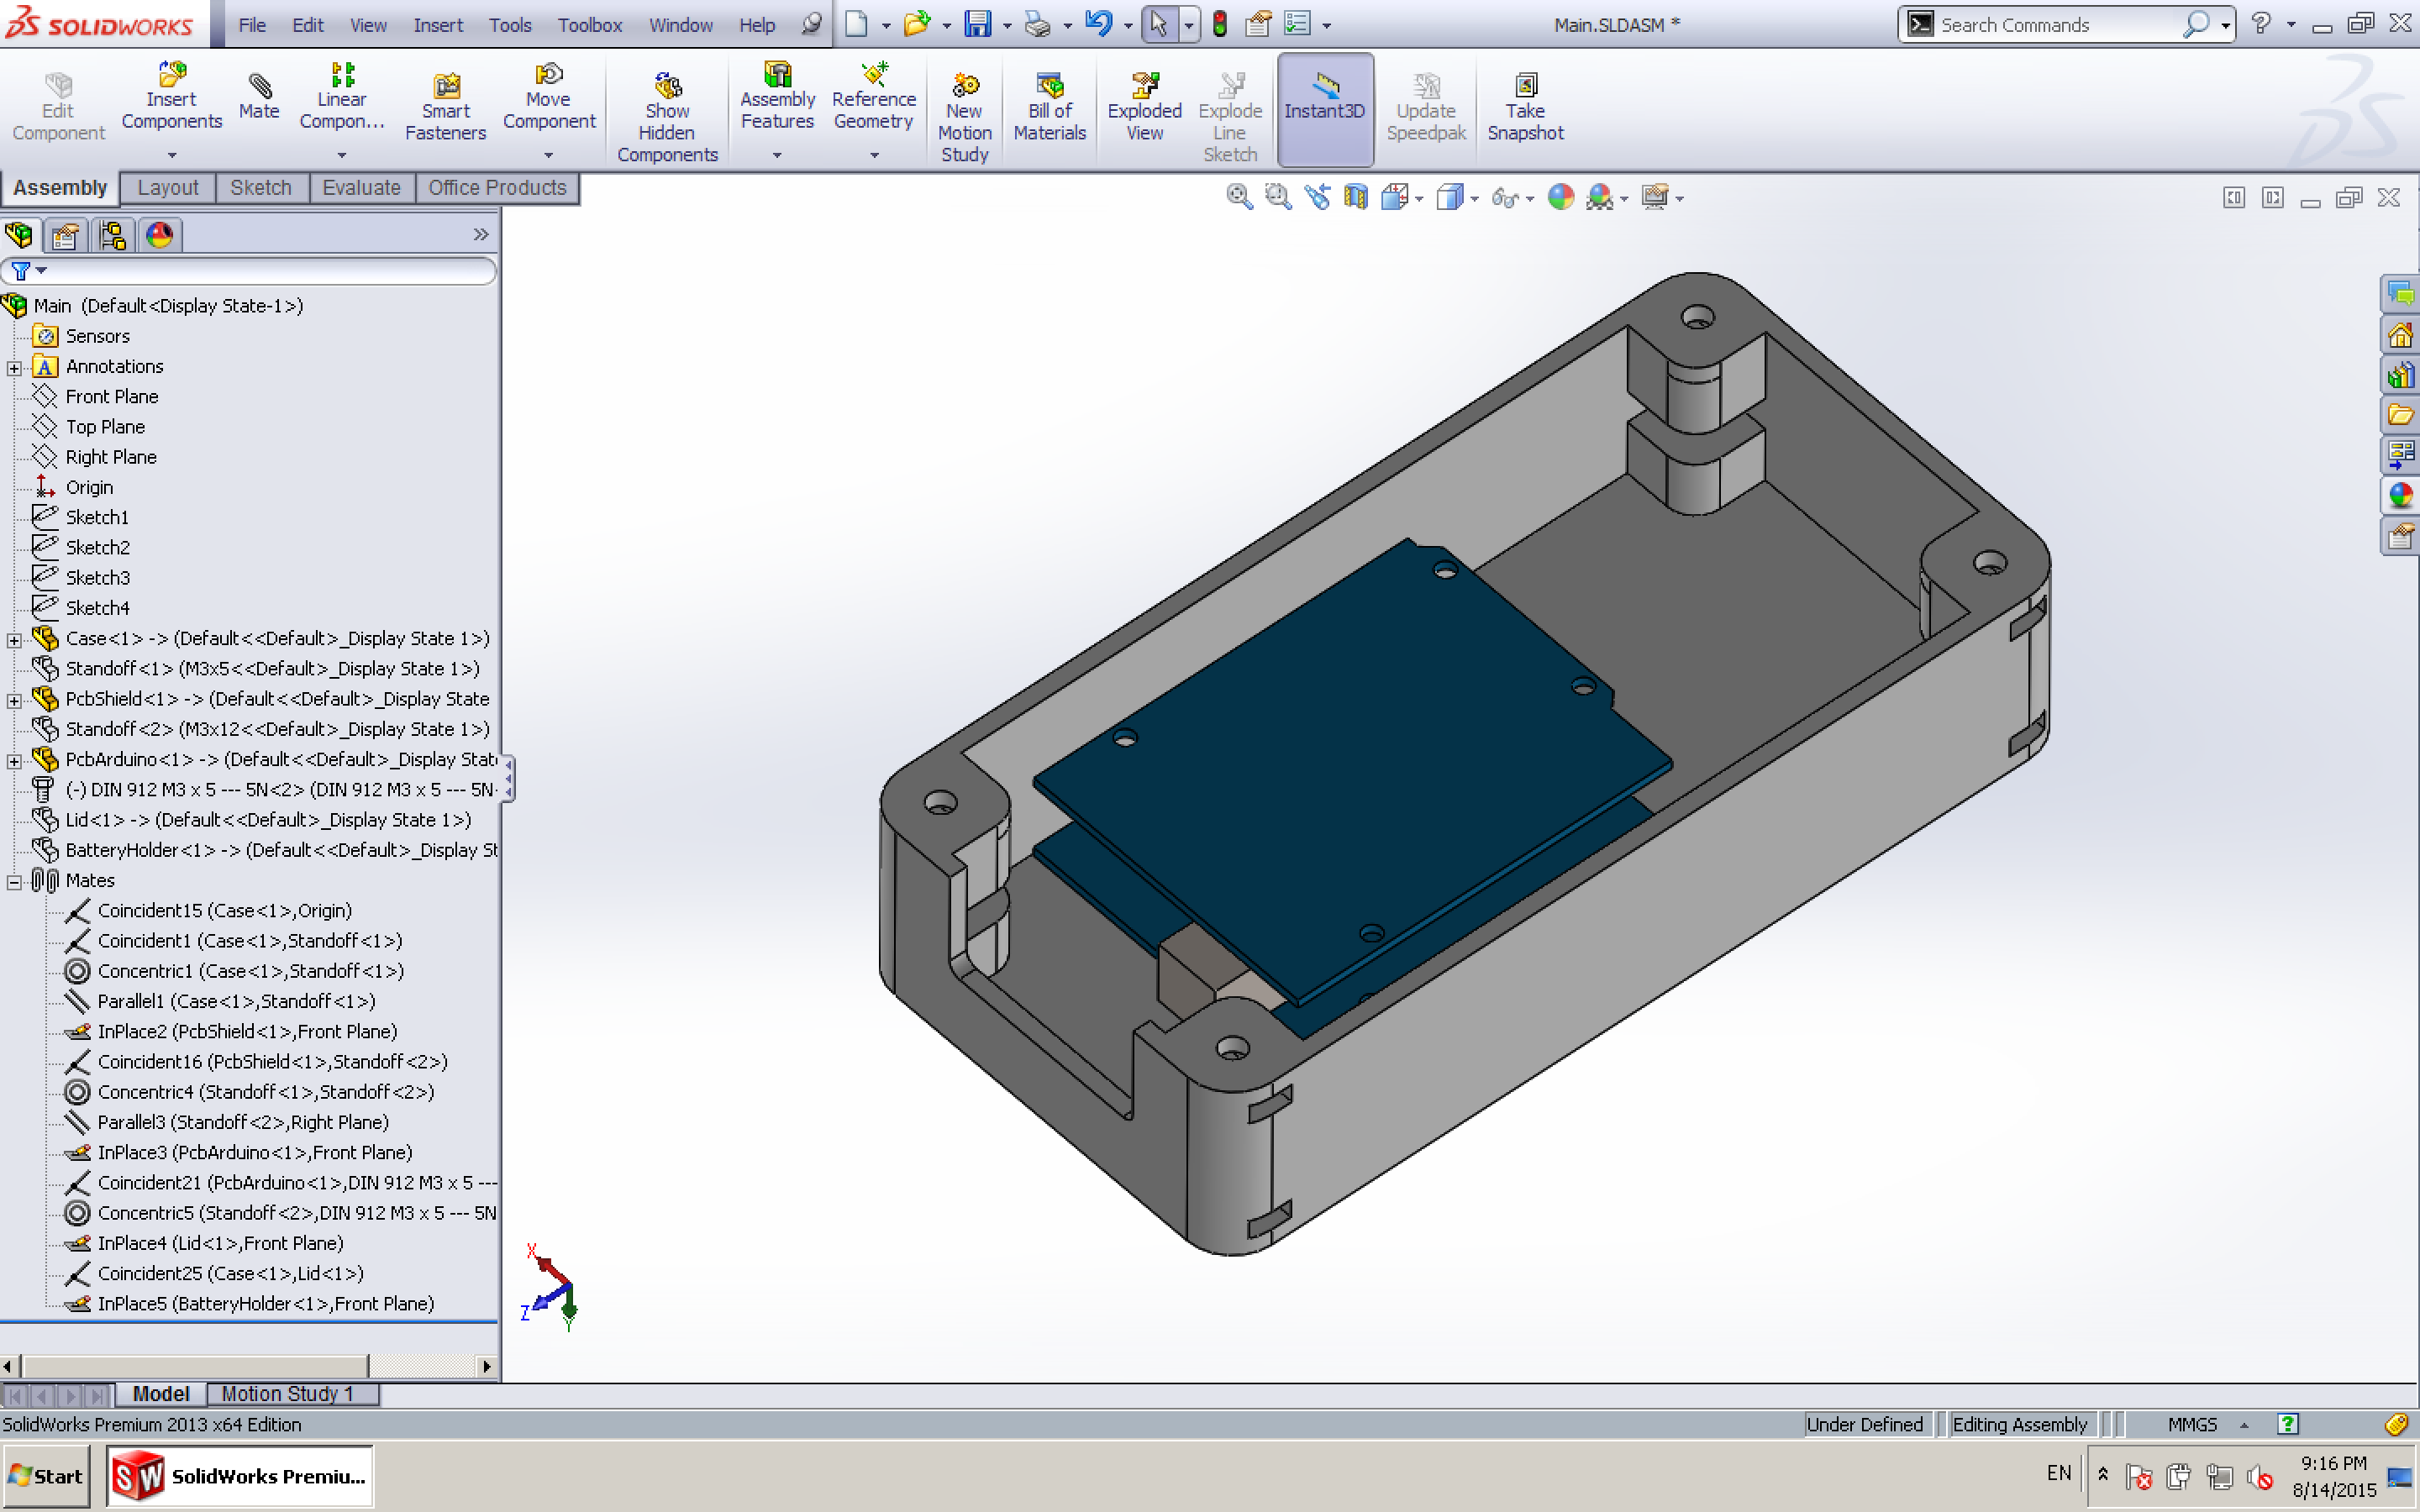
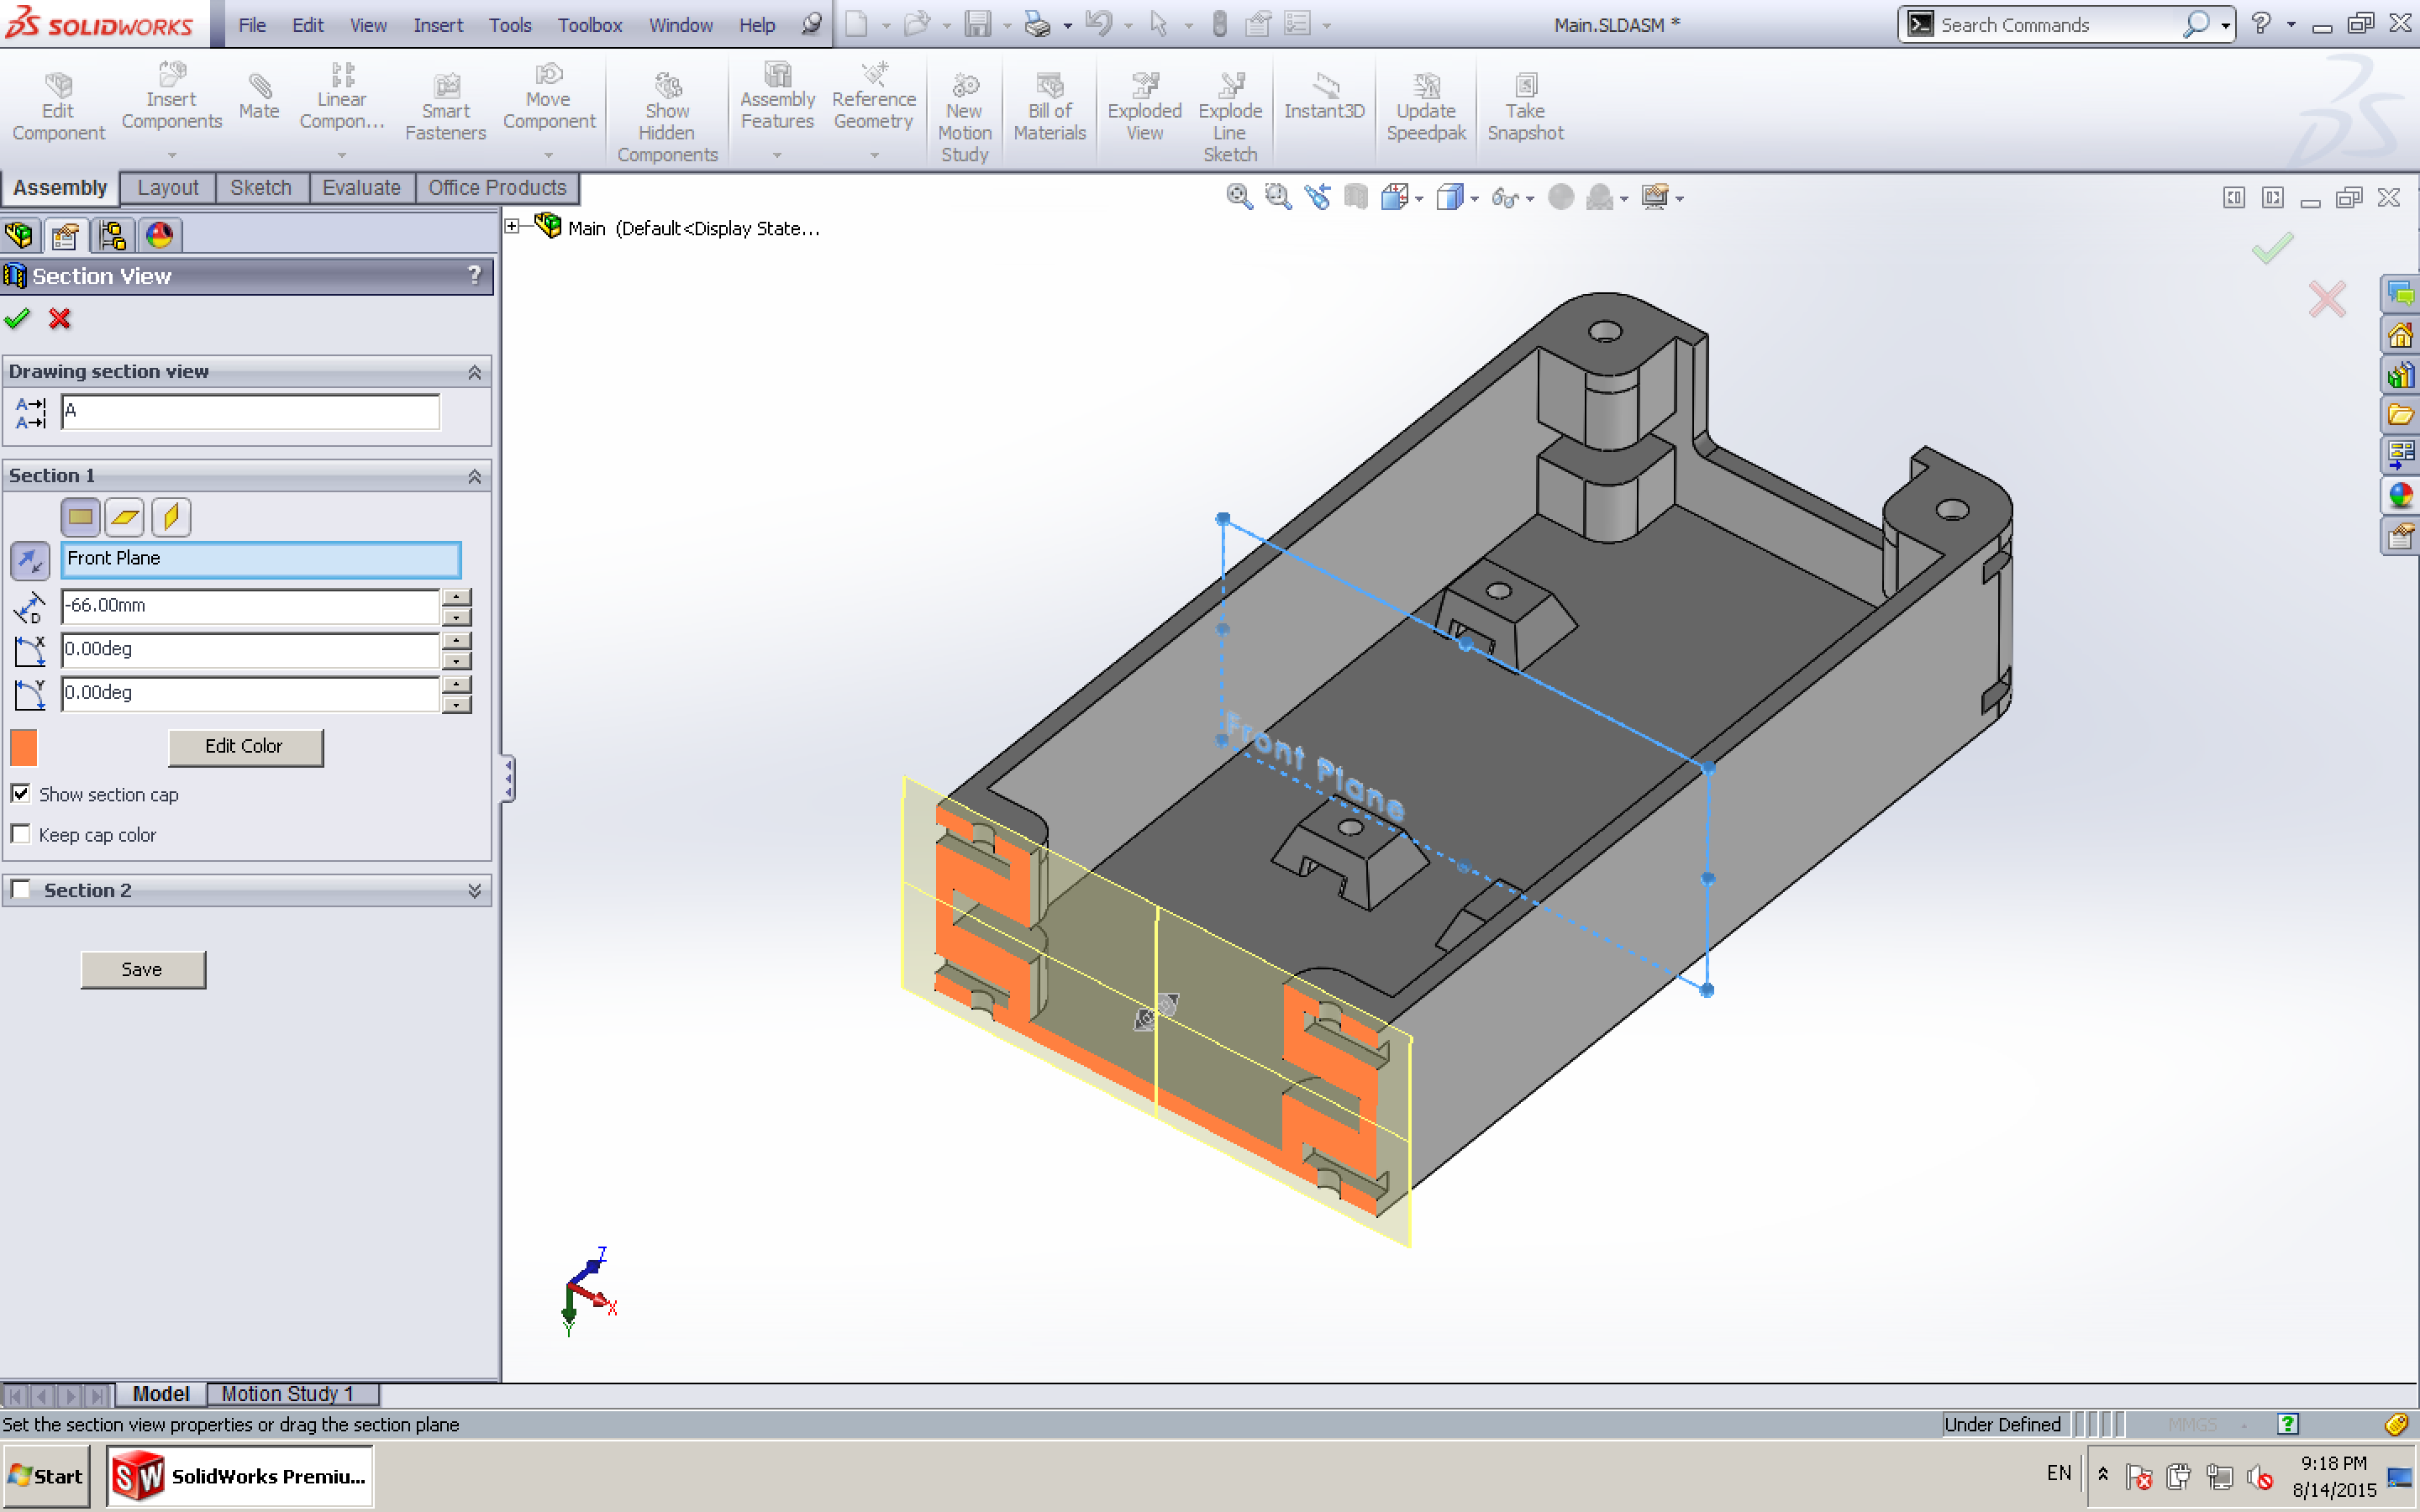
Currently under development. Arduino + Adafruit Ultimate GPS Logger shield (with built in RTC and SD card). The accelerometer, LEDs and WiFi modules will be attached to the protoboard section of the shield.

 Kevin Lhoste
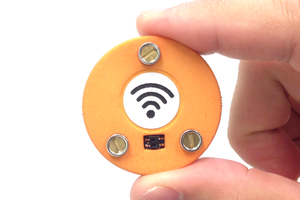
 Ekawahyu Susilo
 John Opsahl