Using the transformer of the previous log entry, I've taken an FFT using the Rigol DS1052E Scope, using a Blackman filter, and saved that as BMP to my disk. Here are the results:
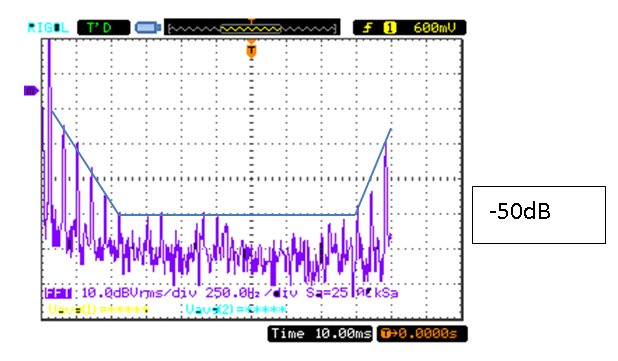
On this first measurement, the time div is 250 Hz/div, so the maximum frequency here is 2.5 KHz. At 50 Hz, obviously the voltage is highest, since that is the powerline frequency. Then up to 500Hz there are some harmonics: multiples of 50 Hz, at 150, 250, 350, 450, and 550 Hz. These harmonics have increasingly smaller amplitude: -25 dB, -32.5 dB, -35 dB, -45 dB. -45 dB.
Those pulses correspond to the 3rd, 5th, 7th, 9th, and 11th harmonic (integer multiple) of 50 Hz.
Frm approx 550 Hz to 2250 Hz the amplitude is below -50 dB, and then there are two increasing peaks: 2360 Hz and 2450 Hz, at -30 dB and -20 dB.
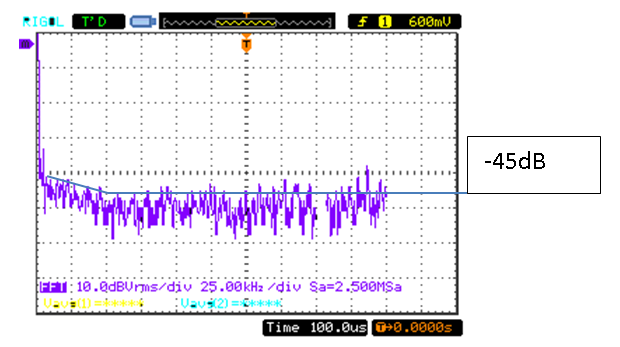
With a larger x division, the total spectrum has moved up a bit, by approx 5 dB. Generally speaking, up to 50 KHz, the spectrum drops from -40 to -45 dB, and up to 250 KHz, the spectrum is reasonably flat at approximately -45 dB.
We have to remember though that the transformer resonates at 200 KHz, so measurements above that frequency cannot really be trusted.
That was the baseline reading.
A bit of analysis:
Where do the harmonics come from? Well, these voltages are caused by switching behaviour. You can have a read here for theory about that.
In this case, because I'm measuring a single phase powerline, these harmonics fit a full bridge rectifier best, which has four diodes, and hence a pulse number of 4. In that case the following harmonics are generated [1]:
where:
- h = harmonic number (integer multiple of the fundamental)
- k = any positive integer
- q = pulse number of converter
So, for single phase, and a full bridge, the pulse number is 4, so we expect to see harmonics on:
1x4-1 = 3
1x4+1 = 5
2x4-1 = 7
2x4+1 = 9
etc.
And that is indeed what we saw.
The amplitudes are caused by currents, and the amplitude of each of these harmonics should be the fundamental voltage divided by the harmonic number.
So:
3: 1/3 = 1/3rd of the fundamental
5: 1/5 = 1/5th of the fundamental.
etc.
What we measured was:
-25 dB for the 3rd,
-32.5 dB for the 5th,
-35 dB for the 7th,
-45 dB for the 9th
but according to calculations these should be:
10*10log(1/3) = -4.77 dB
10*10log(1/5) = -6.99 dB
10*10log(1/7) = -8.45 dB
10*10log(1/9) = -9.54 dB
So what we see is that the theory doesn't line up with practice. Not only are all frequencies far more damped in reality than in theory, also, the increasing drop off is less. However, we do have to remember that the theory applies to unfiltered bridges, and the function of filtering is exactly to prevent unwanted harmonics.
In fact, there are rules and regulations about how strong the harmonics may be on the powerline, which I won't go into, but you can read about in [1].
[1]: http://literature.rockwellautomation.com/idc/groups/literature/documents/wp/mvb-wp011_-en-p.pdf
Next step: calculating what the amplitude in volts would be for these measurements.
Discussions
Become a Hackaday.io Member
Create an account to leave a comment. Already have an account? Log In.