Reinier van der Lee
-
Silicone Rubber Casting
01/01/2016 at 23:33 • 0 commentsMaking a small quantity of gypsum sensors using 3/4" PVC pipe couplers works pretty well. Due to planned field trials, I was looking for an easy way to produce more sensors while maintaining consistency.
I decided to do an experiment with 2-component silicone rubber, and ended up buying the OOMOO-30 trail kit. This kit produces just under one liter of rubber. With that quantity a mold for 9 sensors is possible. The material is easy to work with, and vacuum degassing is not necessary. Curing takes about 6 hours.
First step is to make the sensor casting shapes, using 3/4 PVC pipe cut to 5 cm length, glue a cap on, and insert the machine screws. The machine screws will provide guide holes in the rubber cast that will precisely align the electrodes 12.5 mm apart in the gypsum cast.
Next I made a plastic container, and fixed the sensor casts in place. A wooden frame ensures that the container keeps its shape when the rubber compound is poured in.
It is important to use a mold release agent avoiding rubber sticking to the cast parts. Even after using a release agent spray, I still had some sticky spots on the 3 rubber casting molds I made so far.
Here is the cast ready to receive the silicone rubber:
![]()
Below picture shows the rubber mold with electrodes and fiberglass mesh inserted. Ready for casting the Plaster of Paris .
Tap the mold repeatedly -or use a vibrating table- to remove air bubbles.After 30 minutes, the gypsum sensors can be removed.
![]()
-
Vinduino Project Savings
10/24/2015 at 23:12 • 0 commentsSummary
The Vinduino project saved 25% , or 430,000 gallons, irrigation water.
Cost saving on water and labor was $1,925.
Project component cost was $635.Irrigation Cost Before Vinduino
In 2014, and the years before that, we had irrigation managed by our vineyard management company. They decided when and how long to irrigate. This was done manually. Someone drove up to the vineyard, opened the valves, and returned later that day to close them again. Apart from the labor cost, my concern was that I had no control, and no way to tightly manage water in another year of severe drought.
Cost Irrigation QTY Irrigation water (2014) $ 3,200 2,325 HCF Irrigation management (2014) $ 1,125 Total cost for irrigation $ 4,325 Savings
Cost Irrigation QTY Irrigation water (potential) $ 2,400 1,750 HCF** Irrigation management (2015) $ 0 Total estimated annual savings
for irrigation$ 1,925 575 HCF (25%)
(430,000 gallons)** this is the goal for 2015, actual is a bit higher due to equipment failure and overestimated water requirement directly after installation. Subtracting these, we would have met the target saving of 25%, and have repeatable results next seasons.
Cost summaryInstalled sensors cost (1 x Watermark, 10 x gypsum) $50 2 x DC latching valves + timers $450 Vinduino handheld reader + Vinduino remote node $135 Total project components cost $635 Including one time cost for new irrigation valves and irrigation timers, the payback period for this project is less than one year.
The financial savings are an additional bonus for saving water!
Developing Countries Configuration
A minimum cost Vinduino setup for developing includes: a handheld reader, multiple gypsum sensors, and a salinity probe.
The total estimated component cost for this is $60. High volume purchasing can bring cost down significantly.
While not as convenient as a remote reading station, taking daily measurements in the field is considered sufficient for keeping track of soil moisture and estimating irrigation time.
The salinity probe allows salinity measurement of soil, and checking of irrigation- and drinking water quality.
Soil sample measurements should be taken a few times per year, avoiding crop loss due to soil salinity.Vinduino Component Cost
The handheld reader has evolved into a multi-purpose agricultural meter. It can be used to measure :
- soil moisture (using DIY gypsum sensors, or commercial Watermark sensors)
- Soil and water salinity
- Water pressure
Low volume component cost estimate is $51.50
(excl. VAT and component shipping cost)![]()
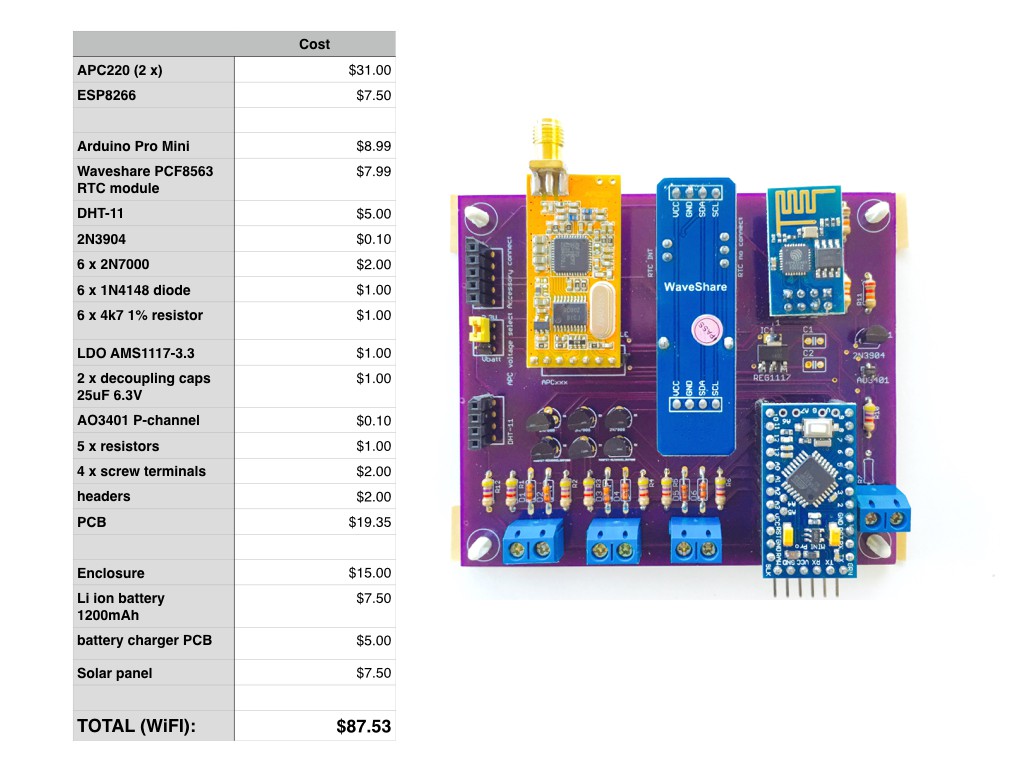
The remote reader station (picture below) can measure :
- 3 x soil moisture sensors
- Inside enclosure temperature and relative humidity
- Battery voltage
Connectivity options include log range RF modules or WiFi (ESP8266)
The board can be configured to control DC latching irrigation valves and measure water pressure (as feedback that valves work properly). This will require an additional motor driver board and DC/DC boost converters.
Low volume component cost estimate is $87.50
(excl. VAT and component shipping cost)![]()
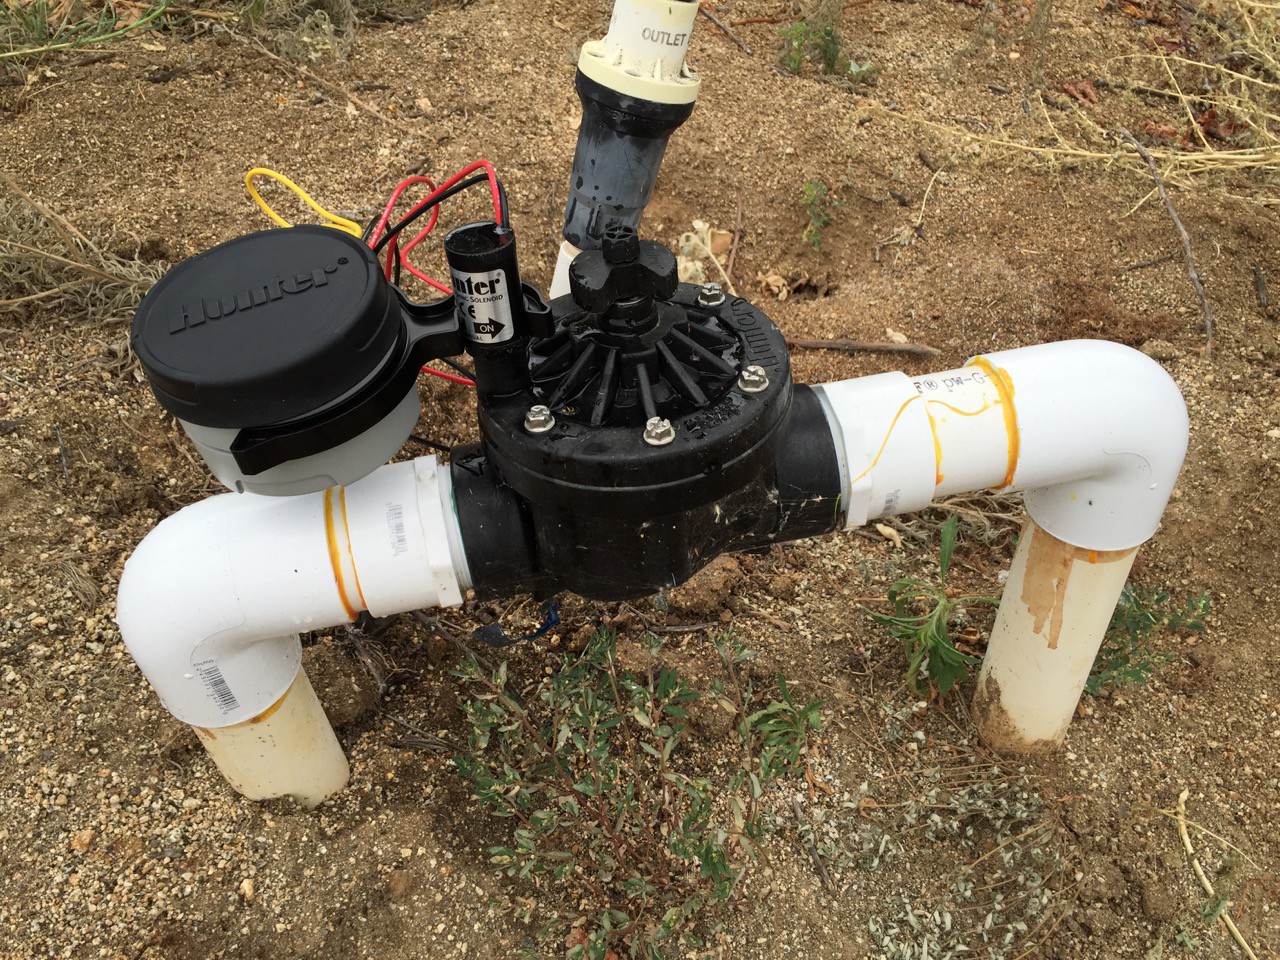
Plumbing Cost
I installed 2 x DC latching 2" irrigation valves ($125 each) and control them with battery operated timers ($100 each). The timers are set for daily irrigation, and the irrigation time is adjusted weekly. For next season, the goal is to replace the timers with Arduino-based irrigation control.
![]()
-
Automated Irrigation Considerations
10/24/2015 at 17:53 • 0 commentsSummary
This log covers lessons learned from measuring soil moisture in the vineyard, how to estimate daily water need of plants, calculate irrigation time, and how to apply that to an accurate automated irrigation system.
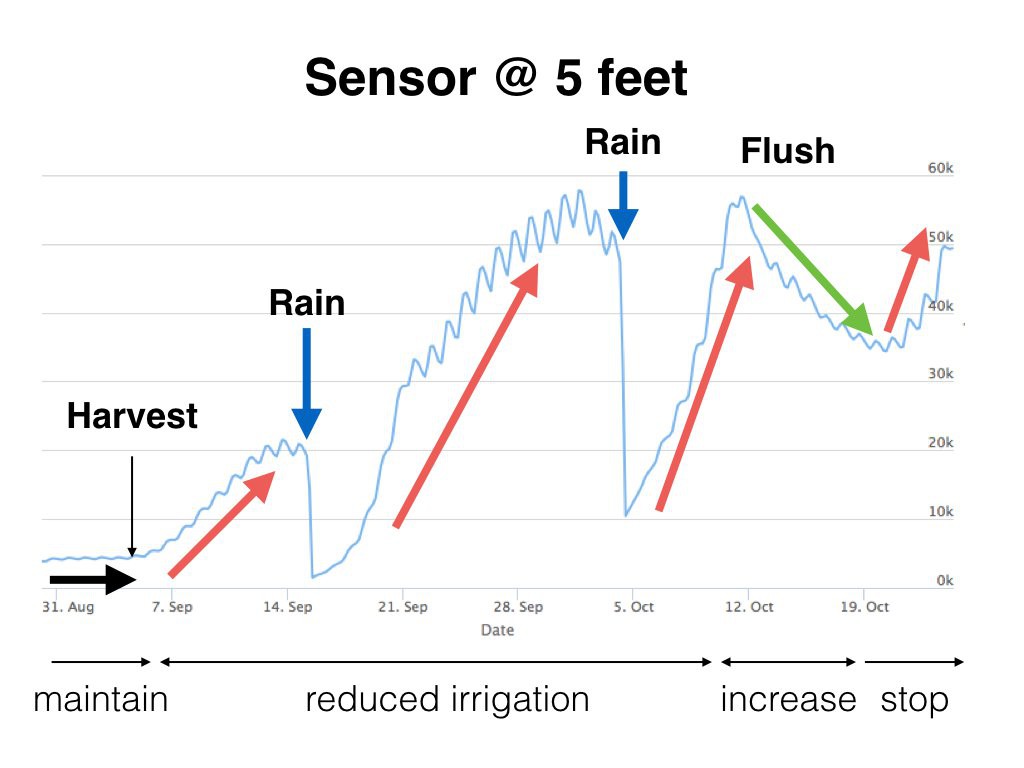
Lessons from soil moisture
Until harvest, I maintained the soil moisture at a level to keep my vineyard happy. Immediately after harvest I reduced the daily irrigation amount, and as a result moisture levels drop/sensor resistance increases.
The rain event in September only interrupted the drying trend for a week. The sensor at 5 feet (below active root zone) triggered to the rain water almost immediately, showing that it drains through the soil to levels beyond reach of the vines.
In contrast, increasing the daily irrigation quantity (starting Oct 10) causes the soil moisture to slowly increase. After stopping irrigation, the soil slowly dries.
Key take-aways:
1. While under irrigation, soil moisture changes slowly (week-by-week, rather than day-by-day). If you replace the daily amount of water used by the vines, the moisture will remain constant.
2. Soil penetration depth of irrigation can be managed by water quantity /irrigation event
3. Rain drains deep fast, not all rainwater will benefit the vines as it will quickly reach levels below the root zone.
4. It's better to wait for rain to flush out soil salinity than using irrigation water. It will take A LOT of irrigation water to flush out salts from the soil.
![]()
Determine daily water use and irrigation time
We need to estimate the day water consumption use of a plant in order to irrigate the right amount to replenish that. In agriculture, ETo (evapotranspiration) data is widely used for that purpose.
The following equation can be used to calculate vine water requirements:
ETc =ETo x Kc
where ETc = vineyard evapotranspiration, ETo = reference evapotranspiration and Kc = crop coefficient. The above equation will give water requirements in inches or mm (one acre inch = ~ 27,500 gallons per acre) (one mm covering one hectare = 10,000 L)
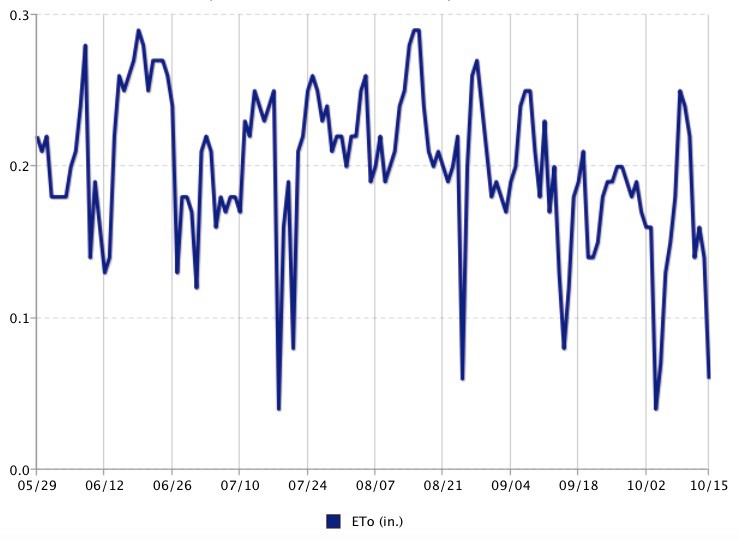
Below is an example of ET0 values this year in Temecula California.
![]()
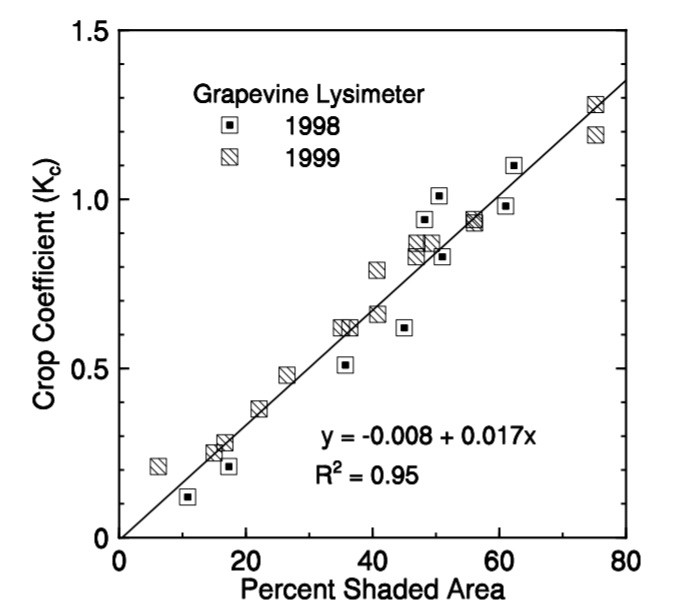
The crop coefficient (Kc) is an indication of how much light is intercepted by the plant canopy, it is dependent on the seasonal growth stage and the trellis design. I determined the Kc by measuring the canopy state at noon.
The spacing for each vine in my vineyard is 6' x 9', or 54 square feet for each vine. The measured canopy shade was 2 feet =22%.Kc = 0.0017 x 22%= 0.375, where 0.0017 is the slope factor found for grape vines (source: Williams and Ayars, 2005).
![]()
Irrigation Calculation Example:
For an ETo of 0.25 inch, water consumption of a grape vine in my vineyard was:
ETc =0.25 x 0.375 = 0.0938
Daily use per acre = 0.0938 x 27,500 gallons per acre = 2,578 gallons
At 9 x 6 feet spacing: 806 vines/acre = 3.2 gallons/vine/dayIrrigation time:
I use 2 drippers of 1 gallon/hr per vine.
Required irrigation time for 3.2 gallon: 3.2 / 2 x 60 = 96 minutesHow to get your ETo data
The best way to get ET data is using a Lysimeter. This is not for everyone though, it is basically a small vineyard on a big scale. Or you can use a pan filled with water and measure how much evaporates every 24 hours.
As an alternative, ET0 can be calculated using multiple valuables obtained from a weather station that is placed in the reference crop (grass): solar intensity, temperature, wind speed, air pressure, and air humidity.
For very rough ET estimates, you can use temperature with the Blaney-Criddle formula: ETo = p (0.46 T mean +8)
ETo = Reference crop evapotranspiration (mm/day) as an average for a period of 1 month
T mean = mean daily temperature (°C)
p = mean daily percentage of annual daytime hours
There are many on-line weather stations that provide localized ET0 data. One source for wine areas is www.winebusiness.com
In California, ET0 data can be obtained on-line, localized by ZIP-code: www.bewaterwise.com/icp/IRWD.pdf
Luke Beno wrote code for the Electric Imp to get the California data, and published step-by-step instructions: https://hackaday.io/page/1281-how-to-get-ca-eto-data-with-electric-impAccurate Automated Irrigation
Irrigation based on ETc estimates is not accurate as it assumes ETo is the same for the whole ZIP code area, and crop coefficient varies over the season with canopy development and management (like removing suckers and hedging).
Based on ETc, you can have a reasonable estimate of the day-to-day water need of your plants.
ET can show considerable variation, this season I noted values between 0.04 and .29.
Daily ETo updates will provide good granularity for determining daily irrigation quantities.Adding (slow changing) soil moisture in the irrigation decisions, helps adjust irrigation to proper values. If you under-estimate the irrigation time, average soil moisture will slowly decrease, and vice versa.
Rain has shown in my vineyard as event where soil moisture changes relatively fast.
Based on on a combined ETc / soil moisture system for irrigation decisions, rain can be handled in two ways:1. Stop irrigation until soil moisture has returned to value before rain
2. Subtract rain from ETo (example: ETo of 0.25 inch, 0.1 inch rain > new ETo = 0.15)
As with all projects, you can never have enough data. Irrigation takes time to figure out, in my case a full growing season is probably not enough. My observations are specific for the soil (decomposed granite) and climate of my vineyard in Southern California. Results may vary, but my hope is that this information will inspire to do smart things with (agricultural) irrigation.
-
Salinity Measurement
10/17/2015 at 19:47 • 0 commentsSummary
Salinity, or excess salt in the soil profile, is often called the "silent killer", because of the devastating effect salinity can have on irrigated agriculture. With increasing agricultural irrigation efficiency, there is a risk of salt build-up in the soil that can significantly reduce crop production. Using a very easy-to-make probe, the Vinduino handheld -designed for soil moisture measurement- can be used to measure and manage soil salinity, as well as monitor irrigation/drinking water quality.
![]()
What level of soil salinity is critical?
Salinity is the concentration of salts in soil or water; when it exceeds a certain level it affects plant growth.
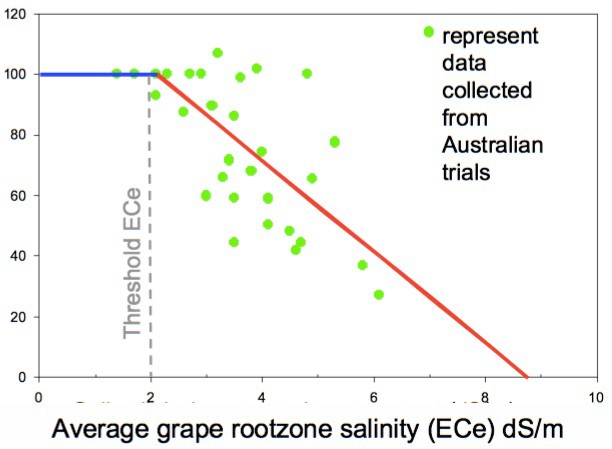
Highly efficient irrigation methods, like the Vinduino project, mean less deep drainage. Reduced drainage is associated with salt build up in the root zone.![]()
A salinity level of >2 dS/m affects the growth and productivity of wine grapes. Above graph from Australian trials found grape grape production reduces at salinity levels of 2 dS/m and up. At 6 dS/m, production is reduced by 50%.
If the salinity is too high, the only way to remove the salts is to flush out by rain or deep draining irrigation.
Nitrogen fertilizer application can increase salinity and should be monitored closely, especially on sites with potential salinity concerns.
Some crops have a higher tolerance for soil salinity. For example the ECe threshold for wheat is 6.0, for cotton 7.7, and for barley 8.0 dS/m.
Source: "Sustainable Salinity Management on your Vineyard"
http://research.wineaustralia.com/wp-content/uploads/2012/08/Mod3-SalinityMangmtPPT.pdf
http://research.wineaustralia.com/wp-content/uploads/2014/05/Sustainable-Salinity-Management-in-Australian-Vineyards.pdf
Unit for Salinity Measurement
The Standard unit for electrical conductivity (EC) is deci-Siemens/meter (dS/m)
1 dS/m = 100 milliSiemens/meter = 1000 microSiemens/centimeter = 1000 micromhos/centimeter = 1000 EC units = approx 640 milligrams/liter, or ppm total dissolved salts To make a calibration solution of 1 dS/m, you can simply dissolve 0.64 grams of table salt (NaCl/ sodium chloride) in one liter of distilled water.
Making and calibrating a Vinduino salinity probe
The Vinduino project already solves the challenges of using electrodes in a conducting medium (water). Electrolysis effects are avoided by alternating the measurement current through the sensor/probe, and keeping the measurement pulses short (25 microseconds). Polarity, or concentration cell, voltage issues are solved in the Vinduino by changing the measurement polarity and averaging out the DC offset. Professional >>$400-class EC meters need much more complex 3- or 4-electrode probes to deal with the polarity issue.
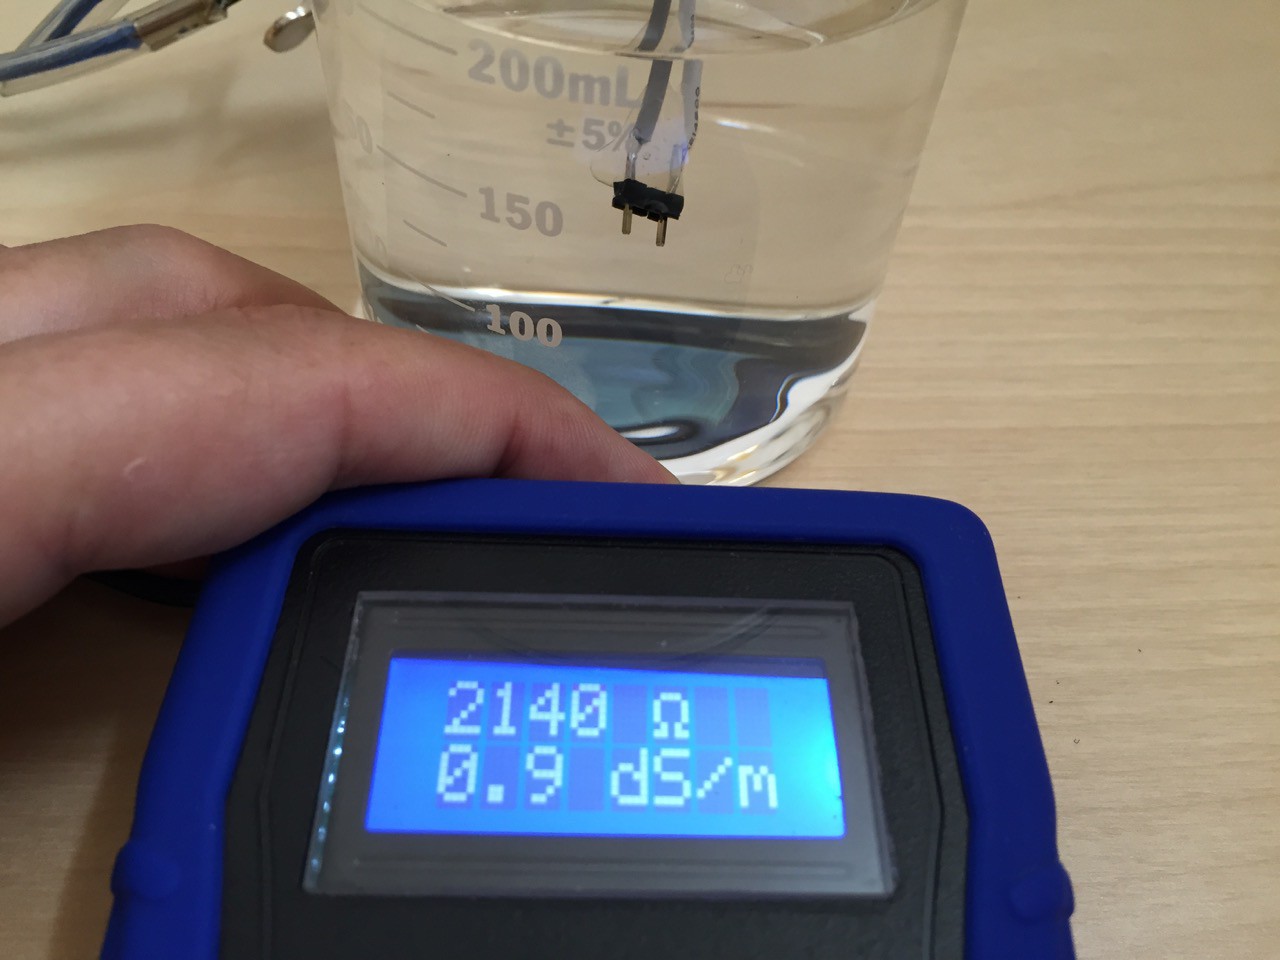
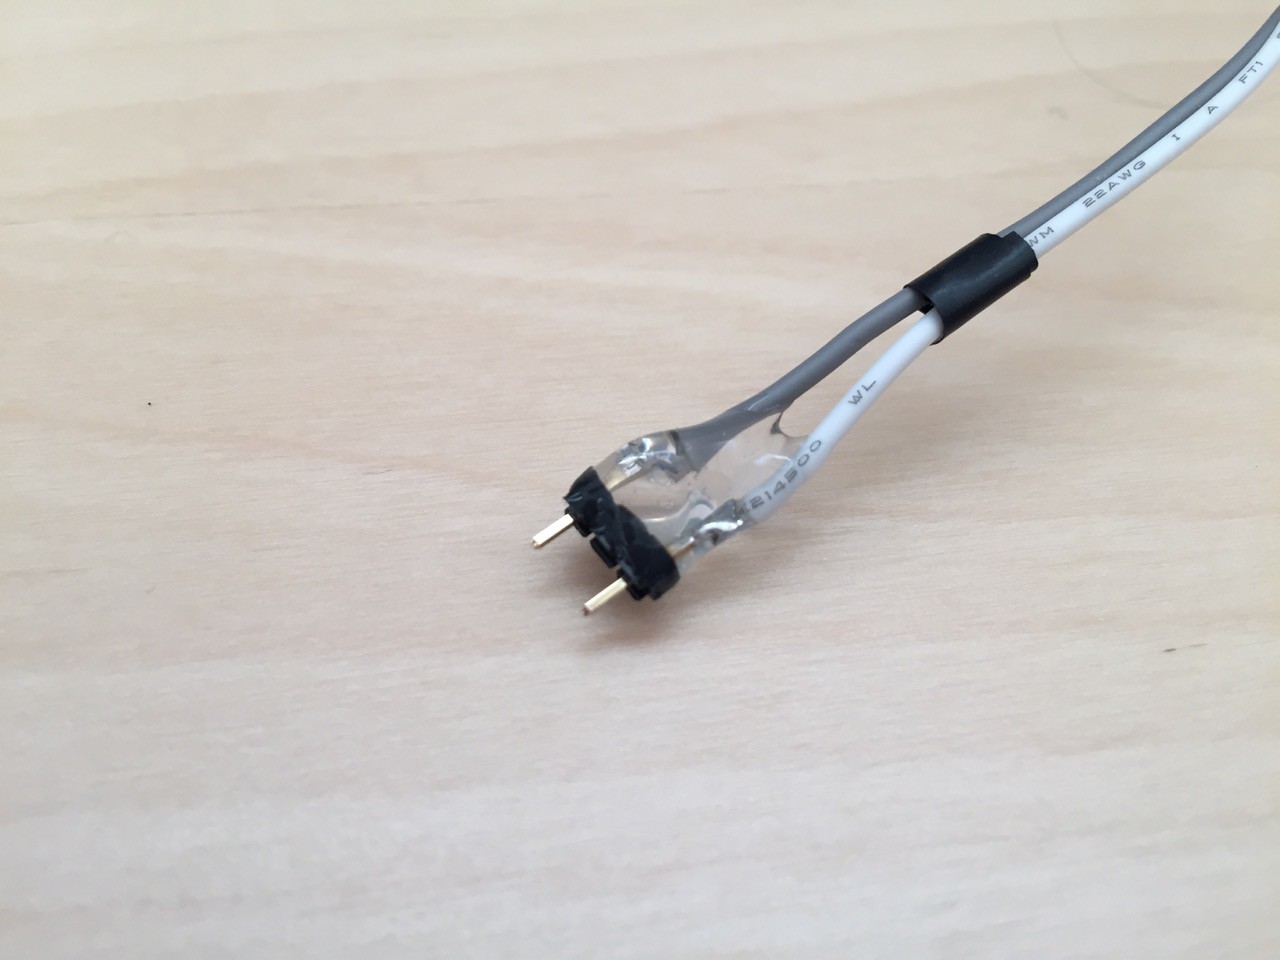
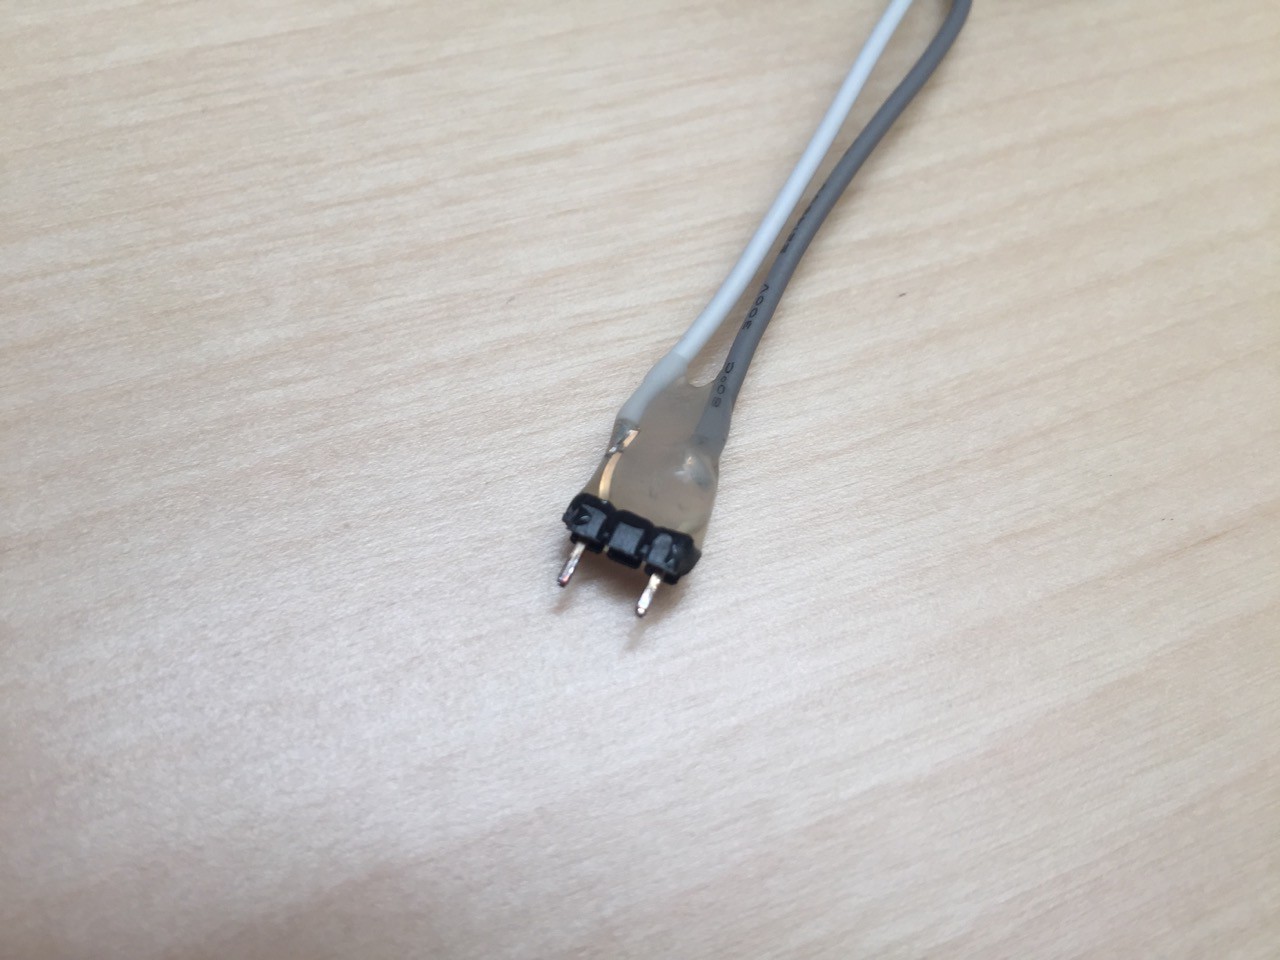
The Vinduino EC measurement probe is an extremely simple 2-electrode device. I used standard gold plated header pins, and electrically isolated the solder connections with glue. The header pins are 0.2" (approx 5 mm) apart, and approx 3 mm length for both electrodes.
When making measurements with any 2-electrode probe, its important to position the probe in the center of the container. Due to field effects, the probe is sensitive to positioning.
![]()
To calibrate the probe, make solutions of salt dissolved in distilled water. For a solution of 1 dS/m, use 0.64 grams of salt, for 2 dS/m use 1.28 grams of salt, etc.
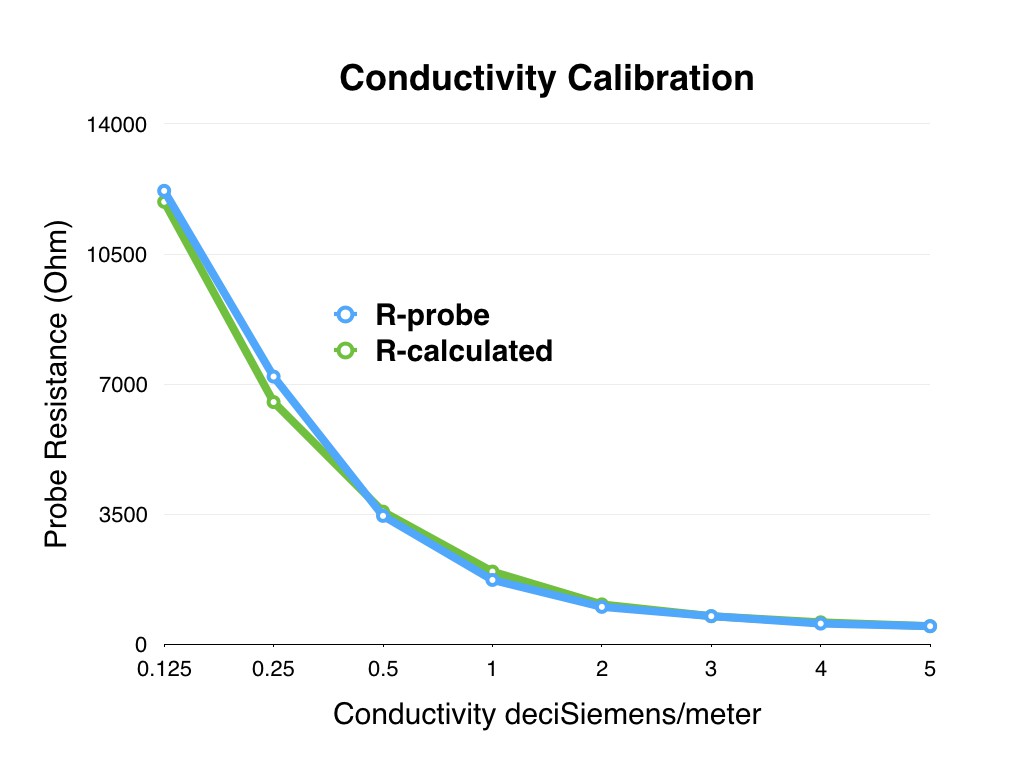
I found below values doing a quick calibration, and came up with a curve that is close to the measured values. The Arduino calibration equation for my probe is:
EC = float (pow (Rprobe/1950.0 , 1.0/-0.87));
Please note that the calibration equation varies with probe dimensions, so calibrating your probe is highly recommended. There is no temperature compensation included, assuming all measurements will be done at 25C.
![]()
I "punished" the probe for 3 days, operating it in a salt solution of 100dS/m
(about 2 x the salinity of sea water), to see how it would hold up in an aggressive environment, and found some discoloration, no major oxidation. With the levels and frequency I am measuring, this type of probe will likely have longevity.![]()
Make the Vinduino handheld conductivity meter
The Vinduino-H PCB is available from OSH Park, http://oshpark.com/shared_projects/QWzdU5S6
Schematics and Arduino sketch is available on Github,
Vinduino
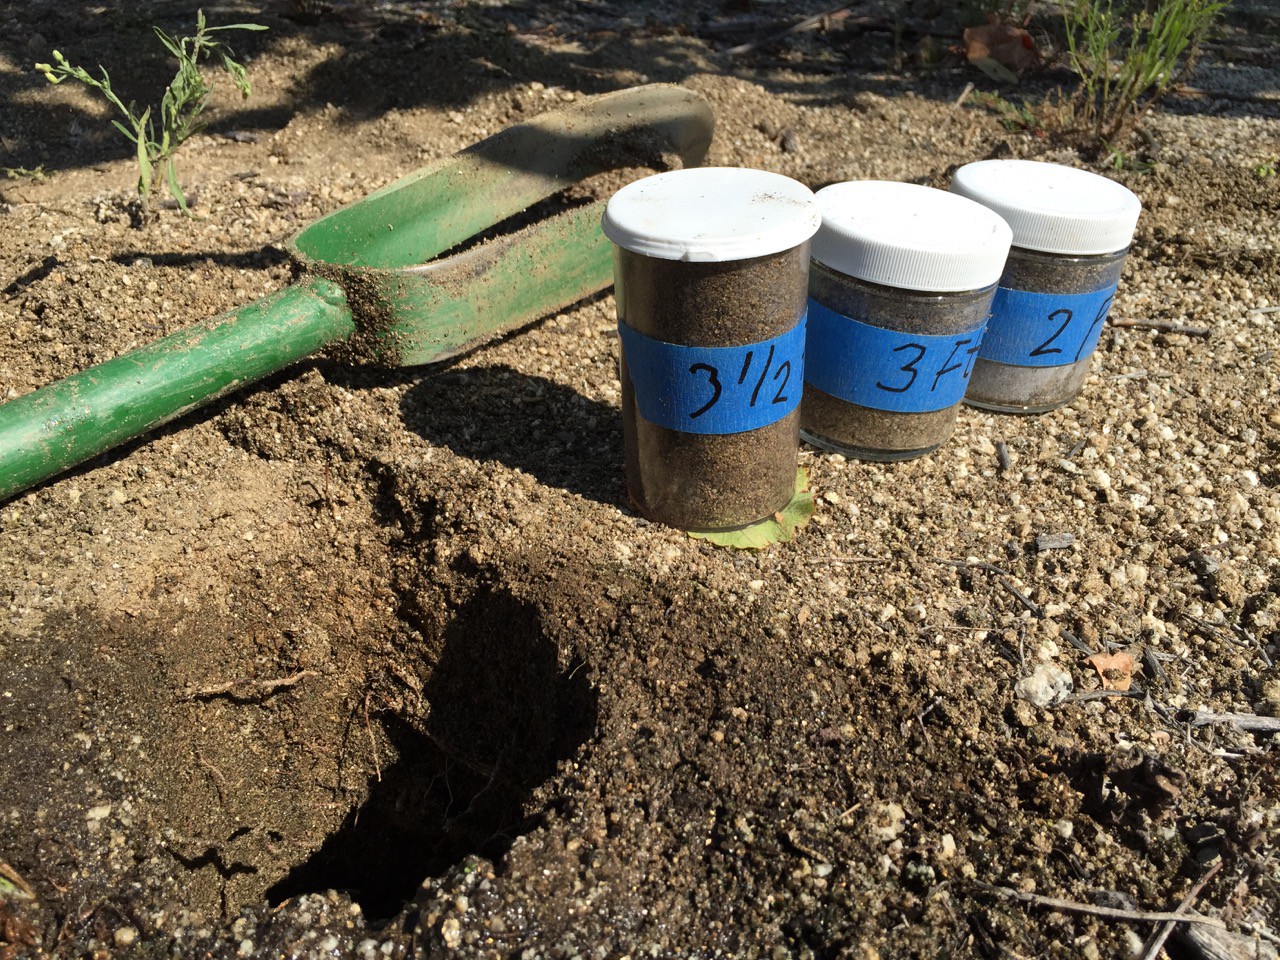
Preparing soil samplesSoil samples need to be collected directly under the dripper, and at different depths representing the root zone. I collected samples at 2, 3, and 3.5 feet.
![]()
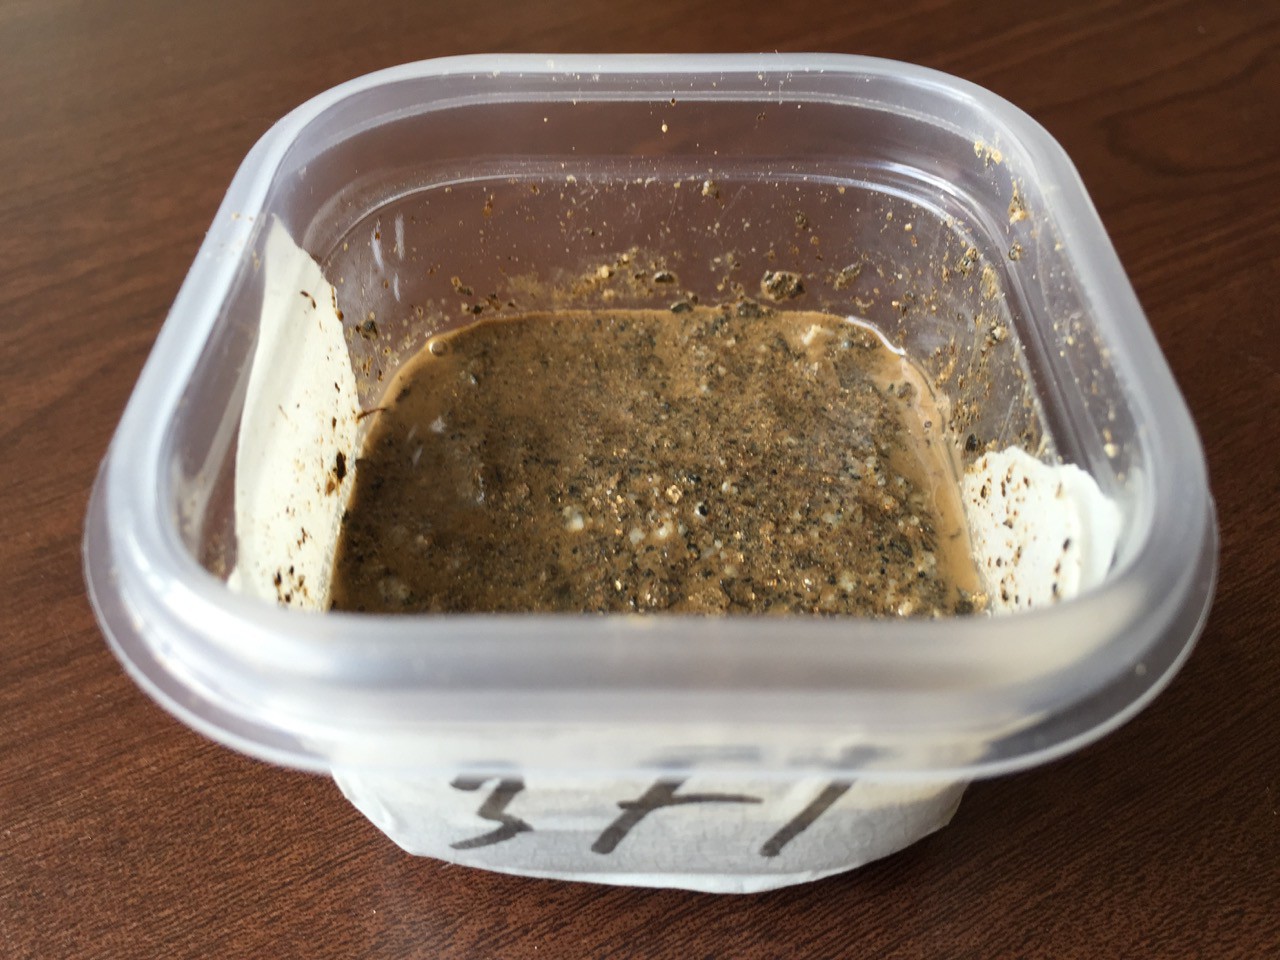
The standard accepted laboratory method for soil EC testing (ECe) uses a saturated paste extract (does not need to be adjusted for soil texture).
An alternative quicker way is the EC1:1 method using a 1:1 soil-water mixture that must be adjusted for soil texture. Result of both methods cannot be compared directly, that's why for this test, I stayed with the ECe saturated paste method.![]()
The formal way to make a saturated paste measurement is to oven dry the soil, then add distilled water just enough to saturate. The surface should be shiny at this point. Leave for multiple hours, so also slow dissolving salts are included. Next is to extract the water from the paste, laboratories use vacuum filtering, and measure the electrical conductivity of the extracted water.
Results
Distilled water 0.0 dS/m (>1.5 MOhm) Drinking water Temecula (Irrigation) 0.6 dS/m (max allowed 1.6 dS/m) Drinking water Orange County 0.9 dS/m (max allowed 1.6 dS/m) ECo vineyard soil at 2 feet 0.6 dS/m (max allowed 2dS/m) ECo vineyard soil at 3 feet 0.6 dS/m (max allowed 2dS/m) ECo vineyard soil at 3.5 feet 0.6 dS/m (max allowed 2dS/m) Measuring soil salinity is just one use of EC (electrical conductivity) measurement. While reading up on the subject of EC and wine, I found some other interesting applications for winemaking:
* During fermentation to monitor nutrition level for the yeast
* Cold stability testing of red and white winesConclusions
Keeping soil salinity levels low is important for irrigated agriculture.
Using an Arduino micro controller board and a very simple probe, accurate and reproducible water and soil salinity measurements can be made.
Using the described Vinduino project setup, ECo measurement results show soil salinity levels below 2 dS/m, no need for flushing out salts from the vineyard soil this time.
Drinking water levels (0.6 dS/m and 0.9 dS/m) are sufficiently below the legal limit of 1.6 dS/m. -
Vinduino Network
10/10/2015 at 19:04 • 1 commentLimited WiFi Range
The current Vinduino setup allows me to collect soil moisture data and send it to the ThingsSpeak website, where I can pull up graphs. As soil moisture changes slowly, having graphic capability is extremely helpful understanding the trends.
With the Highstock Java app, you can pull multiple data streams from ThingSpeak and display them together in one single window, definitely recommended if you have not seen it yet. http://forum.arduino.cc/index.php?action=dlattach;topic=213058.0;attach=66726
![]()
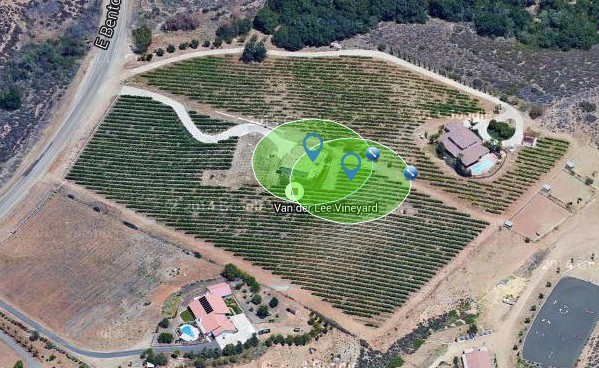
Next project phase is to increase the locations where I measure soil moisture, from 1 to 3, and replace the irrigation valve control timers by a node that allows me on-line control of the irrigation.
As the vineyard is in a rural area, Internet options are limited. I tried DSL, but that turned out way too slow and had incredible latency as well. Instead, I started using a WiFi hotspot. This works fine, but the range is limited to about 30 meters. Below picture shows the current situation. This setup does not allow full vineyard coverage.
Thanks Luke Beno for sharing this tool: http://www.freemaptools.com/radius-around-point.htm
![]()
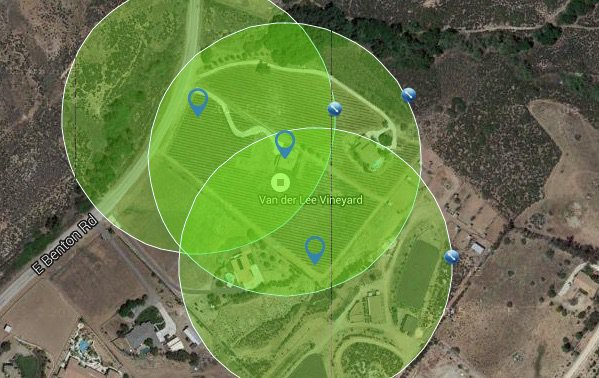
Achieving full RF coverage
To get full coverage of the vineyard, I need at least 130 meter range for each node. That does not require "very long range" 915 MHz RF modules, but it's great to have the luxury of sufficient margin just in case. Output power of the Appcon modules can be set, and 20mW is probably sufficient. Below picture shows that a node range of 130 meters (300 feet) allows nodes in the extreme corners of the vineyard to reach the central node, located at the house. Of course, this is a small property in agricultural perspective, having the option of covering longer distance reliably is a hard requirement for agricultural use. The output power of the modules, and option of using directional antennas, allows for multiple miles of range if needed.
![]()
I chose not to use a mesh network. To keep power consumption low, the nodes wake up every 15 minutes by an RTC module interrupt. They connect to the central node, dump their data, and go back to sleep again. To avoid data collisions, the nodes need to listen before they transmit, and start a delay timer when the frequency is already used by another node.
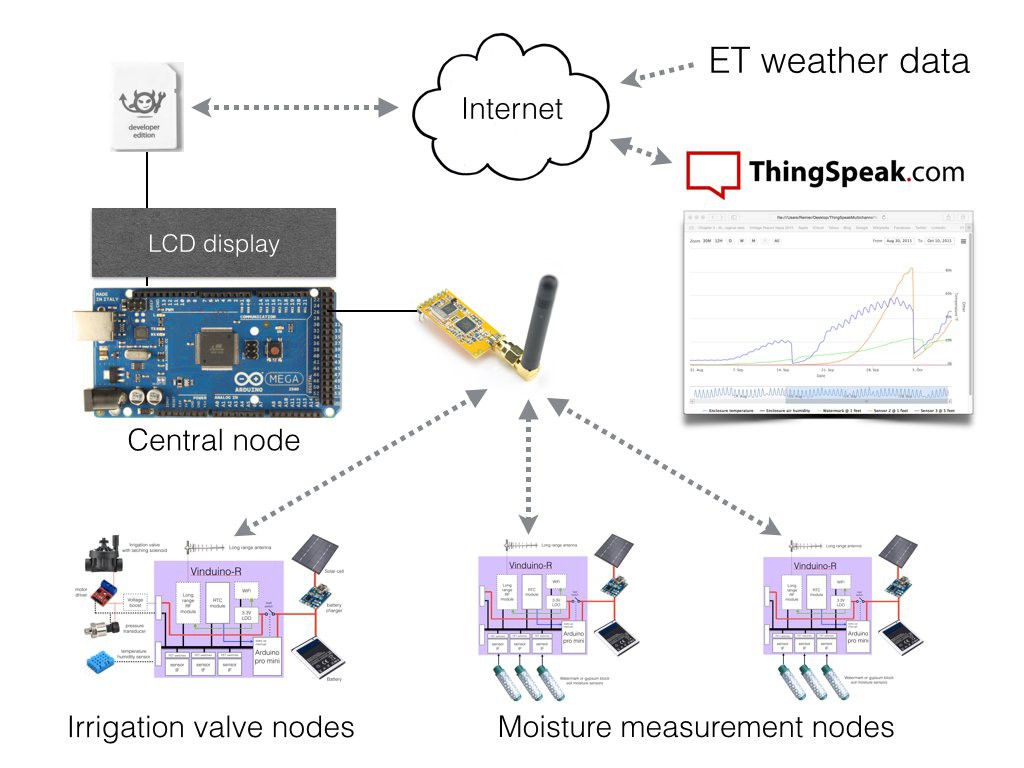
Irrigation valve control node
With the RF connections taken care of, we can now look at the whole system to monitor and control irrigation water.
The Vinduino-R boards can be used for soil moisture monitoring (3 soil moisture sensors max), or can be used to control a DC latching irrigation valve. The unique property of a DC latching valve is that it stays locked open or close after driving it. That greatly reduces power, but there is a risk when the controller losses battery power that irrigation water keeps flowing forever........The Vinduino board has two features to help mitigate that risk: monitoring of the battery voltage, and there is an input for a water pressure sensor. I typically measure 120 PSI before the valve, with a close irrigation valve, and around 30 PSI when the valve is opened. Pressure sensors are low cost (starting at $30) and are easy to use. They need 5V supply voltage, and the output scales linearly with pressure between 0.5V and 4.5V. Having water pressure feedback is a great way to check if valves are operating appropriately.
![]()
Determining irrigation time
Irrigation time is managed to replace the water that is used by the vines on a daily basis. The irrigation dripper need to be checked/calibrated so you know that a 1 gallon/hr dripper really does what it is supposed to do. Usually it takes adjusting the irrigation system to ensure homogeneous irrigation over the whole area. Once you have that done, you know the time it takes to replace a gallon of water.
The Vinduino system combines two variables to determine grapevine daily water use, and adjust irrigation times towards that. Using local ET (evapotranspiration) data from a local weather station, or use your own weather station to calculate that.
The state of California has developed a protocol to get daily localized ET data: http://www.bewaterwise.com/icp/IRWD.pdf
ET0, together with the "crop factor" (how much % of foliage covers the ground), can be used for a calculated estimate of the water use per grape vine.
The crop factor varies over the growing season, so the estimate has quite some error-margin. By including soil moisture trend to the irrigation time estimate, we can optimize the irrigation time to really match the grape vine water consumption.Assuming the goal is to keep moisture constant (replacing vine water use), an increasing soil moisture indicated overshooting the needed irrigation time, etc..... Of course, we measure in the root zone, and avoid drainage below the root zone.
The Vinduino project started a collaboration with Luke Beno's analog.io - A full stack IoT platform for the further development of the back-end service and user interface. As a first result, I am now looking at using the Electric Imp for Internet connectivity and pulling in ET data.
-
Mini Gypsum Sensors
10/02/2015 at 02:27 • 0 commentsFor high moisture environments and shallow depth applications the gypsum sensors developed for Vinduino can be improved for responsiveness at <20 kPa soil moisture. Reducing the (gypsum) body volume of the sensor will likely give an improvement.
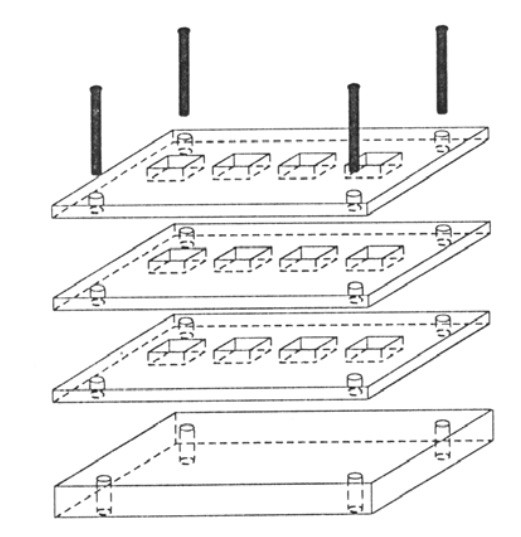
I came across a publication "Development of Mini-Gypsum Blocks for Soil Moisture Measurement and their Calibration to Compensate for Temperature" by A. Keyhani, that describes a easy to reproduce and small body volume/low hysteresis gypsum sensor.
Below picture shows the acrylic mold used to make this sensor by stacking layers of gypsum, using stainless steel mesh as electrodes.
![]()
"Mini-gypsum blocks were constructed using a clear acrylic mold capable of making four blocks at a time and prepared in four layers (57 mm × 160 mm) . The base layer (6 mm thick) was solid and each of the other three layers (3 mm thick) had four openings of the dimensions 3 × 15× 17 mm.For each gypsum block, two probes of stainless steel mesh screen No. 14 (0.64 mm) with the dimensions of 10×10 mm were used."
This looks very promising, definitely worth further investigating. Maybe this project is not done yet .......
Development of Mini-Gypsum Blocks for Soil Moisture ...
-
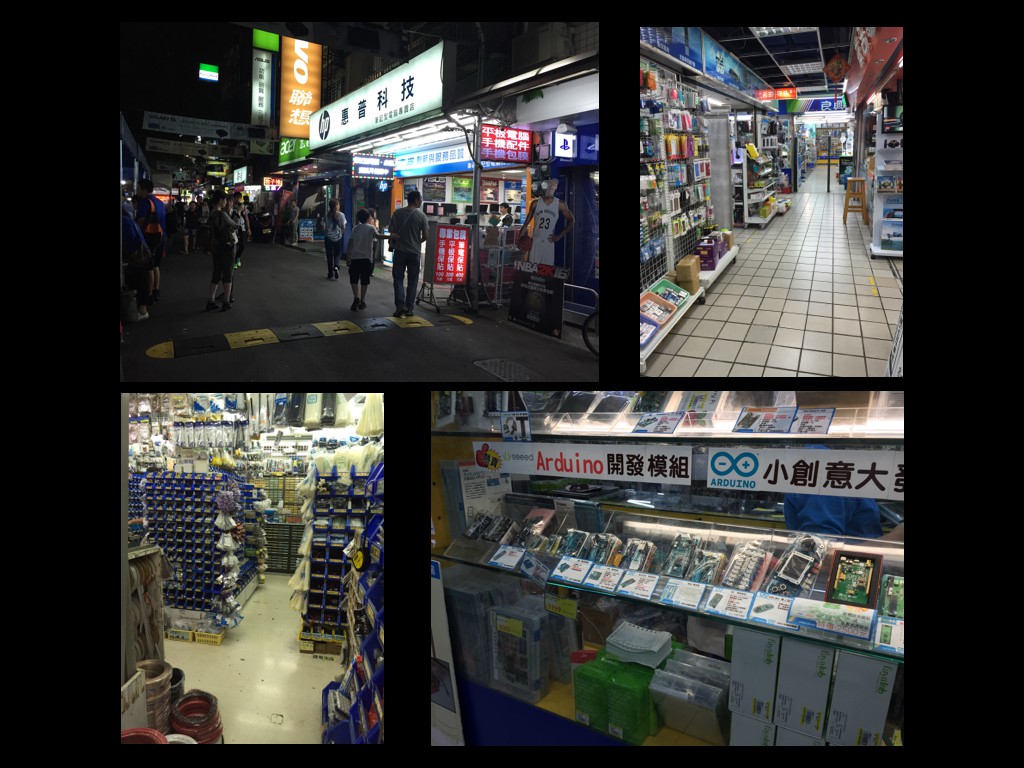
Shopping for Vinduino in Taipei
09/20/2015 at 14:25 • 0 commentsThe Taipei Guang Hua electronics market is my alternative for visiting Shenzhen. Every time I go there for business, I usually return home with new inspiration and a bag of components "that I may need some day". Added benefit is that it does not break the bank.
There is something satisfying scanning all these racks full of electronic components, and finding that rare part that exactly fits your project.
I picked up many components for the Vinduino project here.Definitely recommended if you have some time to spend in Taipei. Every taxi driver knows it, and from any location in Taipei it will take you 15 minutes max to get there.
If you take the MRT, the efficient underground transport system, you want to get off at MRT Zhongxiao Xinsheng Station.
![]()
-
Rain .... finally
09/17/2015 at 06:33 • 0 commentsRain September 16
We had rain in Temecula this week. Hopefully the first of many more to come this winter.
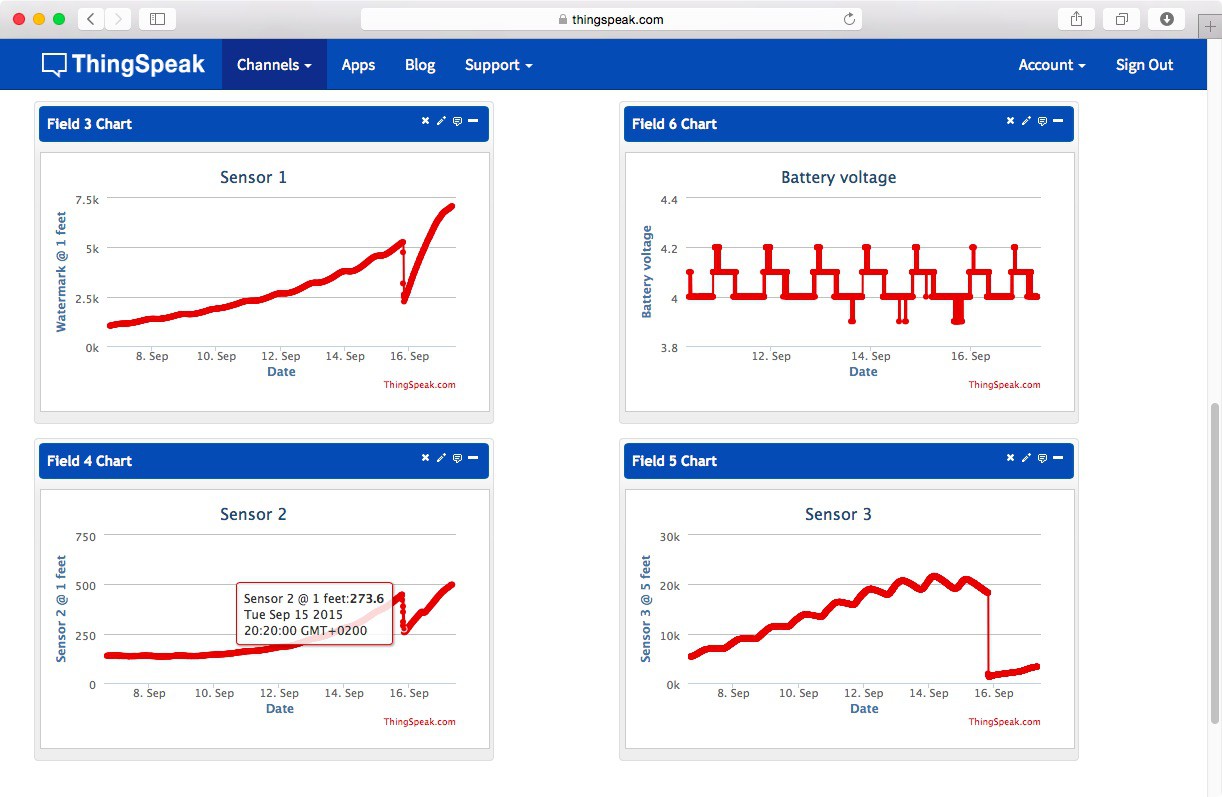
Interesting to see how this shows up at the sensors.
Sensor 3, @ 5 feet depth shows day to day variation with each small daily irrigation event.
Sensor 1 and 2 are installed at shallow depth of one foot. The shallow sensors register the rainwater, but the water does not stay in the top layer for long and the moisture goes back to the level before the rain.
From how it appears, the rain water descends quickly through the soil, having most impact on the moisture at 5 feet (below the active root zone).A live feed from the vineyard soil moisture can be seen here: https://thingspeak.com/channels/37248
![]()
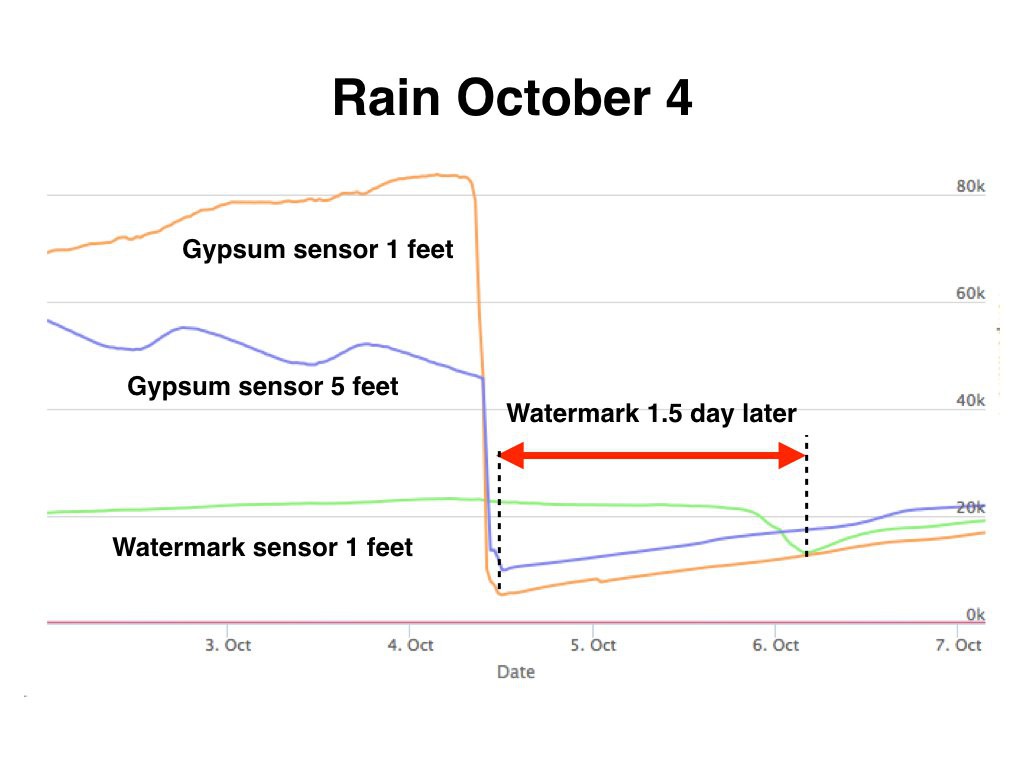
Update: Rain October 4
After harvest, I had the chance to reduce irrigation and monitor the sensors at soil moisture close to "ludicrous" dryness levels. The gypsum sensors keep working fine at low soil moisture, but the Watermark sensor loses sensitivity when operated above 10kOhm sensor resistance. When rain came on October 4, the gypsum sensors (orange and blue lines) immediately registered this event with a sharp drop in resistance, while the Watermark sensor (green line) responded with a shallow resistance drop 1.5 day later.
![]()
Comparing both type of sensors
The Watermark is better at registering changes in moisture at high moisture levels (< -15kPa) , and the DYI gypsum sensors have a better responsiveness at low moisture levels (>-50kPa). For the range where irrigation should be initiated, -20kPa to -60kPa,both type of sensors can work well.
-
Soil moisture distribution and what's next
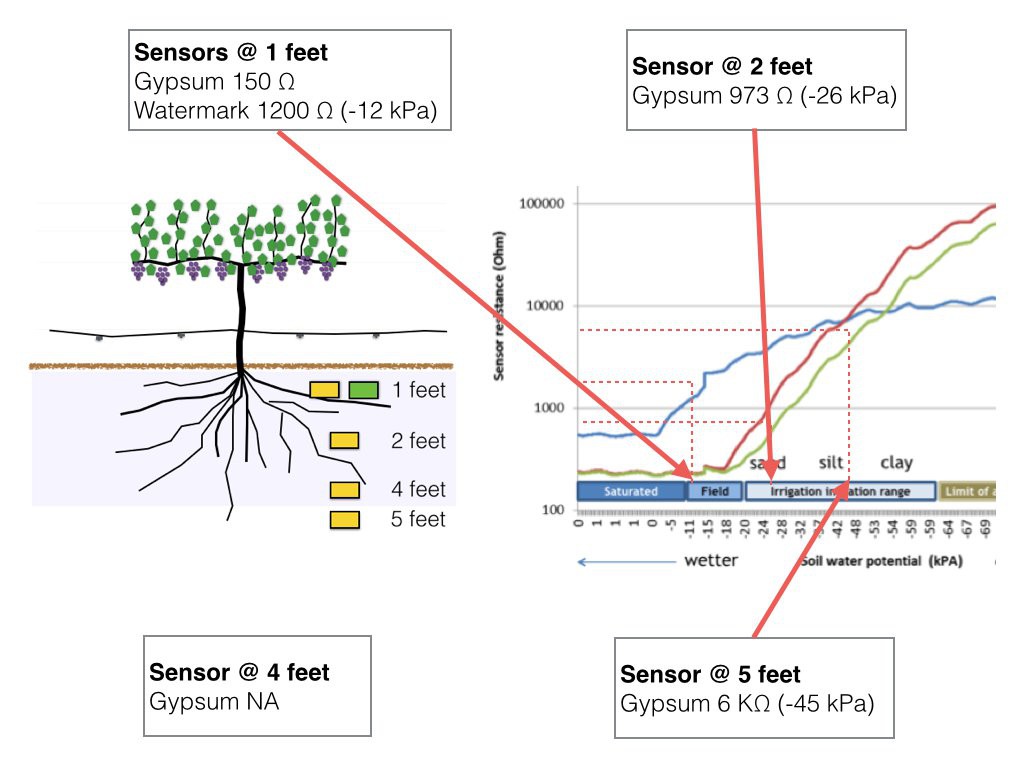
09/15/2015 at 18:35 • 0 commentsAdding more sensors at 1 feet
To get a better picture of the soil moisture dynamics, I added sensors at 1 feet, in addition to the sensors at 2, 4, and 5 feet.
One sensor is the DIY gypsum sensor, and for comparison I added a commercial Watermark sensor.
From earlier comparison measurement data, I found that the gypsum sensor is not sensitive at high moisture (< -15kPa) , where the Watermark is showing a good response at saturated moisture levels.![]()
Directly after the grape harvest (September 2), I stopped irrigation to see how the sensors would respond. Interestingly, the Watermark sensor at 1 feet, and the gypsum sensor at 5 feet were the first to show a response. At lower moisture levels -the point where you normally want to initiate irrigation- the gypsum sensor is sufficiently sensitive.
Vertical moisture distribution evaluation
The initial idea behind the Vinduino project was to replace the daily water use of a grape vine, by daily irrigation, and manage irrigation quantity and frequency such that irrigation water gets used in the active plant root zone before it can percolate out of reach of the plants.
Soil moisture readings taken after harvest, September 6, show moisture level distribution as expected and desired. High moisture levels in the top layers and root zone, and much dryer (-45 kPa) at 5 feet depth, below the active root system.
I left the 4 feet sensor out, as it shows signs of poor soil contact, making readings unreliable.
It takes a long time (months) before a stable moisture distribution is established, especially considering agricultural scale of this project.![]()
Vinduino project considerations
To determine success or failure of a project like this, at least a full growing season should be considered. There were also some start-up mistakes and irrigation controller failure that impacted the end result, but overall I am pretty happy with the savings and much tighter control of our vineyard's irrigation.
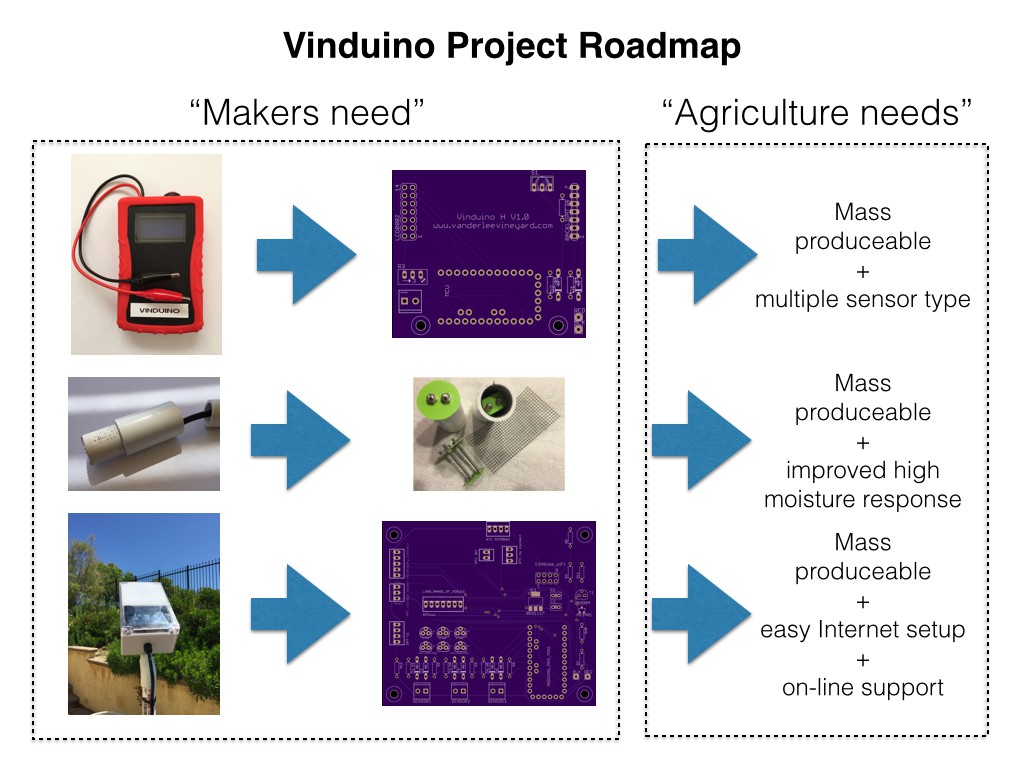
Taking the Vinduino project to agricultural users
By making project details available on-line, an experienced electronics hobbyist should be able to reproduce the setup and results of he Vinduino project. And, of course, it helps that printed circuit boards are available to avoid wiring mistakes :-)
Nevertheless, for agricultural users to save 25% irrigation water by using this method of irrigation, the hurdle of building and programming the system should be taken away.
Farmers have a talent for finding the most efficient way of getting things done. Now we have field evidence that the Vinduino irrigation project can save water, the next step is to provide a "ready to use" solution that can be implemented fast and easy.
Food for thought :-)
![]()
-
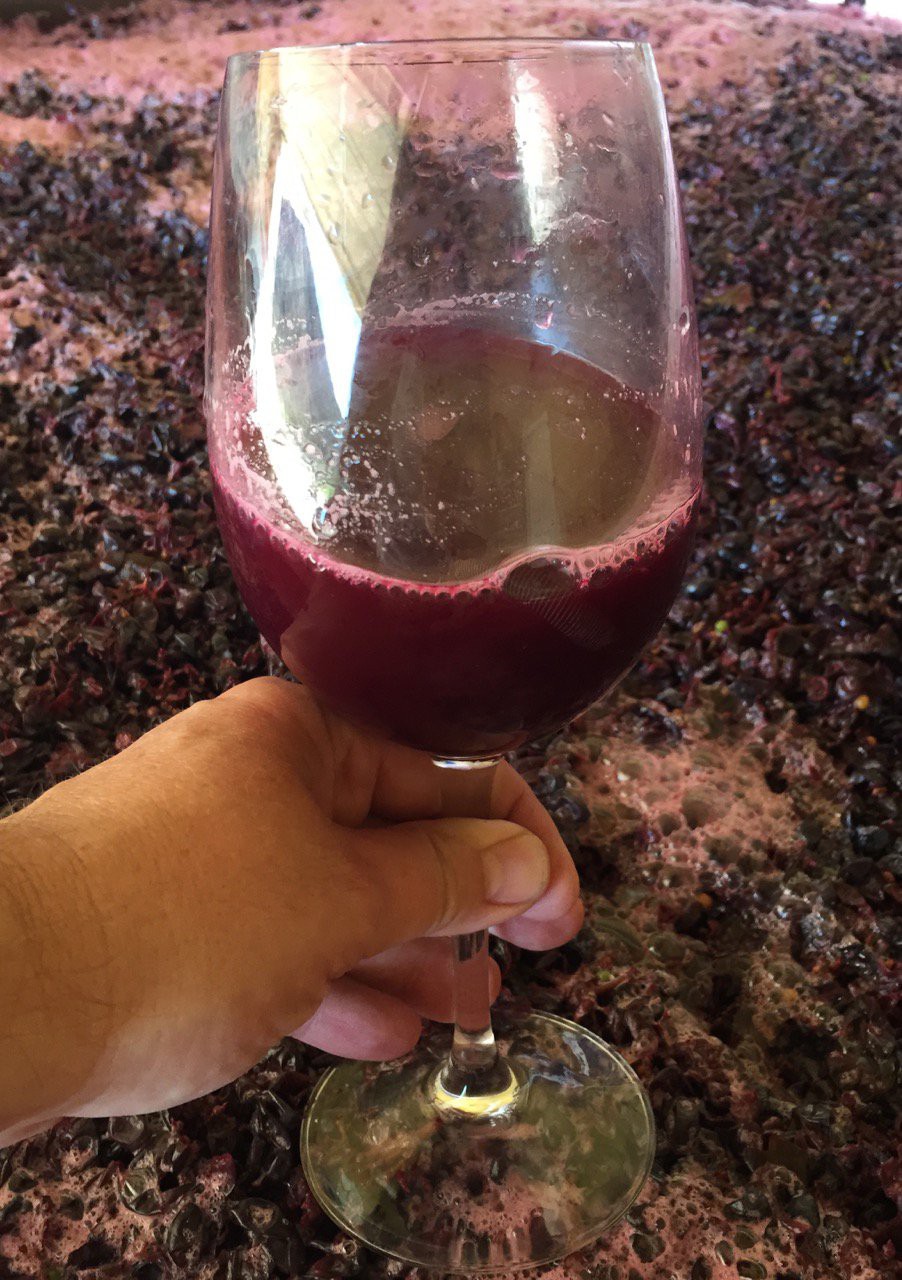
Seasonal results are in!!
09/13/2015 at 22:38 • 2 commentsWe harvested our wine grapes on September 2, and in the weeks leading up to harvest I did not want change the irrigation schedule. The wine was pressed after one week of fermentation and transferred to barrels this weekend.
We started actively managing irrigation and collecting project data in May, so this is a good moment to evaluate results.![]()
Estimated water use per vine versus actual use
Using local weather station evapotranspiration (ET0) data, you can estimate the daily water use of a plant.
Larry Williams of UC Davis, published details on how to use your local weather station ET0 data to estimate water use of a grape vine. This summer, at temperatures reaching well over 100F, one single wine grape vine can "drink" 4 gallons of water on a single day.Of course, this is an estimate based on many assumptions, so -while trying to keep soil moisture constant- we found that we got very close to the calculated estimate.
![]()
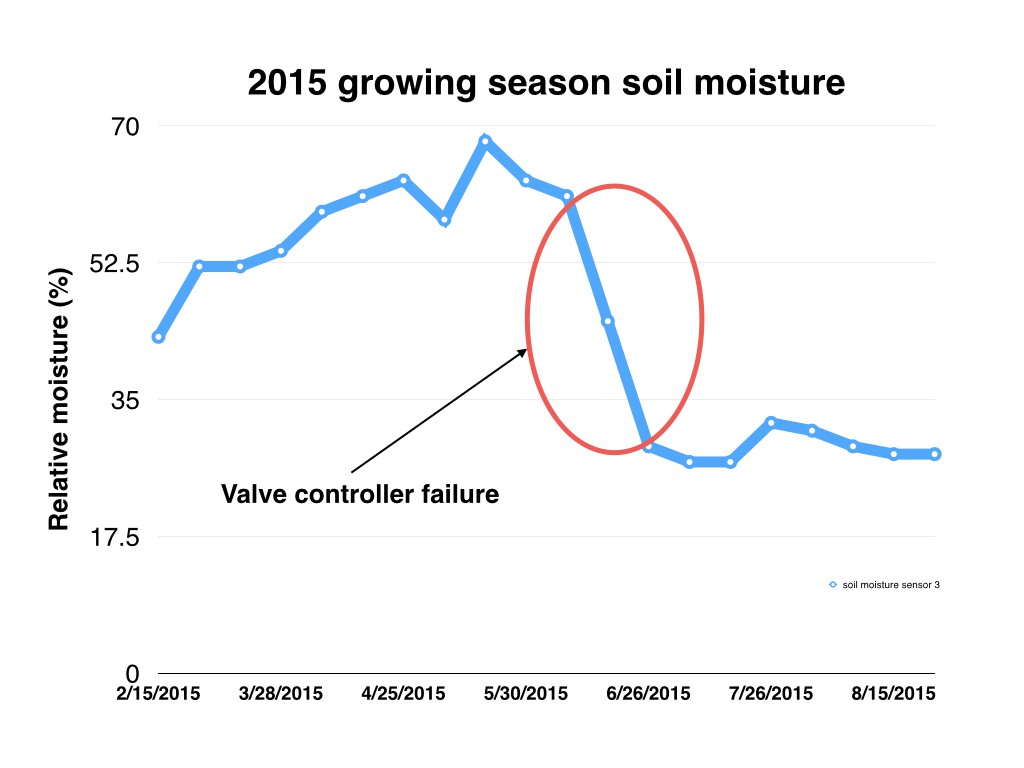
Seasonal soil moisture levels
Late Spring we noticed a fast drop in soil moisture at vineyard irrigation block 2. It turned out that the controller/timer that diverse water to block 2 had an empty battery. After replacing the battery for a fresh one, the next week we had the same problem. The timer was replaced the week after, but by that time the vines had used a considerable part of the available soil water reserve.
We decided to not replenish the lost water, but instead provided replacement for the daily vine water use. As the graph shows below, we kept the soil moisture constant by doing so.
![]()
Grape quality 2015 compared to 2014
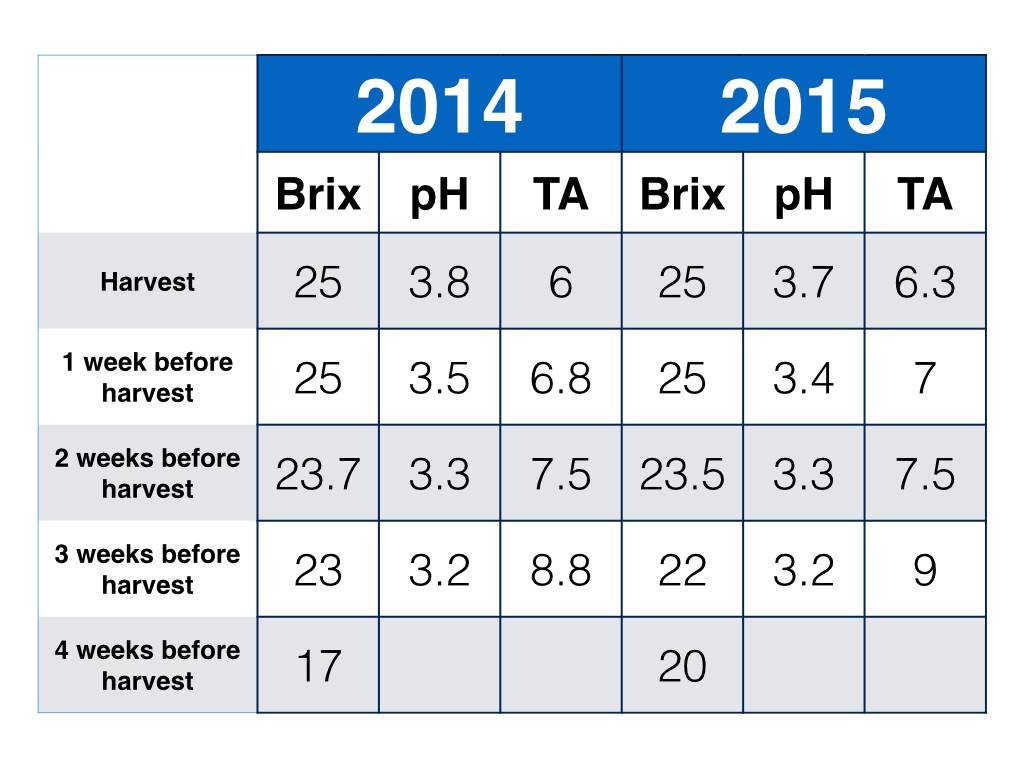
In the weeks leading up to harvest, grape growers and winemakers collect grape samples to determine ripeness and best time to harvest. Leading indicators used for ripeness are:
- Brix (percentage of sugar in the grapes, 25 Brix = 25% sugar)
- pH
- TA (Titratable Acidity, expressed in gram/liter)
When grapes mature, sugar levels go up, and acidity goes down.
These are the "hard numbers", additionally taste, and color of the seeds (need to be brown, not green) are important.
Below table shows the data for Brix, pH, and TA in the weeks before harvest for 2015 and 2014.To summarize, 2015 has slightly higher acidity, but nothing that can be attributed to a different irrigation regime.
![]()
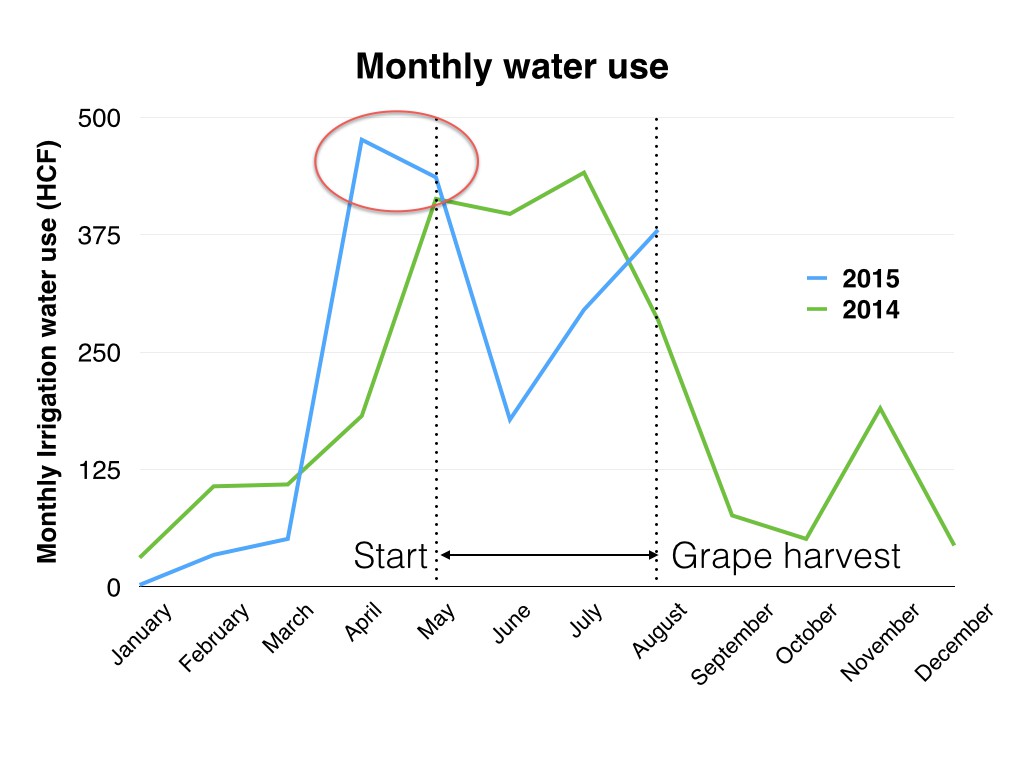
Monthly water use compared
Under professional irrigation management in 2014, deficit irrigation was practiced in the month before harvest. This means that the grape vines get much less water and this is supposed to give better quality grape material. It also means that the grapes lose water content and start to shrivel at the moment of harvest. Average weight loss is 30%, meaning less income for the grapegrower who gets paid by weight.
The jury is still out about the improved taste of wines made from grapes that have struggled. Blind panel tastings usually come out inconclusive.For 2015, we decided to keep water flowing in July and August, but still target an overall 25% water reduction.
Due to early bloom and cold weather in the Spring, grape clusters did not fully develop this year. Not only in our vineyard, but in whole California harvest weights are 25% below last year. So we lost 25% weight and gained it back by not using deficit irrigation. We got about the same crop weight harvested as last year. I think there is insufficient data to say anything about impact of the daily irrigation on crop yield.
![]()
How about the goal of saving 25% irrigation water?
When we switched from outsourced (manual) irrigation to using timed valves in combination with Vinduino soil moisture sensors, we had to learn the hard way what the actual flow rate and timing of the irrigation was. Initially, at the start of the irrigation season, we overshot terribly. See graph above, April and May. Apart from the first two months, we've become pretty good at interpreting Vinduino soil moisture sensor readings, estimating daily vine water use and looking at the vine growth as indicator of plant happiness.
If you include the overshoot at the start of the season, we slightly exceed the target of using 25% less water vs last year's water use (green line in below graph)
Excluding this beginner's mistake, as shown by the yellow line, we meet the target and will be able to repeat this year's results next year.![]()
Vinduino, a wine grower's water saving project
Monitoring soil moisture at different depths to determine when to irrigate, and - more importantly - how much water is needed. Save 25%!