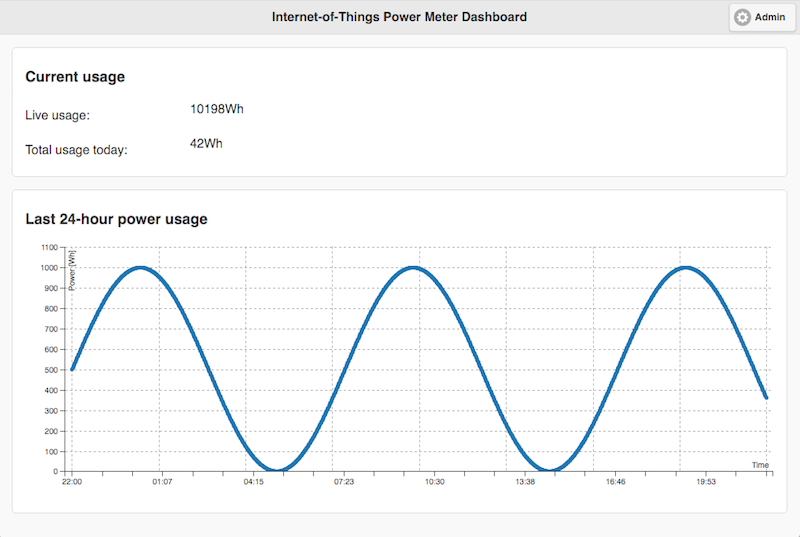
One of the goals of the IPM is to sensibilise people to their power consumption via providing information on how much and when it is used, as lowering ones power usage is just as effective in mitigating the worldwide energy issues as creating new renewable ways to produce it.
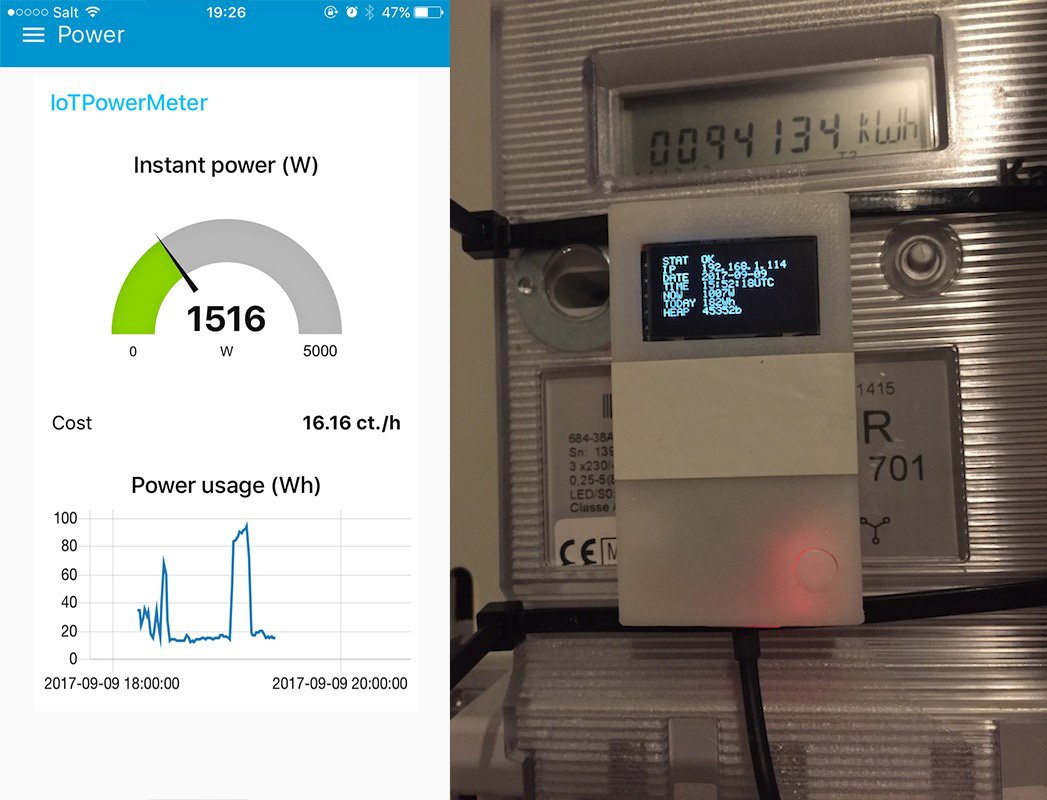
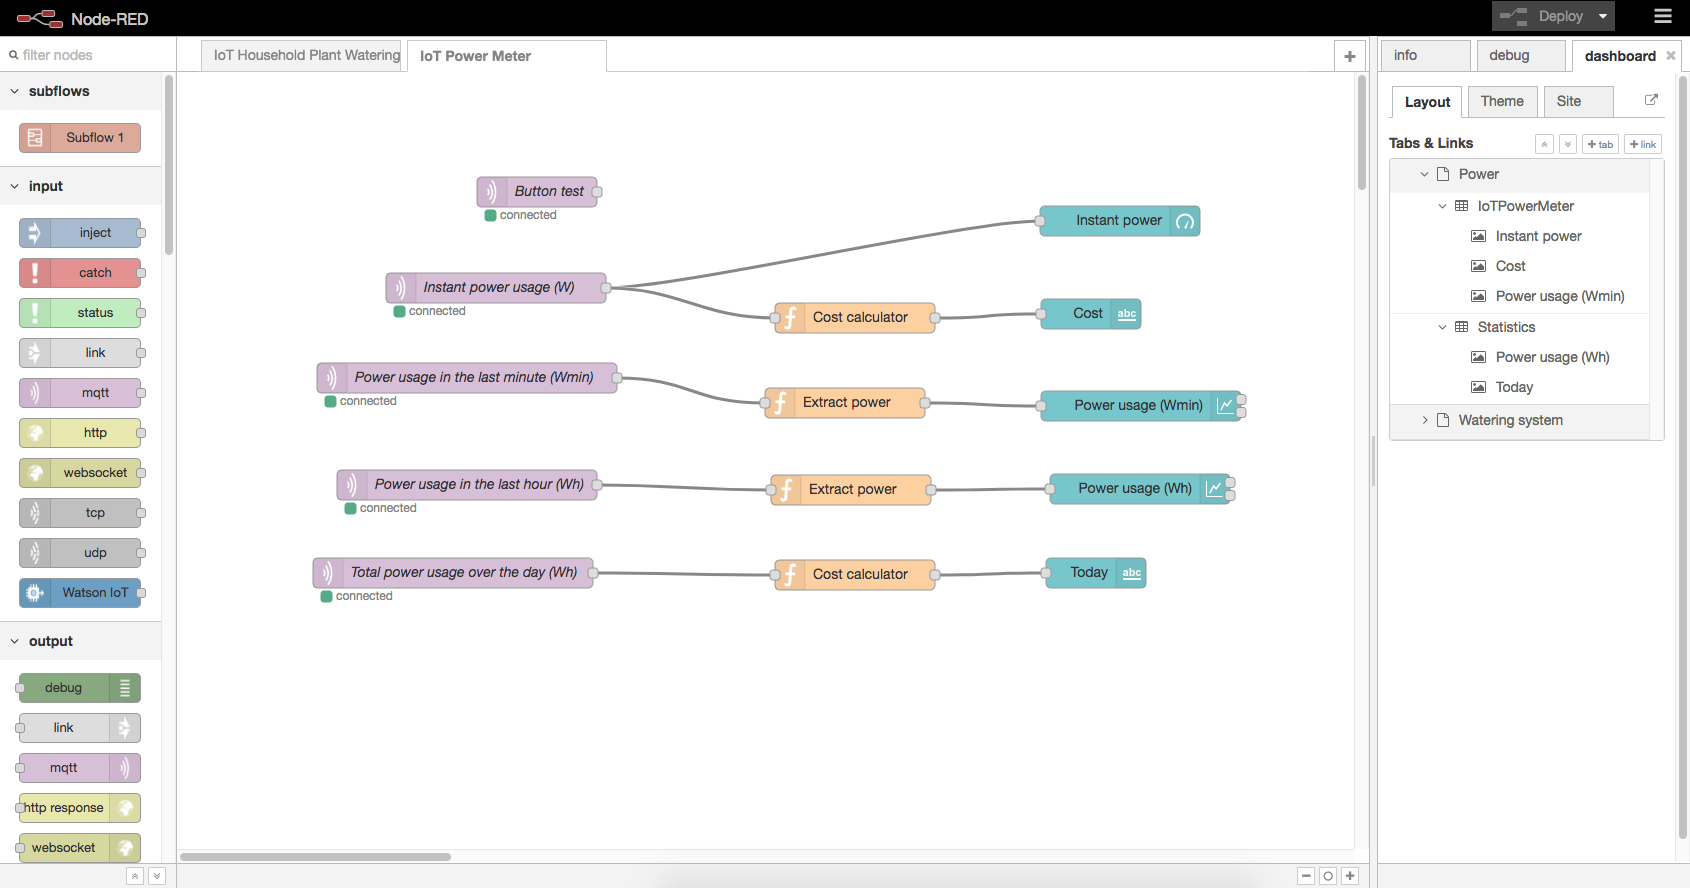
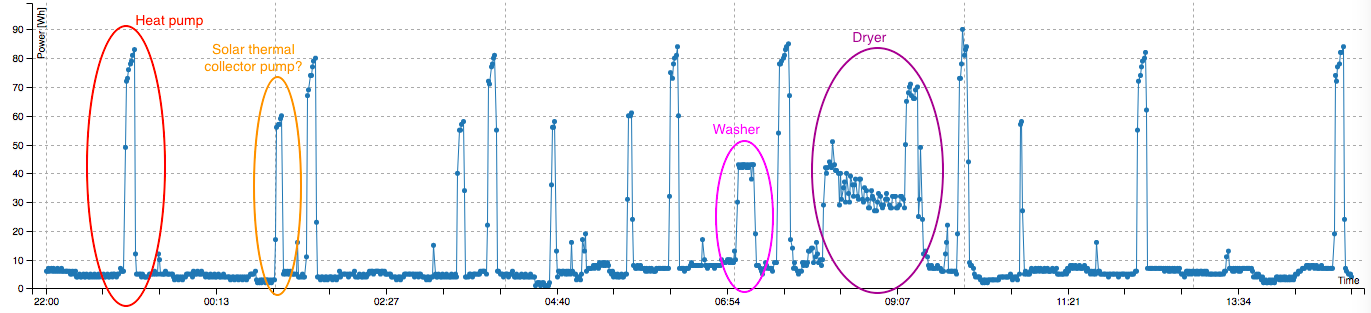
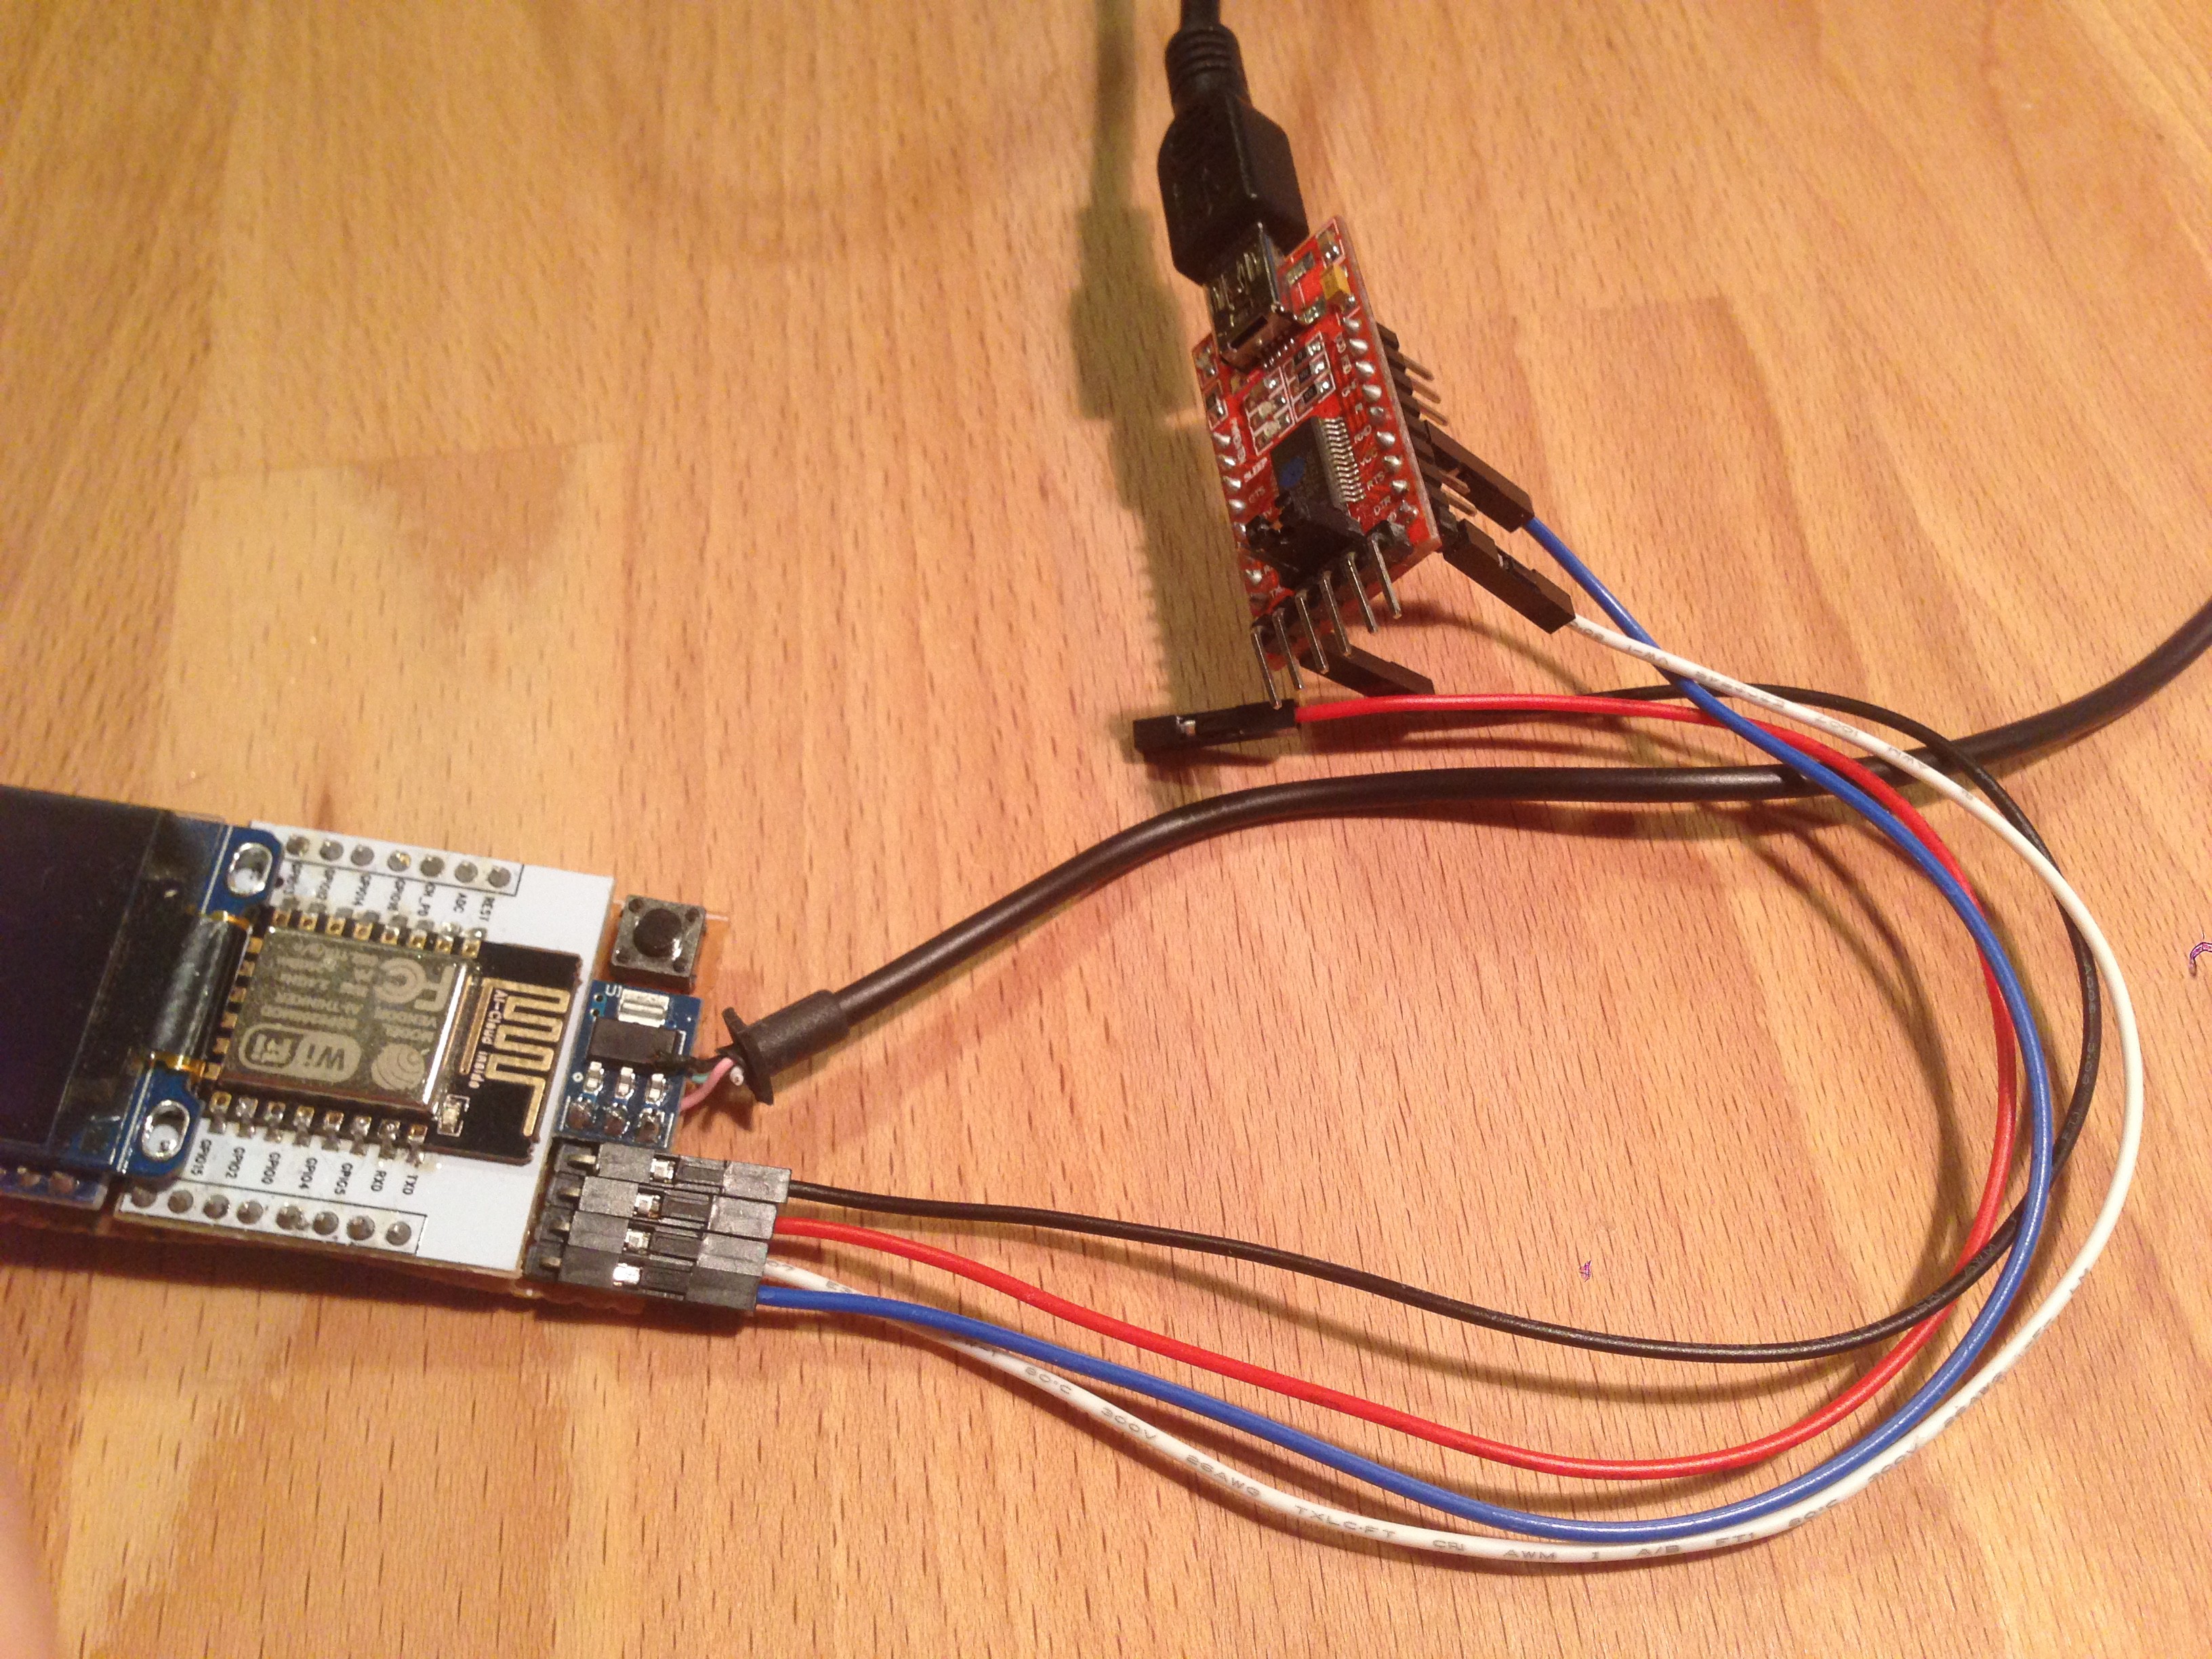
After the first version of my IoT project measuring my power consumption I wanted a better finished project that had a higher resolution (minutes instead of hours), local storage and a server that could be accessed to see live power usage.
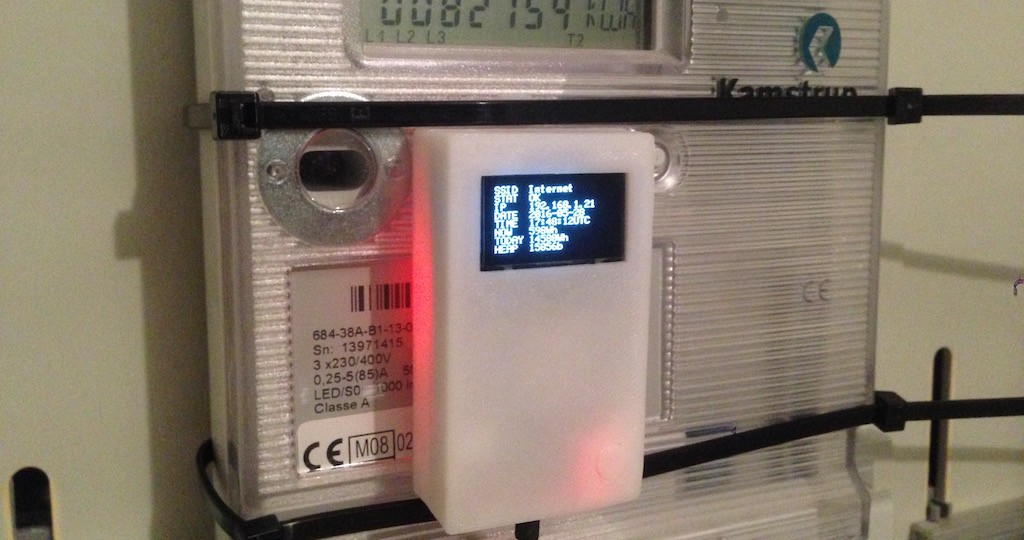
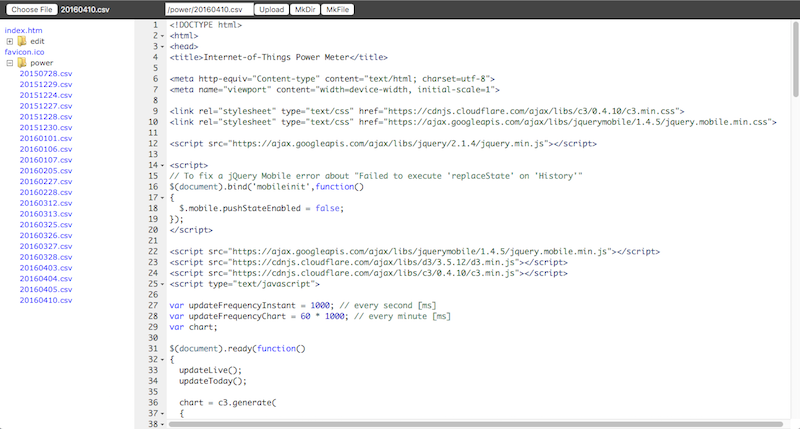
I also wanted a cheap project that could be easy to source and build. The IPM is open-source and documented in a way that anybody can assemble one and program it. The total cost is about $20, the complete bill of materials is available with links to source each component.
 This had many advantages:
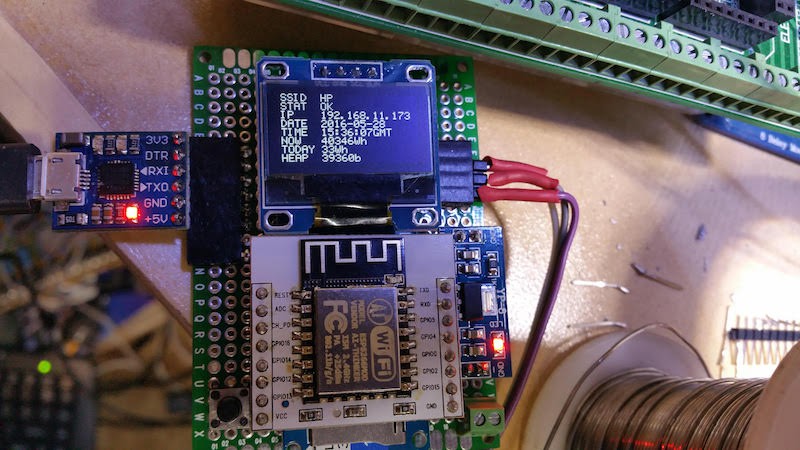


 Shebin Jose Jacob
 Fabio Balzano
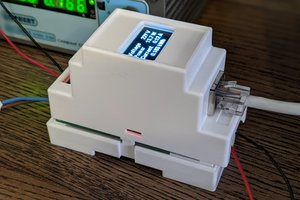
 strange.rand
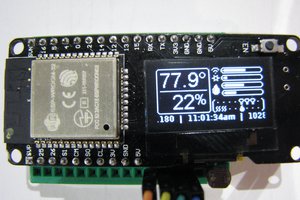
 Jeff Taylor