The web user interface currently consists of a live power counter, a total day counter and a graph showing daily used power with a minute resolution.
An example of the current state of the front end, these are dummy numbers:
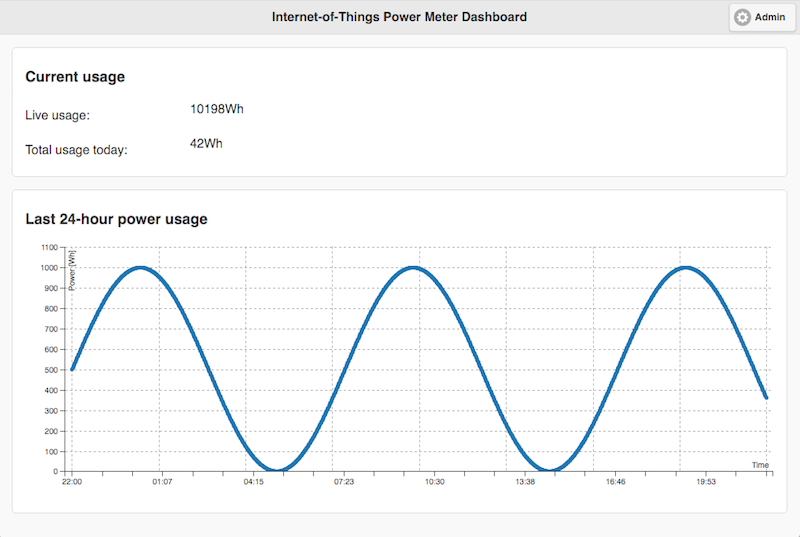
It is based on jQuery Mobile as it's simple, pretty and quickly implemented, it's also touch-screen friendly making it usable on smartphones and tablets. The graph is generated by the C3 library. The libraries are hosted by Google which make loading times faster and less work for the ESP, although it requires Internet connectivity.
The administration page is an unmodified version of what's coming with the SDWebServer example of ESP8266 code for Arduino IDE. It can show all the files on the SD card and allows uploading and downloading files.
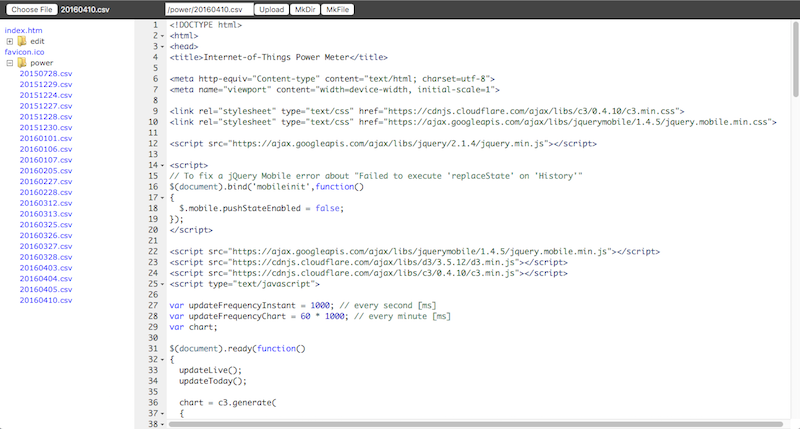
The files can be updated by uploading a file with the same path and name.
Discussions
Become a Hackaday.io Member
Create an account to leave a comment. Already have an account? Log In.