 Lex Kravitz
We have recently finished an analysis package for analyzing FED data files in Python. (Note: by "we", I mean programmer extraordinaire, Ilona Szczot!) The goals of this analysis package are to provide visualizations and quantification of feeding rates and patterns of mice using FED.
Background: FED spits out CSV files that update whenever a pellet is taken, resulting in a file of time-stamps:
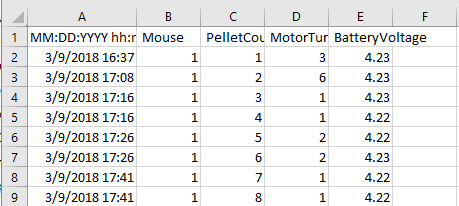
Often, we'd rather look at data in a "binned" format, to answer questions like "How many pellets did they eat in the last 2 hours?" This requires some processing.
(Note: we didn't set up FED to bin the data as it is collected because we'd have to pre-specify the bin width to do this, and this may differ between different experiments.)
Use: We wrote a GUI-based Python analysis package (also available in the Files area) that allows for a user to chose a folder where the FED output files are stored, set the circadian cycle times, choose which dates to analyse, and set the bin size in minutes. To run:
1) First dump all of your FED files into a directory. These can include multiple files from the same FED.
2) Open the script in Python 3.6 or greater. I use Spyder to run it. When you first run the script this window pops up:
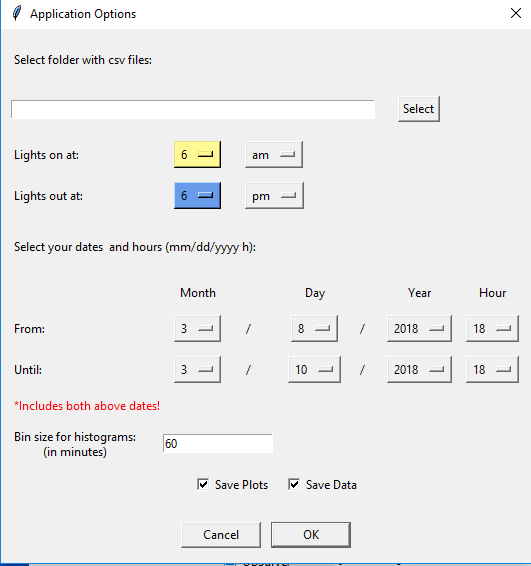
3) Set these variables and click OK. A second window will pop up which allows you to filter based on mice. It will default to choosing all of the mice that have data in the folder, but you can limit the analysis to specific mice.
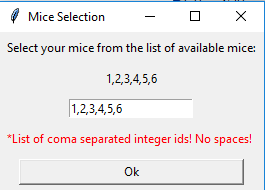
4) Click "OK" and the script will run, generating a new folder in your data directory, named with the unique name/time-stamp "ResultsMMDD_HHMM_SSs". This new folder will contain several visualizations, as well as Excel files containing the data underlying these visualizations.
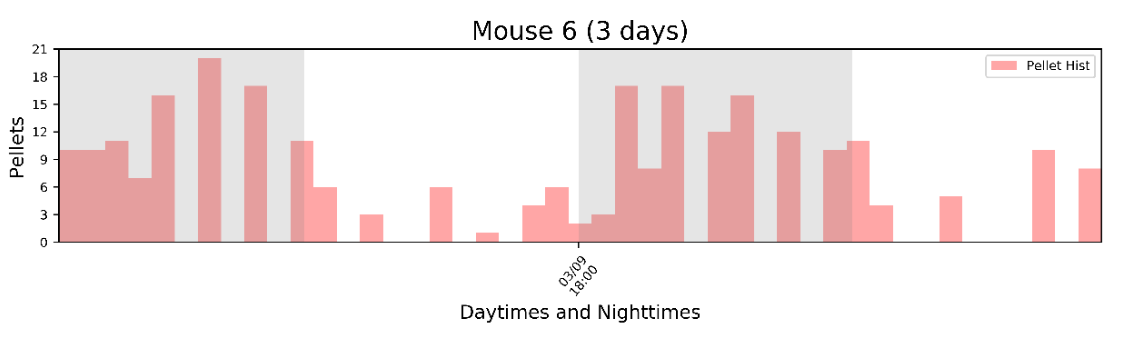
Output: The visualizations include individual histograms for each mouse:
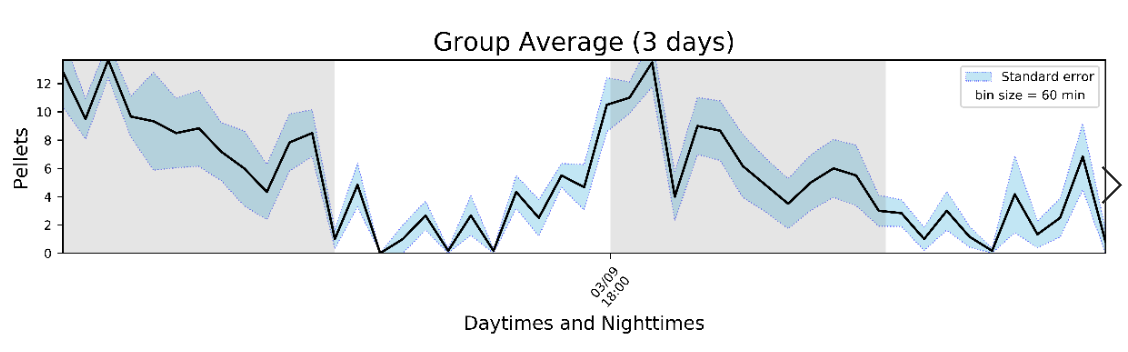
An average histogram of all mice:
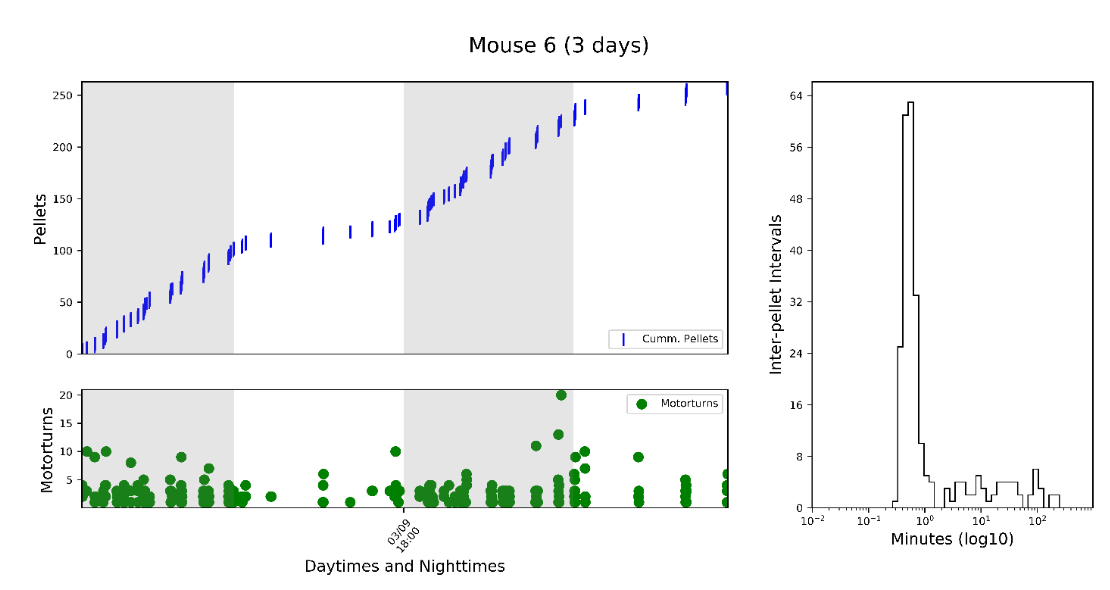
Individual figures for each mouse showing cumulative intake, motor turns, and an "inter-pellet-intervals" histogram. This histogram tells you about meal patterning. For instance, here we can see that the mouse consumed ~250 total pellets. The "motor turns" variable reports how many times FED moved the motor to dispense a pellet - this shows you where jams happen. <10 turns in OK, if it jams you might see a number >500 turns! The right plot is the inter-pellet-interval, in minutes. Here, the peak is at ~30seconds, meaning that this was the most common interval between pellets. If a manipulation changed the eating rate within means, this peak may shift to the left or right.
A zip file has been deposited in the files area that contains the Analysis Python script, a readme, and sample data that you can run to generate the above plots. Feedback is always welcome!
Discussions
Become a Hackaday.io Member
Create an account to leave a comment. Already have an account? Log In.