Bruce Land
Filter bank log-centered spectrum analyser with TFT output
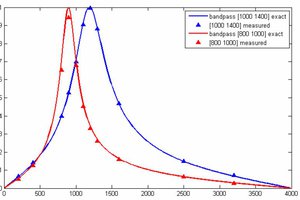
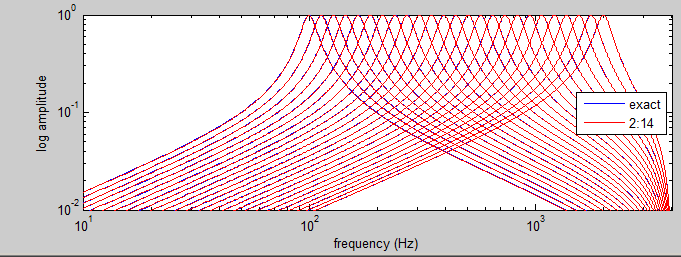
A set of 25, 2-pole, Butterworth, digital filters designed in matlab were converted into GCC using fixed point 2:14 format (14 bit fraction).
The filter responses are shown below.
A GCC header file transfers the coefficients from matlab to the GCC program. The GCC program
runs a thread to update the display every 12 milliseconds. One vertical line of intensities is drawn at every update.
The filter responses are computed at every sample time, then each
filter output is averaged over about 8 mSec with an absolute value and a
low pass filter.
The sample rate is 8 KHz in this code, but could be faster.
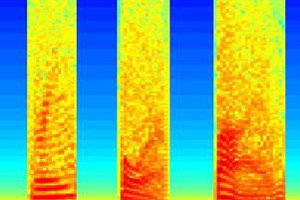
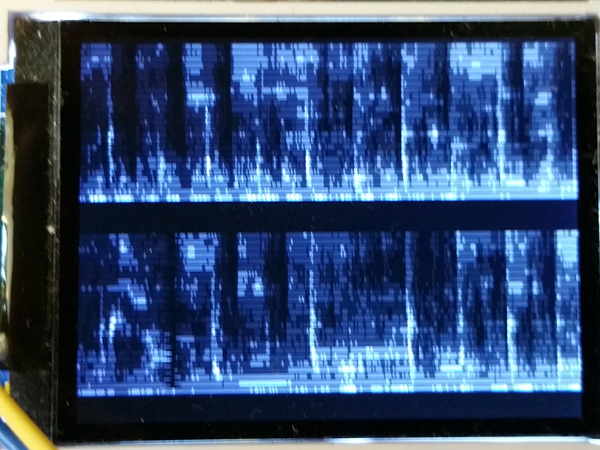
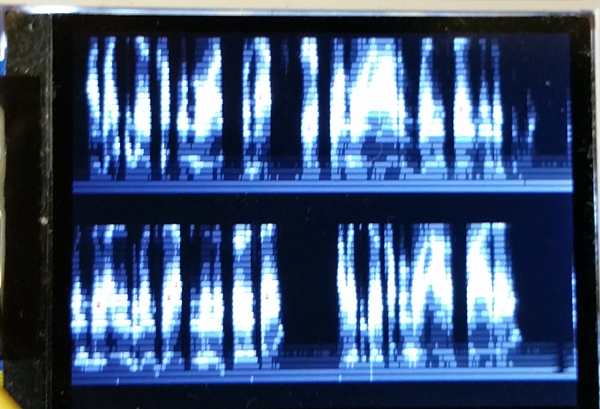
The images below show spectrographs of "Smoke on the water" first, then a voice sample.
Frequency (actually log(freq)) is on the vertical axis, time on the
horizontal axis and loud frequencies are brighter. Time flows across
the top, then the bottom, then back to the top.
A modification of the timer ISR allows for nonlinear low pass filtering of the
bandpass outputs. If the band pass output is louder than the
current low pass output for that filter, then the input is just copied
to the output. This allows for fast transients to be recorded.
Code. ZIP of project. Pressing zero on the keypad selects linear mode, pressing one selects fast transient, nonlinear mode.