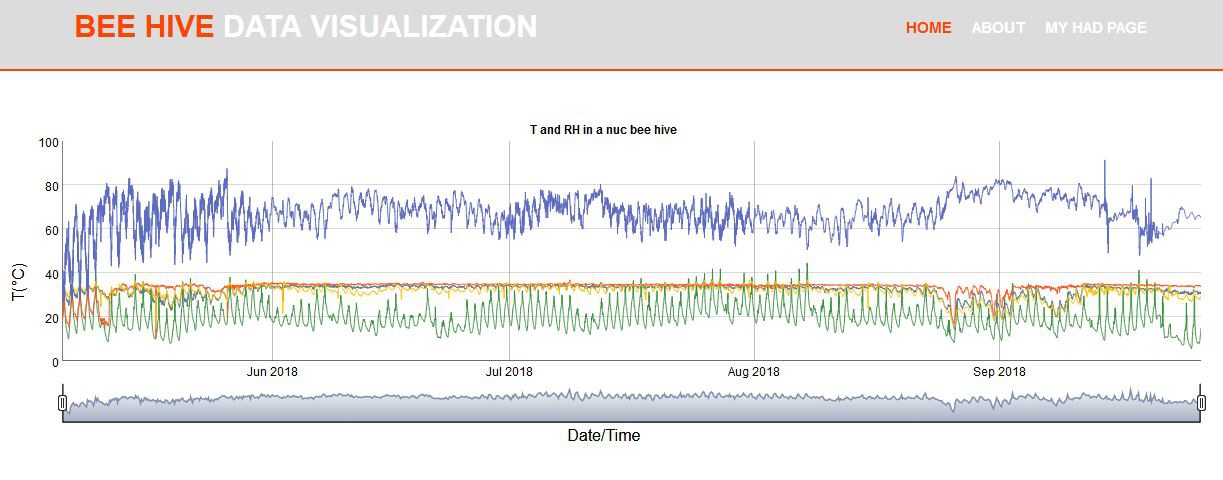
Today I sat down and did my first steps in html/css. My aim was to not publish pre-rendered graphs anymore but to just append new data to a csv-file and let the browser render it for me. It even is kind of interactive!

I set up a quick github page and got it working pretty quickly. It's just noch finished yet, but it basically does what I want.
Updates coming!
 Jan
Jan
Discussions
Become a Hackaday.io Member
Create an account to leave a comment. Already have an account? Log In.