 Jan
JanUpdate 22.02.2019 - back to "spring mode"
Bees just "dissolved" their winter cluster and went back to 5 or 6 combs to care for their brood etc. See Update from February 2nd to see the difference!
Update 21.02.2019 - Bees are having brood again!
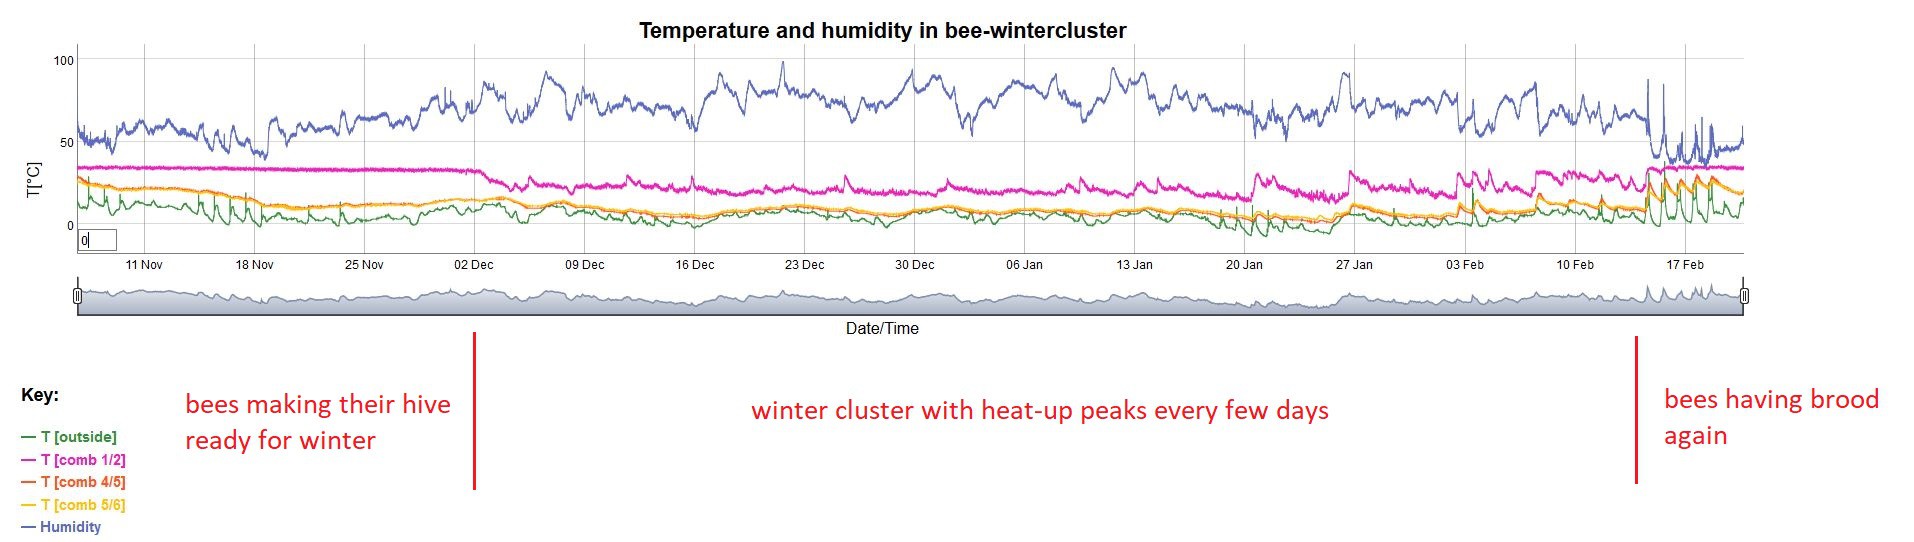
The data was in before we looked into the hive and it made one thing clear: The queen started laying eggs again. The pink curve is all straight again with an average of about 34°C, which is the optimum for the brood.
The green peaks are sunlight on the outside sensor. The last few days were like early spring, so the bees went out, cleaning the hive and collecting water and pollen!
They started caring about the other "alleys" too, which can be seen by the rising temperatures of the orange and yellow charts.
Data at www.inhivedatalogging.com now with an rolling average (bottom left corner). The number means: show the average over xx timesteps (which are 5 minutes here). So a "30" averages/smoothens the data by averaging over 30x5 minutes...
Update 02.02.2019 - Position of the winter cluster.
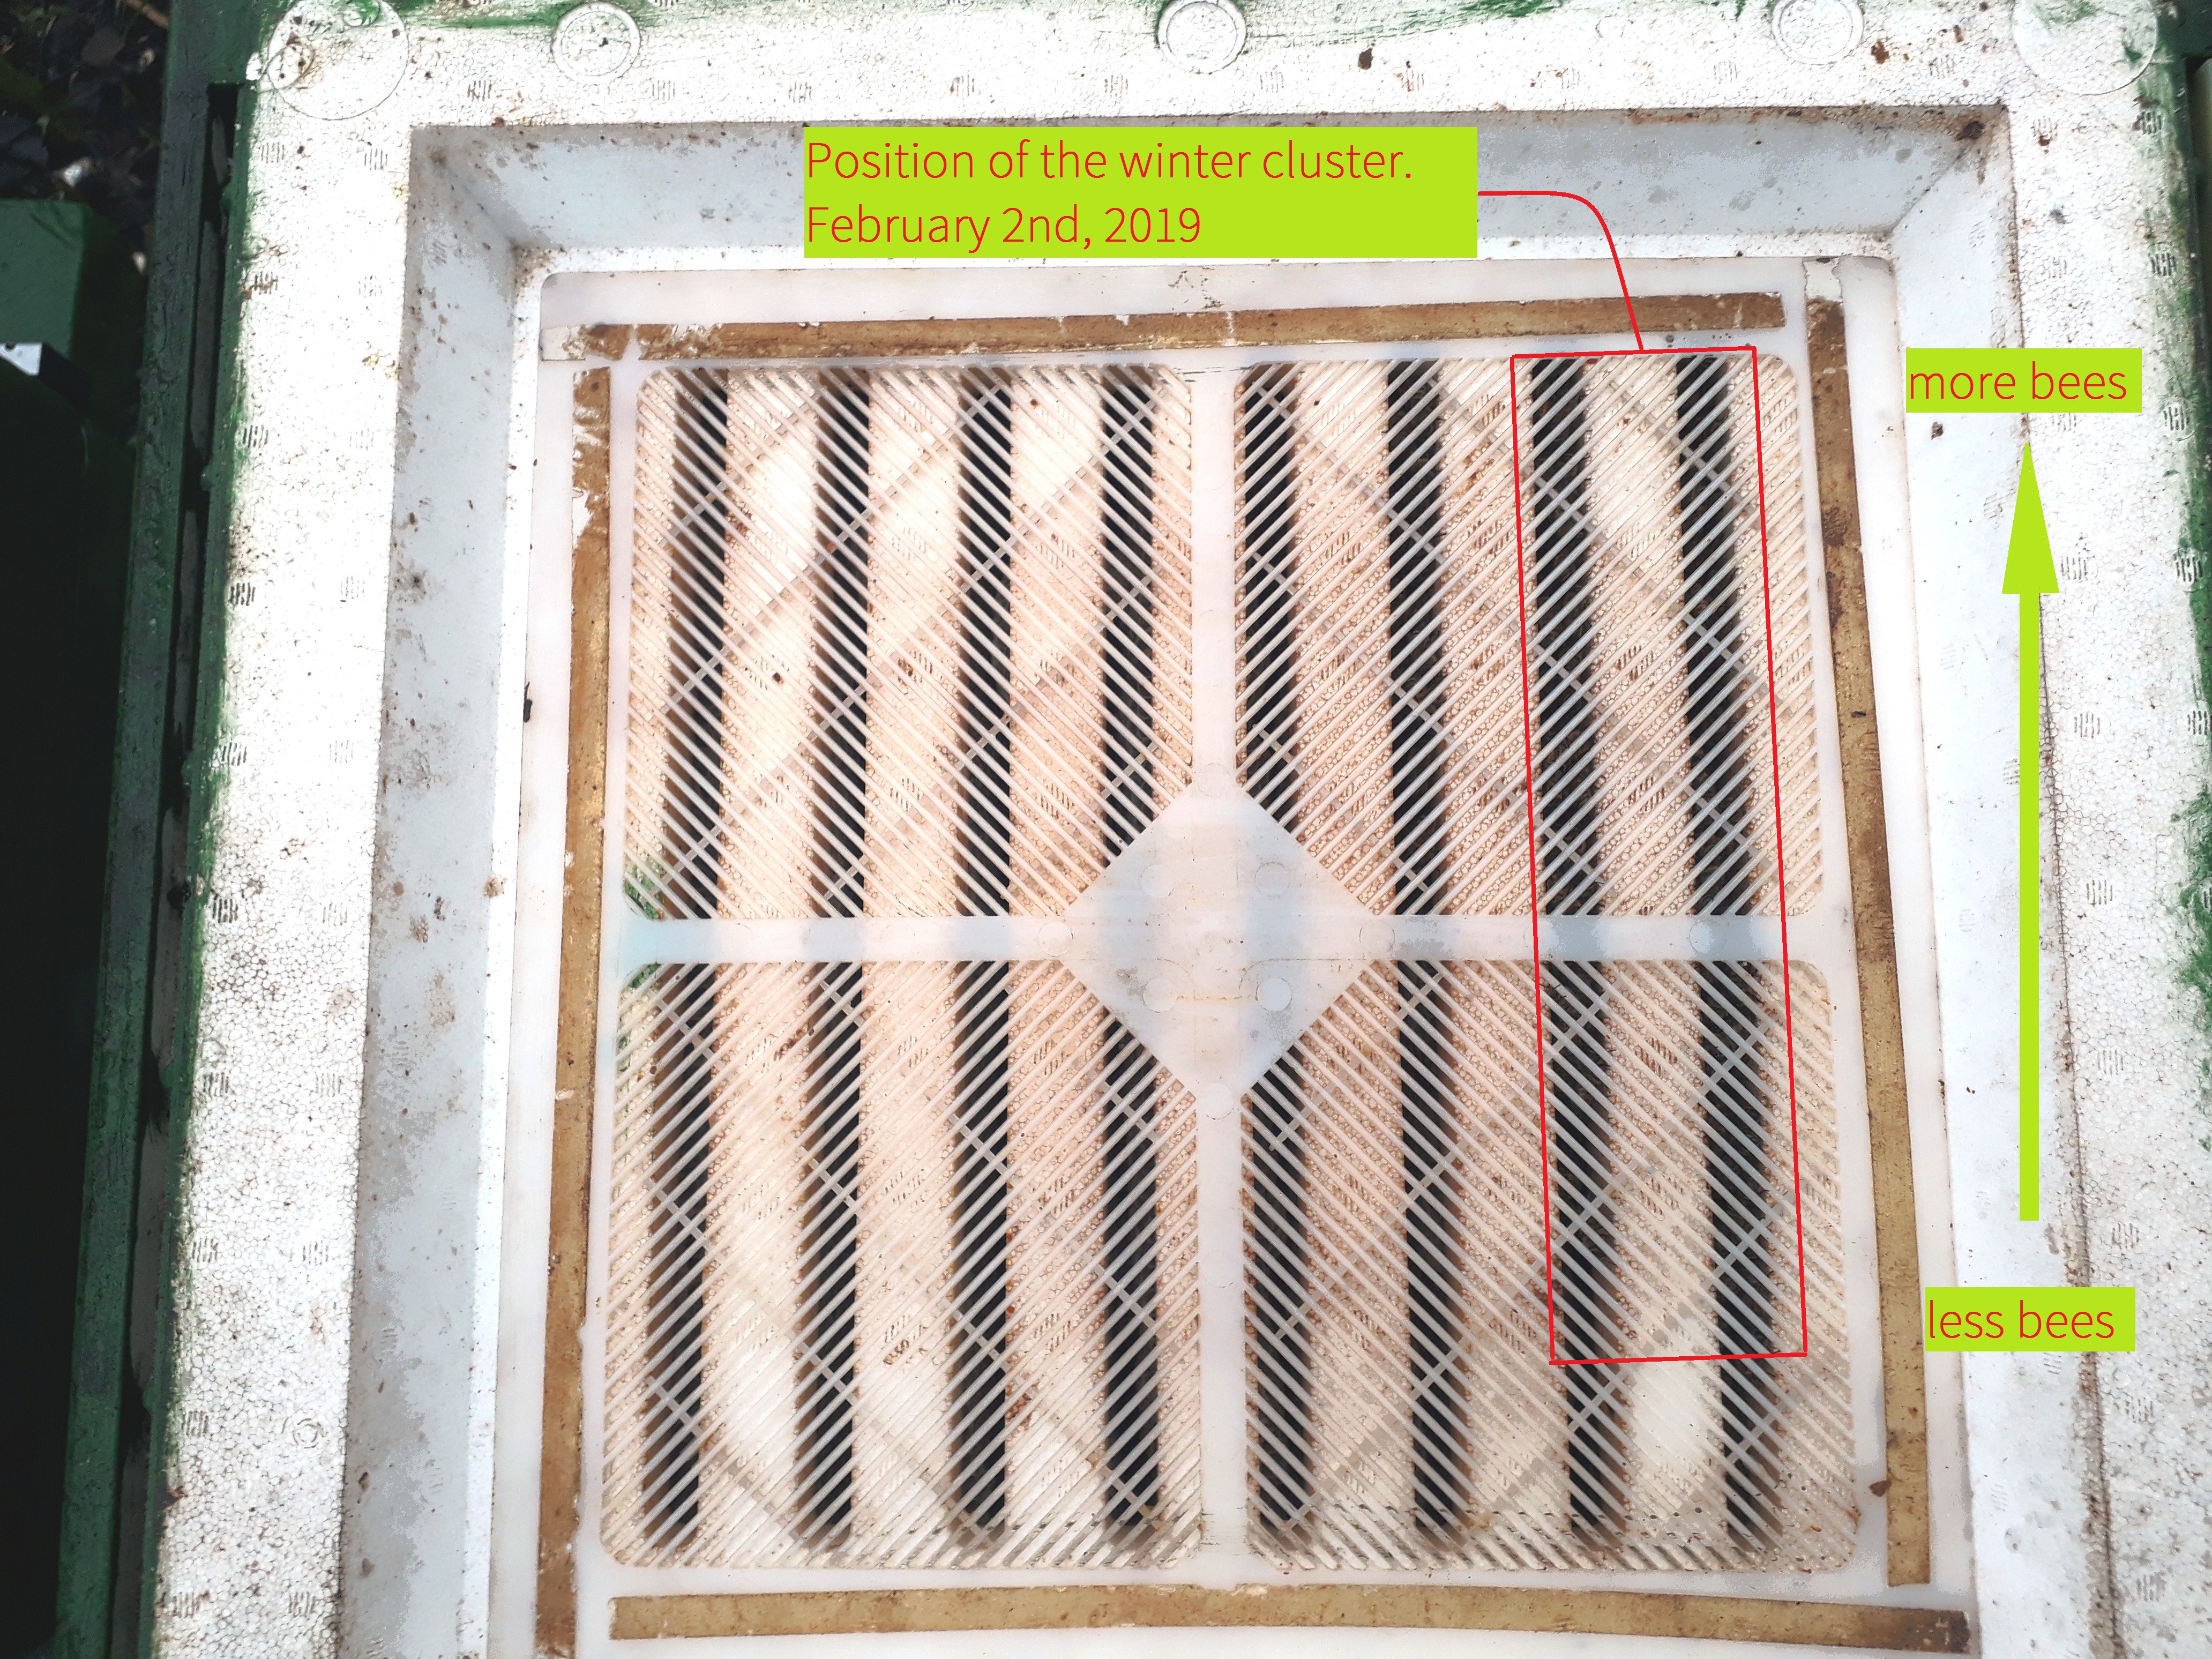
The pic shows where the bees are in the hive right now. Position hasn't changes much from the beginning, they're still cuddling in the back right corner of the box (standing in front of the box).
Measured data backs the position and it's good to see them alive and buzzing!
---------- more ----------
Update 25.01.2019
Collecting the data from the winter cluster is really fascinating! You can scroll and zoom through the data here! There are interesting things going on (see below for sensor position to grasp, what's going on where in the hive).
First thing to mention is the spikes in the outside temperature, marked CYAN: Those boggled my mind a lot as they always appear around noon. Around 11:30 in November, around 12:30 in January.
Those are caused by the sun, hitting the hive around that time. The case lid is clear, the stuff inside mostly black. That's where the spike comes from.
Second, around Dec. 2, marked YELLOW: The hive temperature stopped being a constant 32 to 33°C and started to fluctuate a lot.

Third thing and this really blows me away, though it's known for decades now. The spikes in Comb1/2, marked RED, are what I wanted to see first person with my bees: The bees try to keep their cluster around 20 to 24°C most of the time, but on a regular basis, they start moving their muscles, heating up and reaching a pretty comfortable 30°C very quickly. Temperature goes down as quickly as it reached the maximum though.
Other interesting facts: They don't heat the rest of the hive. T3/T4 are close to the outside temperature, though the chart is a bit dampened and doesn't reach the minimum outside temperatures.
-7°C was the coldest night so far and they're still pretty vital, YAY!
Update 01.12.2018
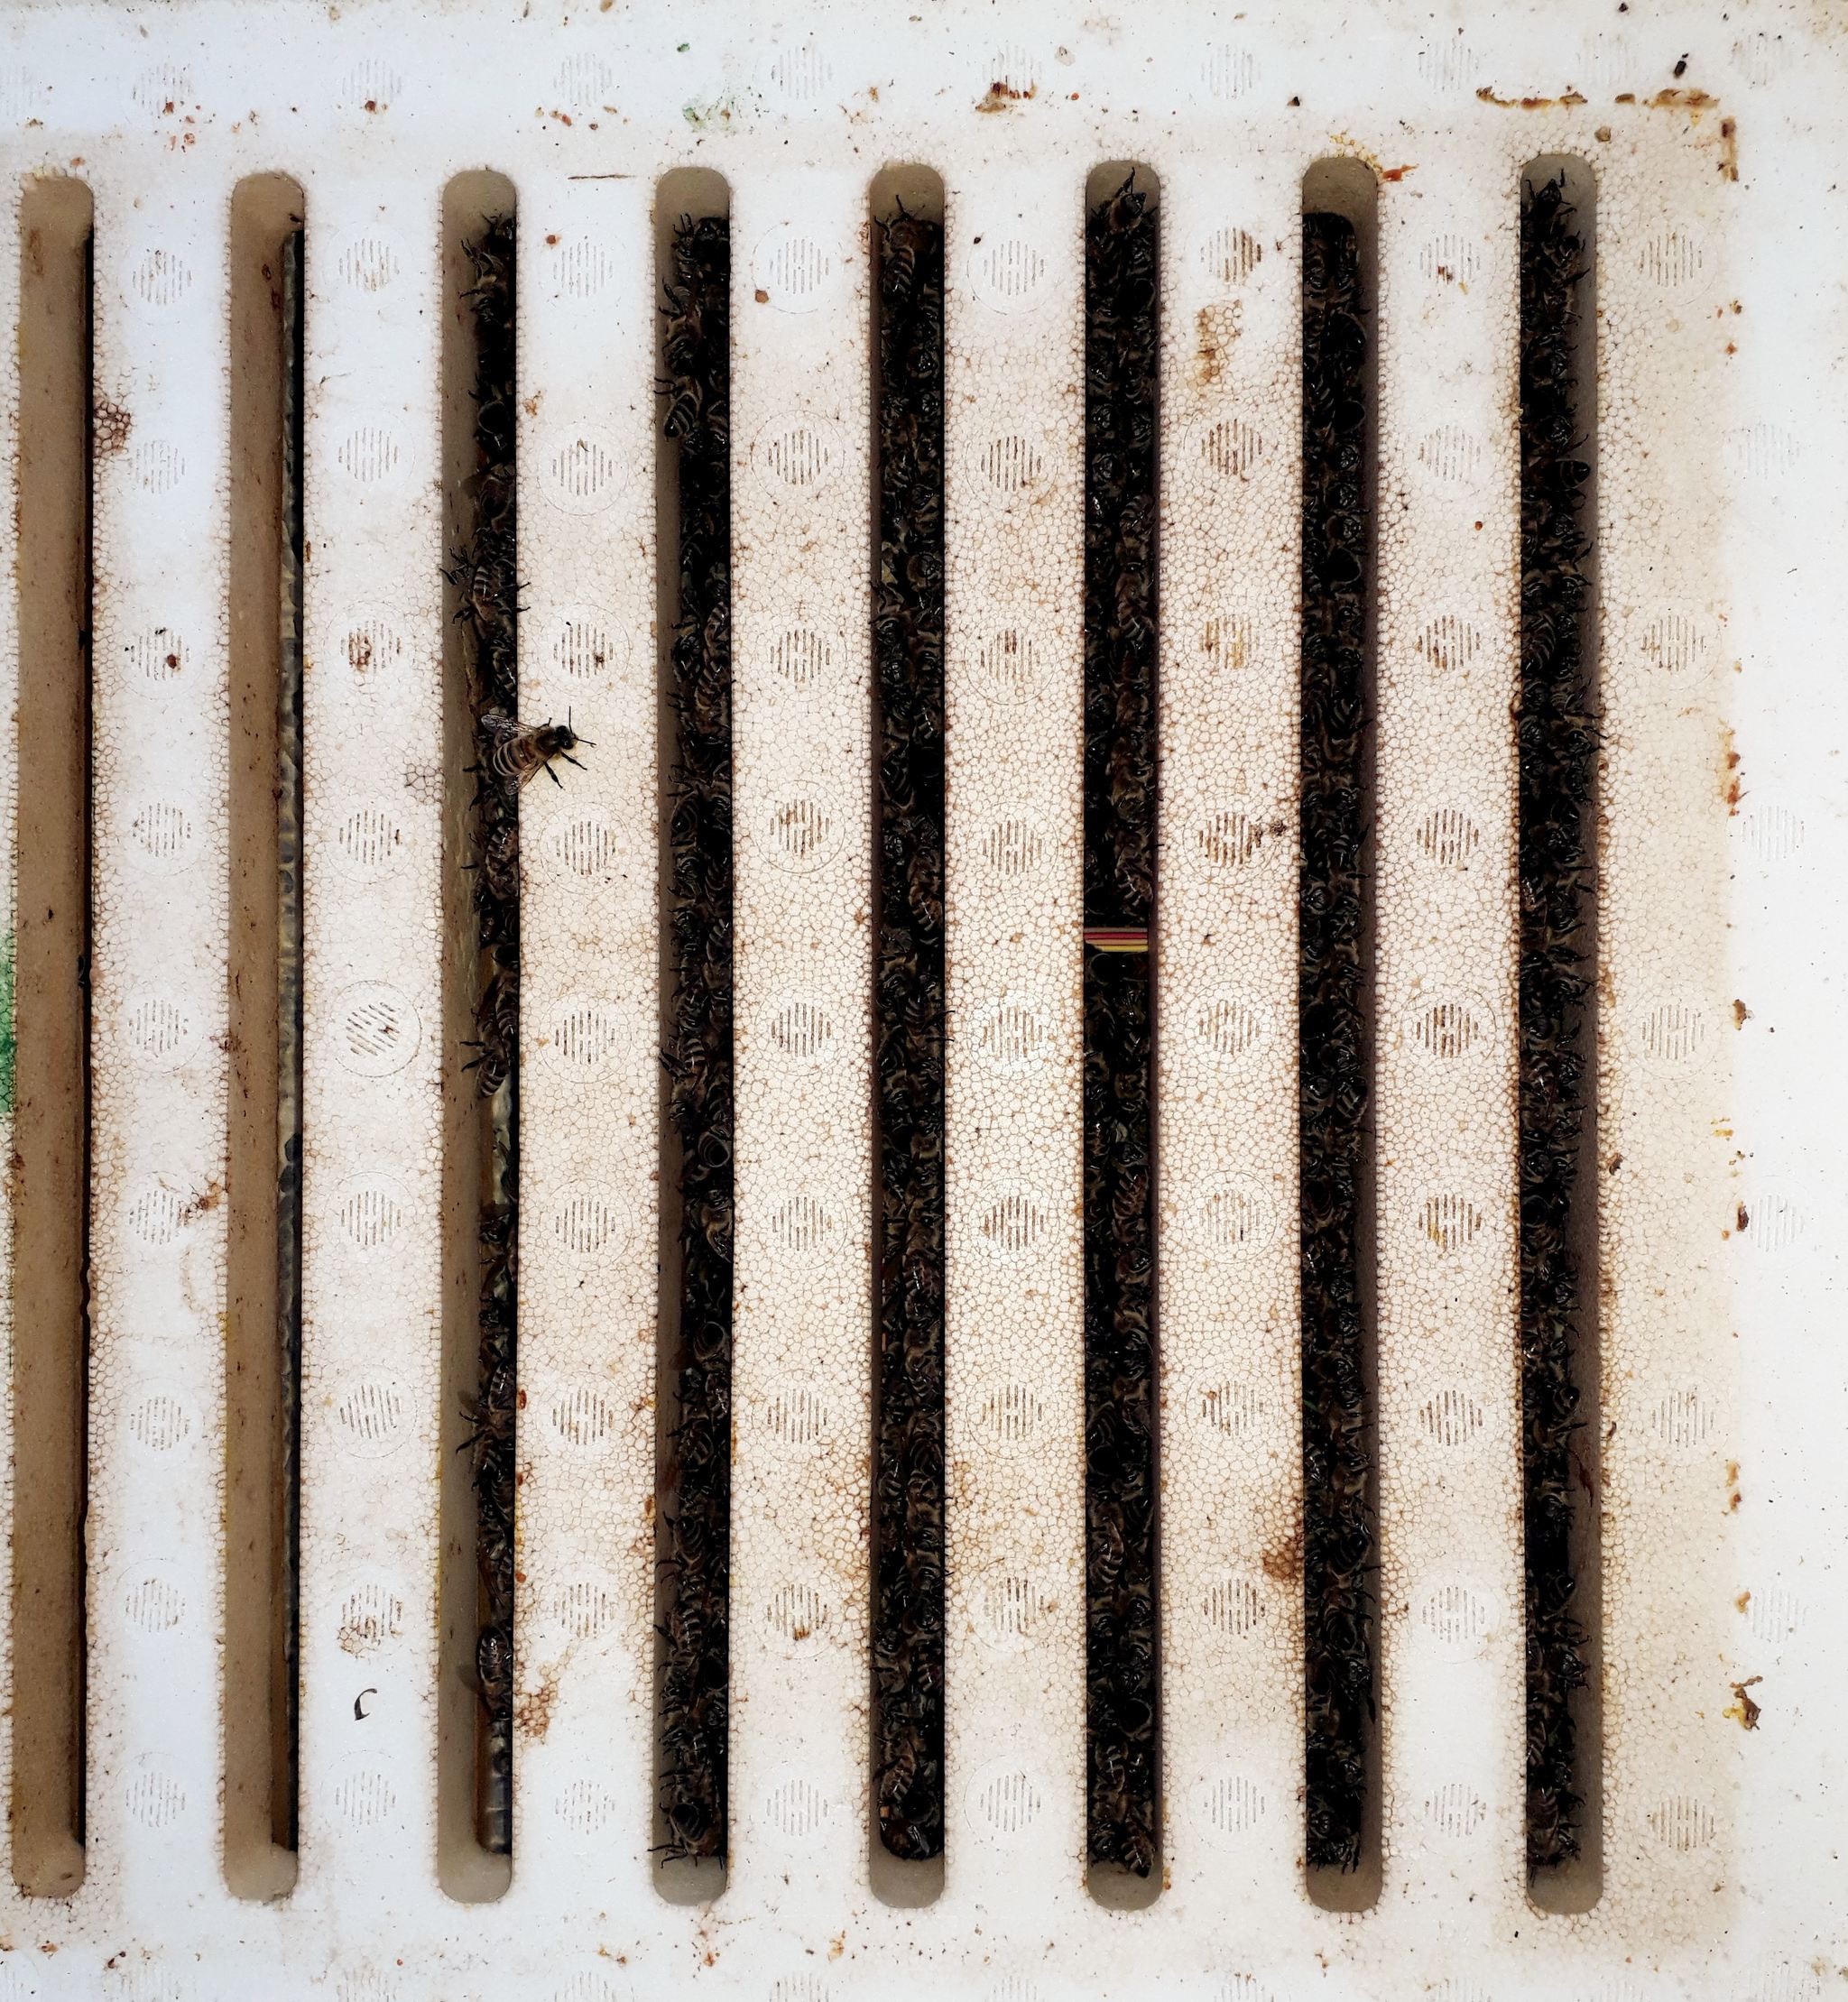
Just a quick picture to show you that you can easily see where the bees are in a hive, without opening the box or reading sensor data:
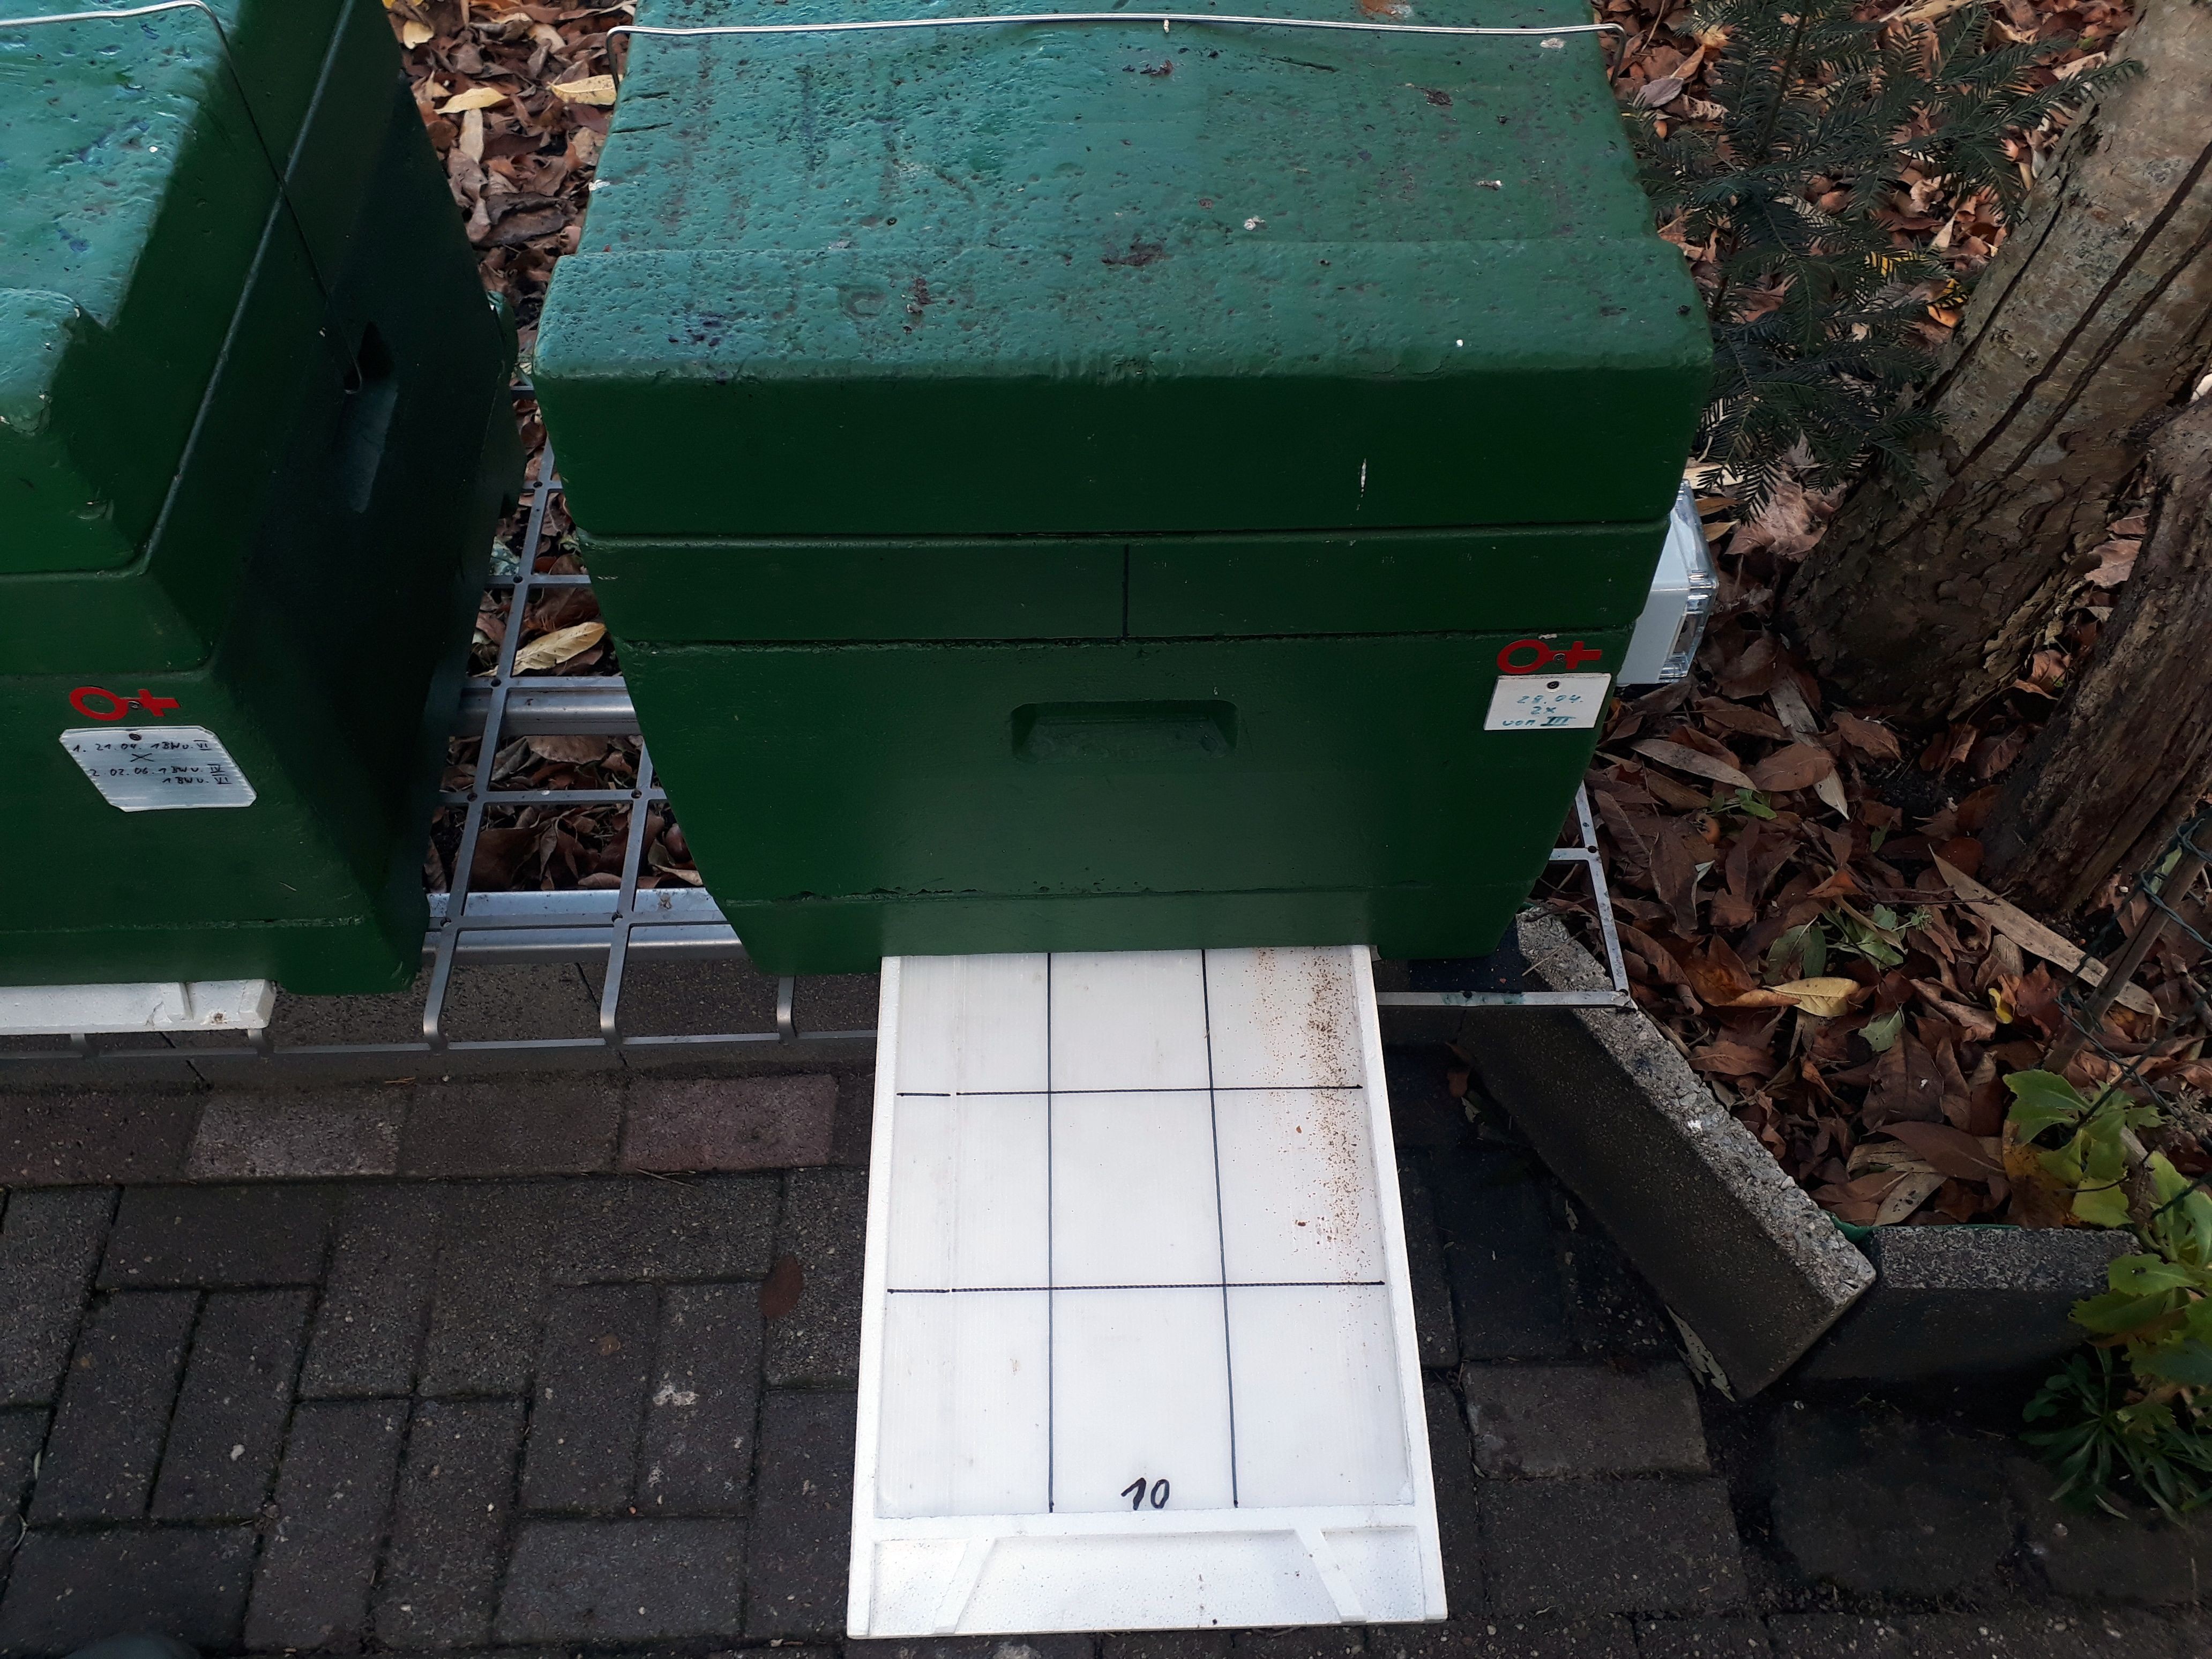
Where there's stuff on the white board there are bees above in the combs :)
The bees already went to one corner/side inside the hive. They do this when weather gets colder to keep each other and a bit of food warm. This is called the winter cluster. Temperatures are quite warm for November, but the full cluster will soon assemble when outside temperature drops much more.
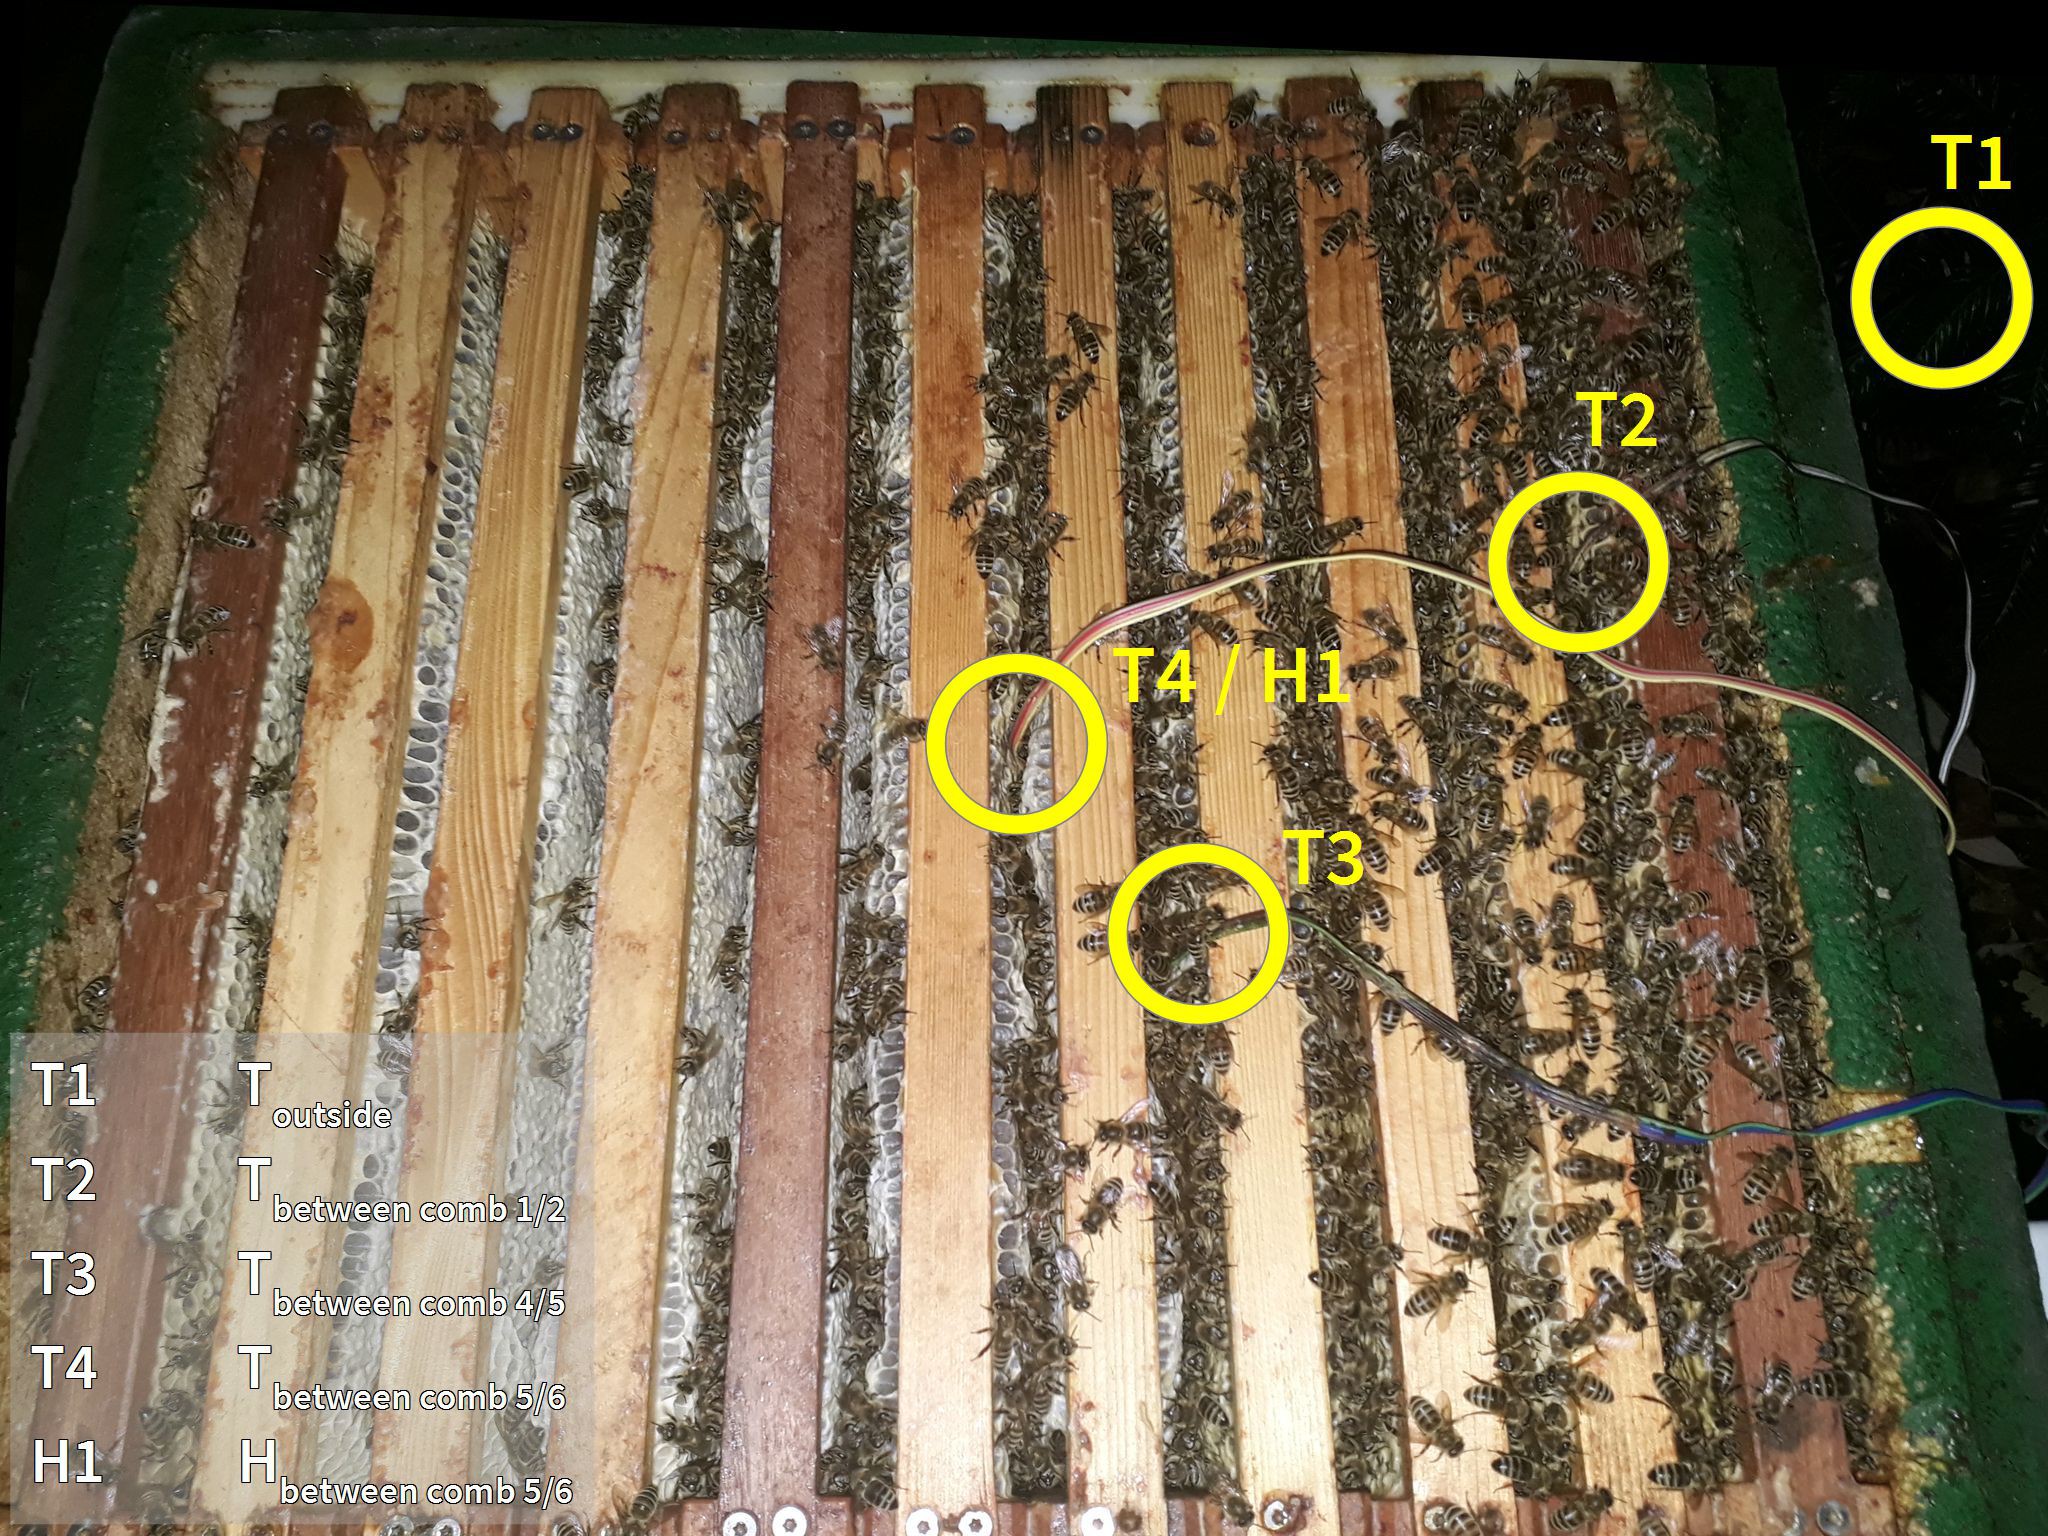
The picture shows where I put my sensors for winter logging plus a quick key in the lower left corner.
I hope to record the typical behavior of the bees in winter, which is a periodical active heating of the cluster with a following phase of doing not much at all while letting the temperature drop again.
When they used all their food on the rightmost combs, they will move their cluster more to the left. They gradually warm their honey to be able to get it out of their cells and consume it. I think the data will clearly show this next year.
Logging interval is every 5 minutes, logging started November, 6th, 2018 at 17:05.
Sensors: T1 to T3 DS18B20, T4 Si7051, H1 Si7051.
Discussions
Become a Hackaday.io Member
Create an account to leave a comment. Already have an account? Log In.