 David Scholten
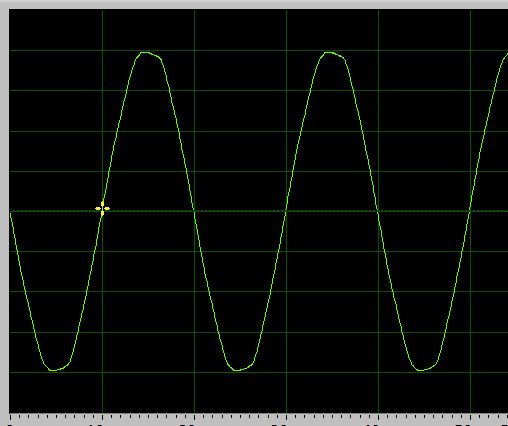
Here we have a waveform:
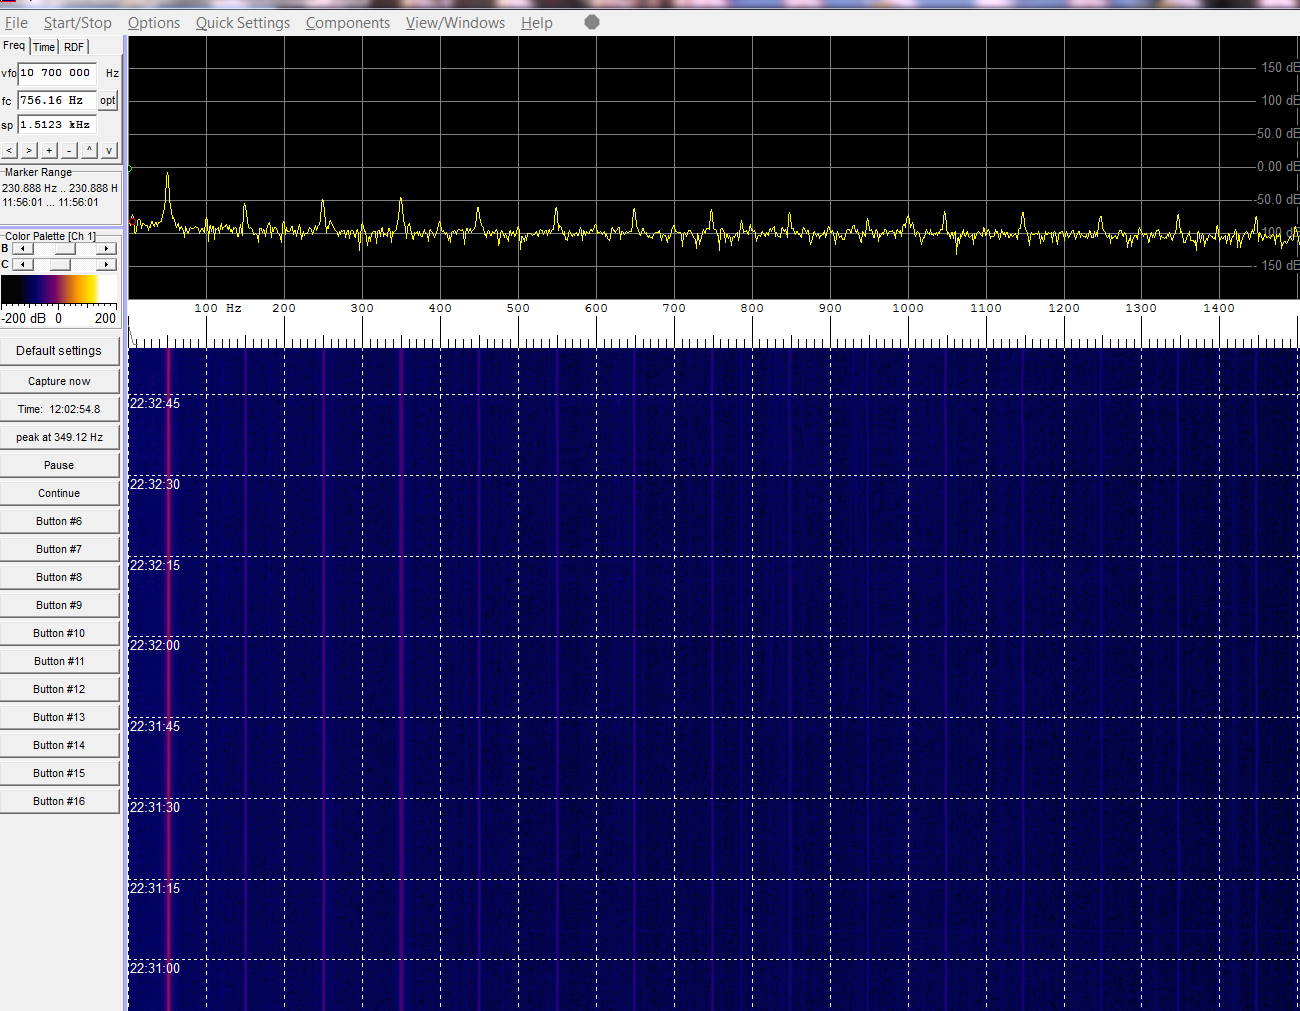
 And a spectrograph:
Finally, a plot of the RMS voltage (ignore the magnitude) at the top and the frequency at the bottom:
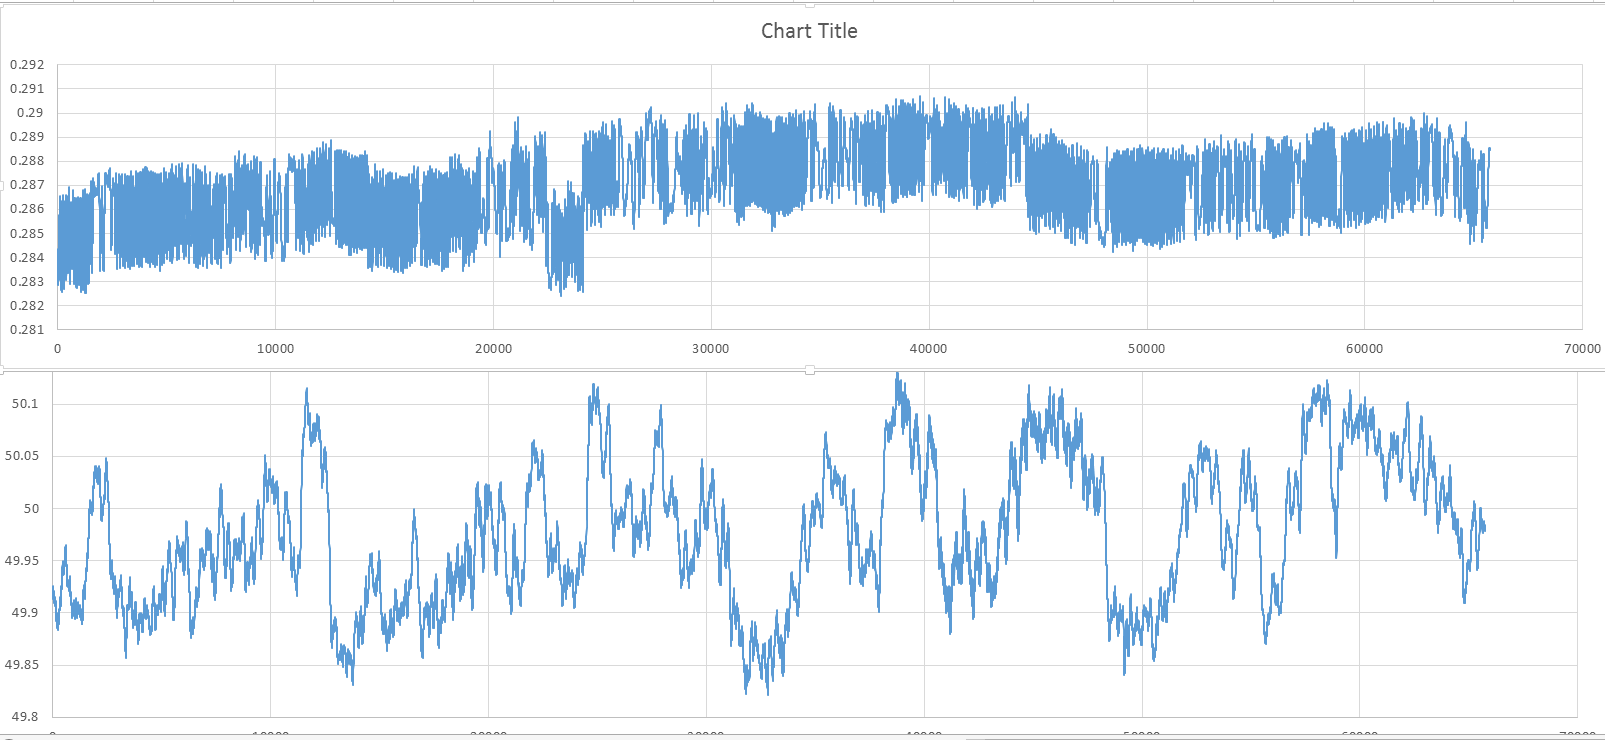 This was taken over a two hour period (8:10pm - 10.00pm) on a Saturday night in Adelaide. Although the voltage magnitude is nonsensical, the proportional values are very relevant. The frequency plot, however, is correct is it's measurements.
 We can start to see some patterns emerging, such as a some sort of overall frequency governing control loop that operates with an approximate 49.9-50.1Hz hysteresis range across the network. This may just be a coincidence. Another theory is that as these dips seem to occur in half-hour intervals, which would coincide with the starts and stops of TV programming. I'll need to do a longer run and check the TV guide for what's on. Next I need to print the new case that will allow the board to run cooler - It heated up significantly during this run and I wouldn't leave it unattended at this point.
The 12 hour print starts tomorrow morning!
Discussions
Become a Hackaday.io Member
Create an account to leave a comment. Already have an account? Log In.