 David Scholten
Finally having some success with the FFTs through MATLAB. Most of the difficulty was tuning the visual display and colour chart to display anything of interest (and then waiting for something to happen to test a configuration of display variables). A very frustrating process.
I initially had some success plotting a waterfall using only the harmonics from the "thd" function, but I quickly realised this, when exported to an array, only includes the actual harmonics (i.e. 100, 150, 200, 250Hz, etc) and not the other frequencies in between.
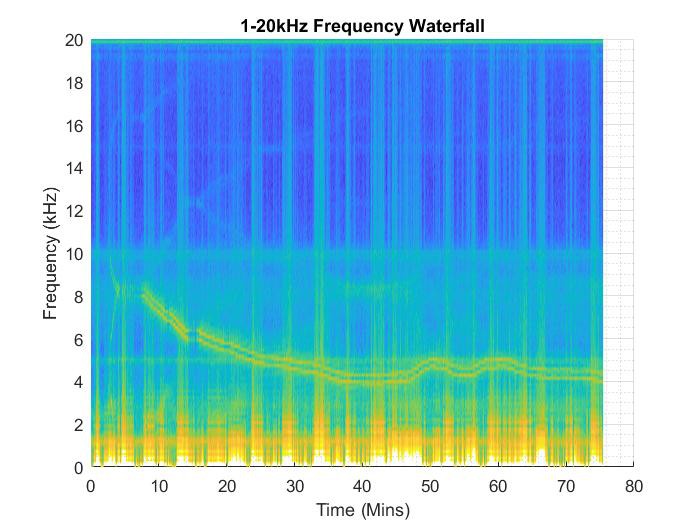
Now, using the FFT library and some guides (with only a moderate understanding of the process), I have produced the following, which captures the weird signal (along with some other faint ones):
Now as with everything with MATLAB, there are some hidden conveniences! I can rotate the plot into 3D:
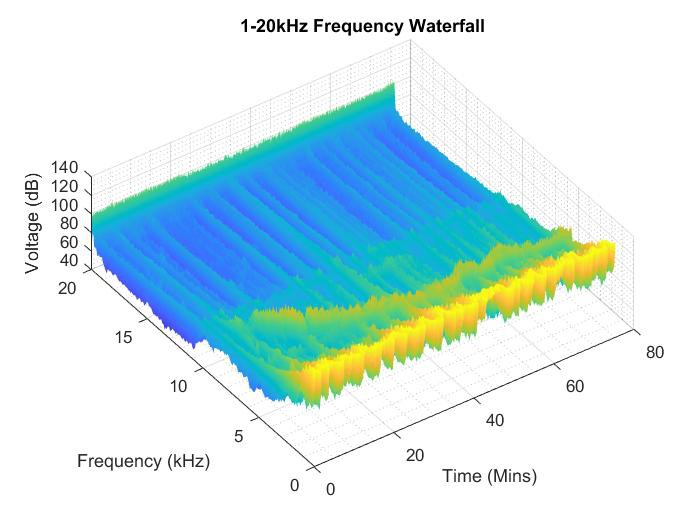
Just ignore the magnitude of the voltage though, I do not trust that it is scaled correctly!
Soon I'll match these plots up with the Vrms, THD and frequency plots to try and see what is triggering these signals (i.e. are they grid distribution control signals or just harmonics from something?).
EDIT:
Here are some more!

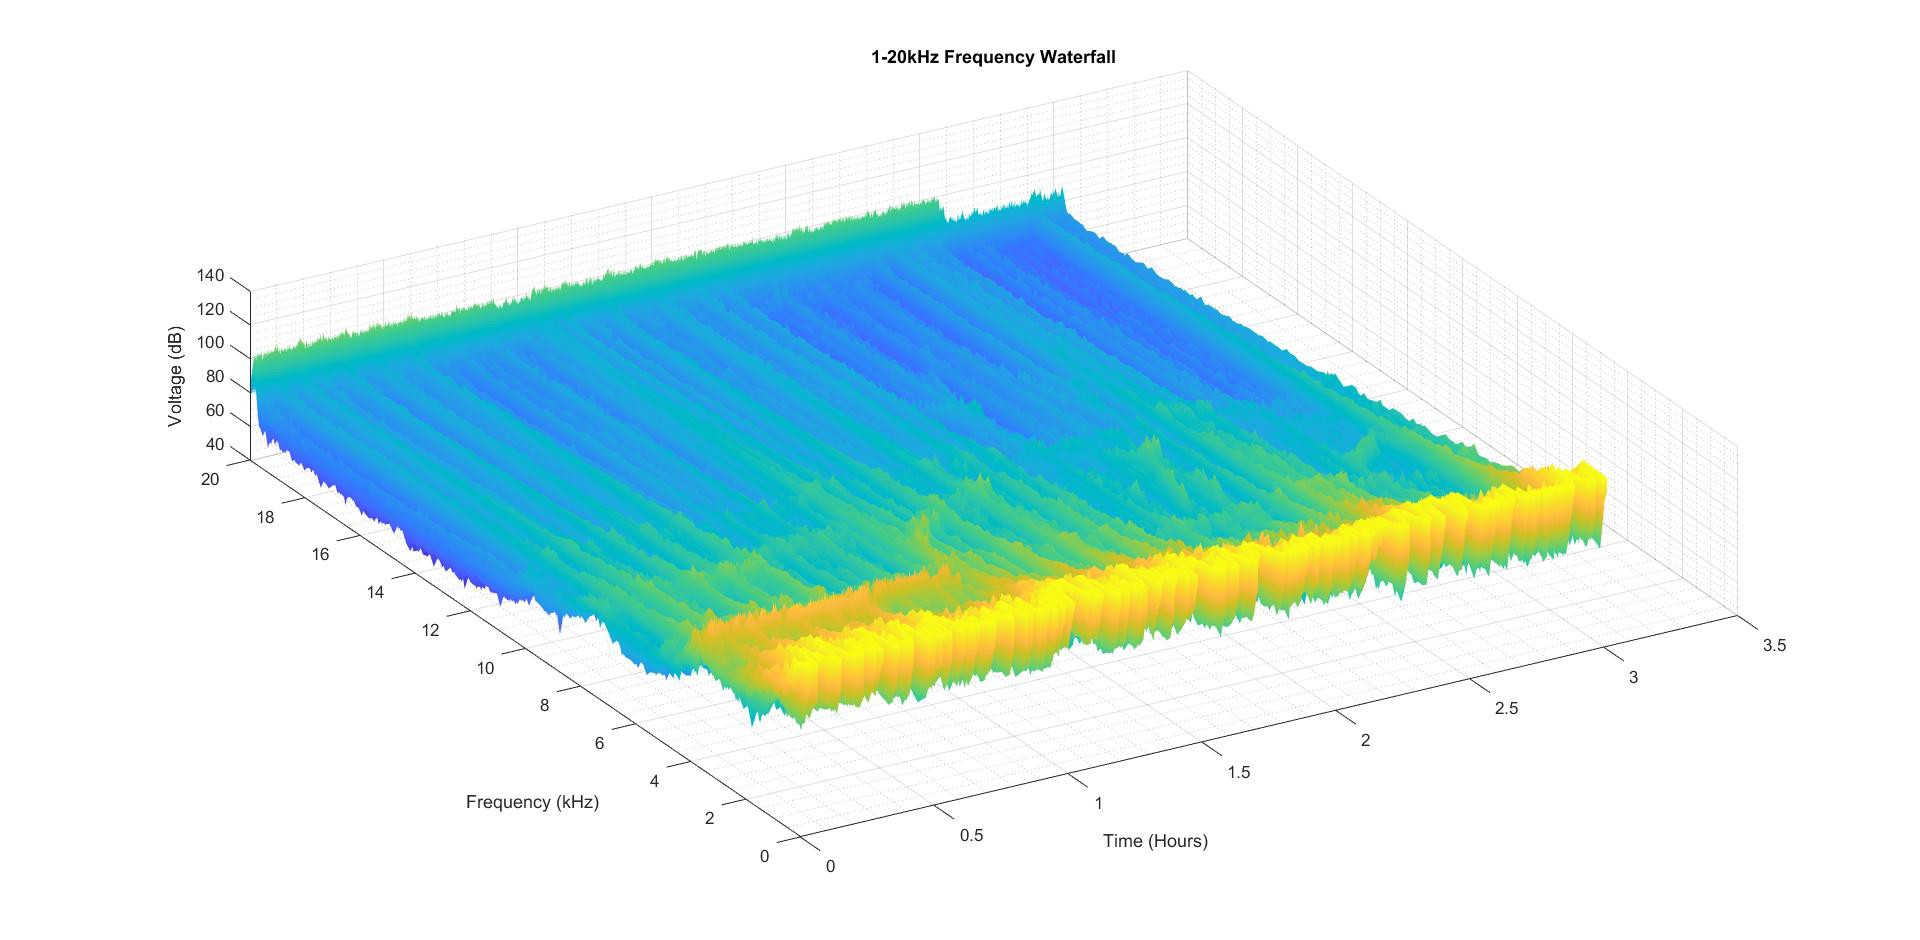
I'll just stick to the 2D view from now on as the 3D seems a bit useless (I really nailed the colour map tuning - go team me).
Discussions
Become a Hackaday.io Member
Create an account to leave a comment. Already have an account? Log In.