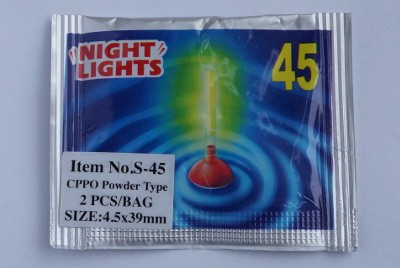
Glow sticks contain a diphenyl oxalate, hydrogen peroxide and a fluorophore, and a solvent of course.
The general reaction between diphenyl oxalate and hydrogen peroxide is:

The square shaped product 1,2-dioxetandione is not stable and immediately breaks down to CO₂:

This CO₂ is produced in an excited state and will immediately relax by emitting a photon in the UV-range:
The photon excites the fluorophore:
which remits a photon in the visible spectrum:
It's the fluorophore's emission spectrum that determines the colour of the glow stick.
In this procedure I'm using glow sticks for night fishing:

Each glow stick contains a glass ampoule with ca. 70mg of this particular diphenyl oxalate (R is pentyl):

and a fluorophor that could well be fluorescein.
The glass ampoule is surrounded by a viscous liquid that my IR-spectrometer identified as dibutyl phthalate. The phthalate contains enough H₂O₂ that my fingers turned snow-white after brief exposure to it.
Experimental:
A glow stick was carefully cut open with a scalpel and the glass ampoule was removed and placed in a beaker and rinsed with acetone. The clean ampoule was broken in a new beaker and the content dissolved in a few mL ethyl acetate. The solution was transferred to a 10 mL volumetric flask, which was filled to the mark with ethyl acetate.
Hydrogen peroxide (10 mL, 35%) was mixed with 30 mL ethyl acetate. After 2 min. of vigorous stirring the two-phase system was transferred to a separating funnel and the ethyl acetate was collected in a 50 mL conical flask. This yielded a solution of H₂O₂ in ethyl acetate with a concentration of app 2M (measured by titrating 200 µL of the solution in 10 mL 1M H₂SO₄ with 0,020M KMnO₄).
1.5 mL of the diphenyl oxalate solution was placed in the spectroscopic cell, after which 1.5 mL of the H₂O₂ solution was added and the measurements immediately started (integration time 2000 µs, measuring frequency 1 Hz, measuring time 50 s).

One will have to fiddle a bit with concentrations, integration time etc to get proper data, but worst of all also the base line.
 esben rossel
Discussions
Become a Hackaday.io Member
Create an account to leave a comment. Already have an account? Log In.