 Yann Guidon / YGDES
Back to the workshop for the revenge of the return of the son of the Vintage Ring Oscillator !
This time with a new ally : the ceramic capacitor !
But the V/F curve might look different from @Tim 's experiments...
As usual, give me some time to dump and analyse all the yummy data, come back often on this page ;-)
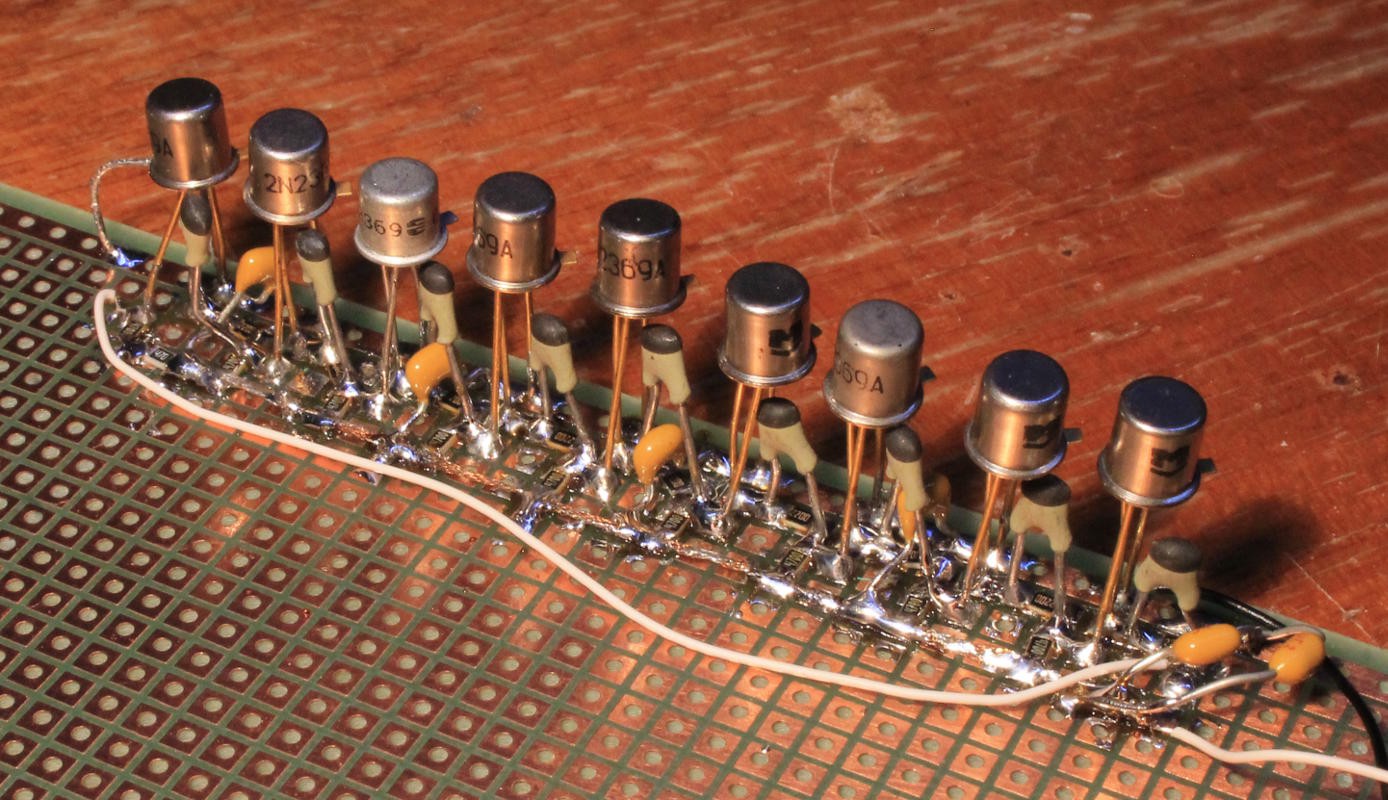
Ring oscillator with 9 levels of low-grade 2369 (according to their hFE).
Rb = 220, Rc = 470, like before.
1nF to decouple a pair of transistors.
But this time I add more capacitors : 100nF on the power input and 27pF to short each base resistor ! As usual, it's a step by step modification to help with understanding the effect of every change.
From the beginning, starting at about 10MHz, I saw the incremental increase of frequency : about 500KHz for each capacitor I added. I tested very often because I didn't want to spend any time spotting soldering error.
After a while I had the 9 capacitors wired and *bim* 16MHz without effort !
Some tuning later, a lot of blowing, and the best frequency I got was 16.8MHz !
That's at least 50% better than without the capacitors.
16.81MHz at 2.45V !
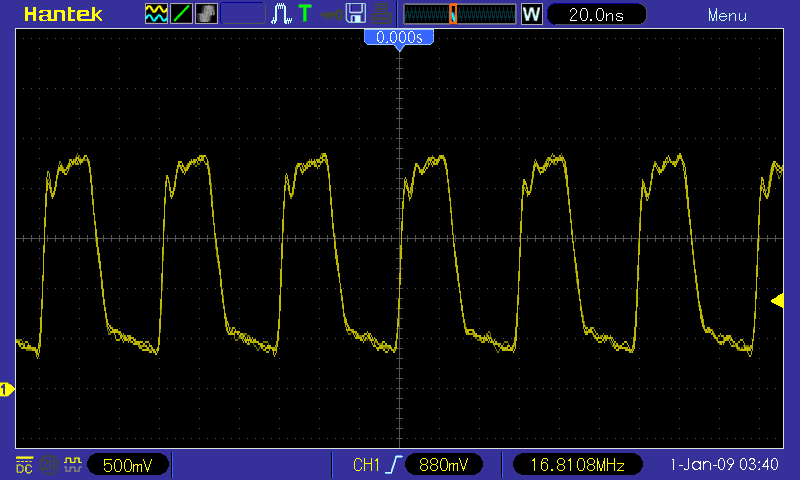
(yes I know the date is wrong)
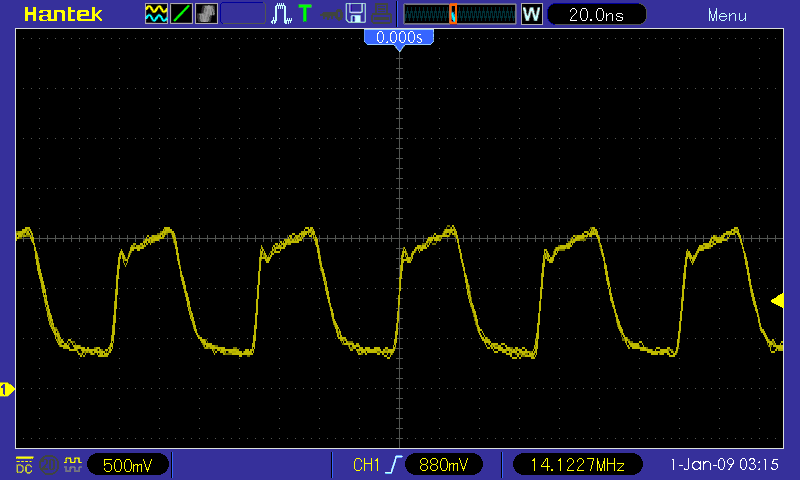
15M81Hz @ 2V : near the sweet spot...

14MHz@1.5V only :-) still nice looking...
Here is the V/F curve data:
 V     mA      MHz
1      10      9.15
1.1    14     10.22
1.2    16     11.90
1.3    20     12.78
1.4    23     13.52
1.5    25     14.12
1.6    28     14.63
1.7    31     15.02
1.8    34     15.35
1.9    36     15.62
2      40     15.85
2.1    41     16.13
2.2    45     16.35
2.3    48     16.53
2.4    50     16.62
2.5    54     16.65
2.6    56     16.51
2.7    59     16.41
2.8    63     16.32
2.9    65     16.24
3      69     16.15
3.1    72     16.09
3.2    74     16.05
3.3    78     16.02
3.4    81     16.00
3.5    83     15.98
3.6    87     15.96
3.7    89     15.94
3.8    93     15.93
3.9    96     15.93
4      99     15.93
I made more points because I want to plot a better curve than the previous one.
More precision is hard because it's temperature sensitive and the can is connected to the collector so it must radiate quite a lot of HF...
The 16MHz region spans from 2.06V to 3.3V and then the curve is mostly flat.
The peak frequency moved to 2.45V : still not far from 2V.
16.8MHz amounts to 3.3ns per inverter, down from 5.5ns with just a capacitor.
Beware however !
- 27pF is just a random value in the drawer : more tests are needed to estimate and choose the best value. So it's still not optimal.
- This is very sensitive to the load ! the frequency drops quickly when it is loaded.
- Temperature affects the speed by a few %.
- No clamp diode yet... later :-)
The power/frequency curve is clearly changed as well and this is where it's the most interesting :-D
 V    mA    MHz      mW     mW/MHz   delta
1     10    9.15     10      1.092
1.1   14   10.22     15.4    1.507   0.415
1.2   16   11.90     19.2    1.613   0.106
1.3   20   12.78     26      2.034   0.421
1.4   23   13.52     32.2    2.381   0.347
1.5   25   14.12     37.5    2.655   0.274
1.6   28   14.63     44.8    3.062   0.407
1.7   31   15.02     52.7    3.508   0.446
1.8   34   15.35     61.2    3.986   0.478
1.9   36   15.62     68.4    4.379   0.393
2     40   15.85     80      5.047   0.668
2.1   41   16.13     86.1    5.337   0.29
2.2   45   16.35     99      6.055   0.718
2.3   48   16.53    110.4    6.678   0.623
2.4   50   16.62    120      7.220   0.542
2.5   54   16.65    135      8.108   0.888
2.6   56   16.51    145.6    8.818   0.71
2.7   59   16.41    159.3    9.707   0.889
2.8   63   16.32    176.4   10.808   1.101
2.9   65   16.24    188.5   11.607   0.799
3     69   16.15    207     12.817   1.21
3.1   72   16.09    223.2   13.871   1.054
3.2   74   16.05    236.8   14.753   0.882
3.3   78   16.02    257.4   16.067   1.314
3.4   81   16.00    275.4   17.212   1.145
3.5   83   15.98    290.5   18.178   0.966
3.6   87   15.96    313.2   19.624   1.446
3.7   89   15.94    329.3   20.658   1.034
3.8   93   15.93    353.4   22.184   1.526
3.9   96   15.93    374.4   23.502   1.318
4     99   15.93    396     24.858   1.356
The power estimate is not very precise because the integrated ampere-meter has only so many digits... The delta column has some "noise" in it but this is useful anyway !
Gnuplotting gives nice results, sure !
Frequency vs voltage, Current vs voltage curve :
set xlabel 'V'
set ylabel 'MHz'
set y2label 'mA'
set xr [1:4]
set yr [6:18]
set y2r [0:120]
set ytics 1
set y2tics 10
set key left top
plot "27pf.dat" using 1:3 title "Frequency in MHz" w points pt 7,  \
     "27pf.dat" using 1:2 axes x1y2 title "total current in mA" w points pt 7,  \
     "sanscap.dat" using 1:3 title "sans cap Frequency in MHz" w lines, \
     "sanscap.dat" using 1:2 axes x1y2 title "sans cap current in mA" w lines
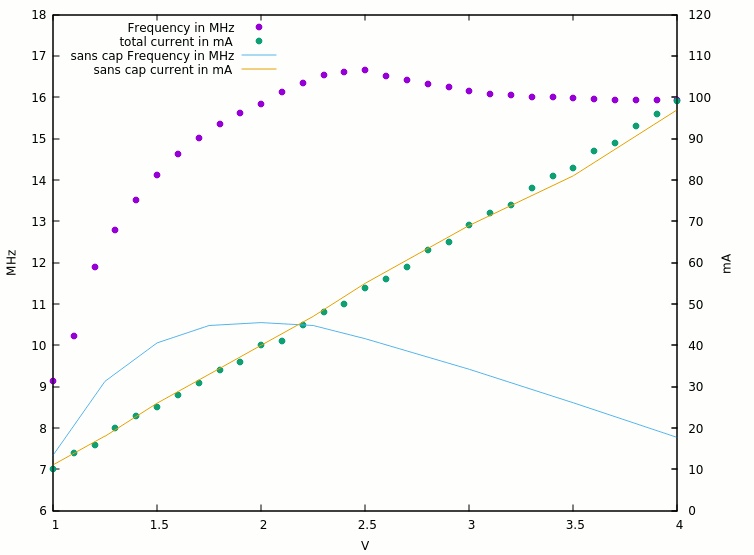
The increase is dramatic, yet the current has not noticeably changed.
The peak is clearly now around the 2.5V point.
Can you believe that even at 1.5V the system works nicely and faster than the previous version ?
Efficiency curve :
set xlabel 'V'
set ylabel 'mW'
set y2label 'mW/MHz'
set xr [1:4]
set yr [0:400]
set y2r [0:25]
set ytics 16
set y2tics 1
set key left top
plot "27pf.dat"    using 1:4           title "total power in mW" w points pt 7,  \
     "27pf.dat"    using 1:5 axes x1y2 title "efficiency mW/MHz" w points pt 7, \
     "sanscap.dat" using 1:4           title "sans cap power in mW" w lines, \
     "sanscap.dat" using 1:5 axes x1y2 title "sans cap mW/MHz"      w lines
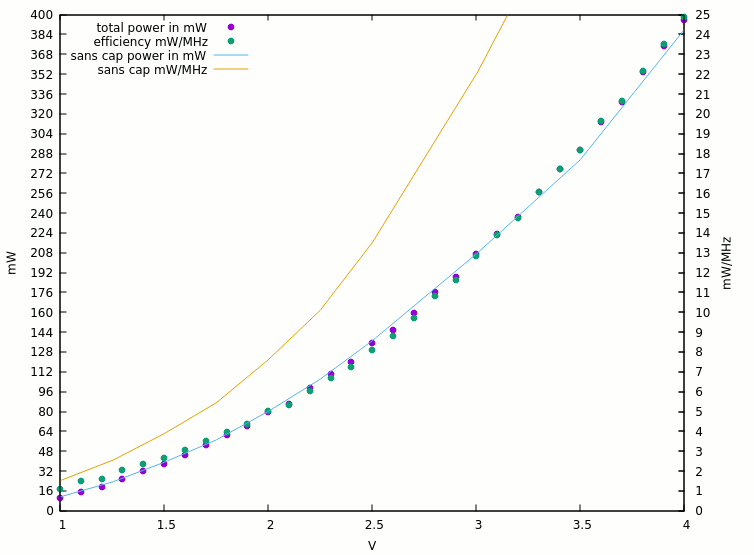
The power curve is very very close but the efficiency is clearly better.
Low voltage RTL FTW !
We'll see if/how more capacitance helps ...
Efficiency slope:
set key left top
plot "27pf.dat"    using 1:6   title "efficiency slope (mW/V/10)" w points pt 7

Not surprising : with a quadratic curve, the slop increases linerarly... but the Vbe effect is felt between 1.5 and 2V.
It's noisy (due to current measurement imprecision) but it's easy to guess that the lower values are more interesting ;-)
Discussions
Become a Hackaday.io Member
Create an account to leave a comment. Already have an account? Log In.