Most IAQ systems that are commercially available are designed to warn users once the measured data passes a certain dangerous limits (for example smoke detectors). However, they don't deliver regular data.
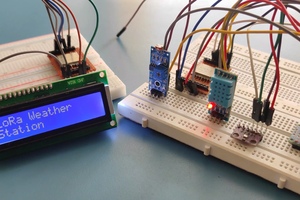
Our goal is to create a wireless indoor air quality monitoring system that measures carbon monoxide (CO), carbon dioxide (CO2), VOC and temperature within our university buildings and communicate the data to the students and staff using those buildings.
This will raise the user's awareness of air quality and possibly trigger actions like opening windows or going outside to take a break and get some fresh air.
 Zymbit
 Manoj kumar
Neat project. You should ping @Radu Motisan--he's got tons of experience working with air quality sensors of various sorts.