 Chris Chung
Parts / Bill of Materials
This is what's needed for this project
- MSP430G2452 (the extra chip from TI Launchpad G2, or any 4K 20 pin MSP430G series MCU)
- a 170 tie-point mini breadboard or perf board for pre-amp construction
- a TLC272 Dual op-amp
- mini electret microphone
- 47k (pull-up), 100k, 2 x 10k, 1k resistors
- 1 x 0.1uF
- jumper wires
- double row male pin header to be used for battery holder
- 2 x LR44 coin cell battery
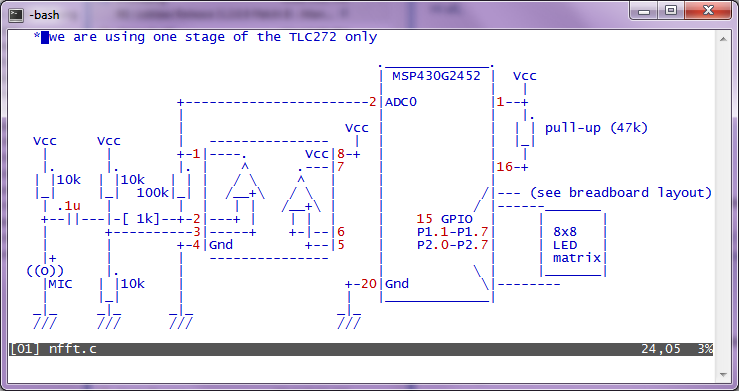
Schematic
MSP430G2553 or similar, need 4K Flash
Application Notes
- Short key press in display mode cycles through no dot, one dot, 2 dots, and 3 dots display.
- Long press enters setup mode, subsequent long press rotates thru menu.
- Menu items cycles thru 'Hamming Window Option', 'Dimmer', 'Sampling / Refresh Rate'.
- In 'Hamming Window' setup mode, short presses cycles through no hamming, hamming 1, hamming 2, hamming 3, long press confirms setting.
- In 'Dimmer' setup mode, short presses cycles through available brightness levels from 0 to 3, long press confirms setting.
- In 'Sampling / Refresh rate' setup mode, short presses cycles through the available refresh rates from 0 to 7, 0 means no delay, long press confirms setting.
- Led segment multiplexing includes time delays to compensate for brightness differences for individual rows.
LED Driving
The LED matrix is of 8 x 8 elements. They are driven by 15 GPIO pins. They are multiplexed w/ 8 rows and 8 column scheme. Since there are only 15 pins after we use 1 pin for ADC input, the multiplexing has row 1 and column 0 sharing a single pin. This means that the particular LED on row 1 and column 0 cannot be lit. This is a compromise as there are just not enough GPIO pins to drive all LED elements.
Sound Capture
Sound is capture via the on board condenser microphone on the breadboard. As microphone signals are small, we need to amplify it to a level that the msp430 ADC10 can use w/ a reasonable resolution. I had used a two-stage op-amp amplifier for this purpose.
The op-amp amplifier is consist of two stages, each w/ a about 100x gain. I had adopt the TLC272 as it is also a very common part and it works w/ 3V. The gain bandwidth being about 1.7Mhz means that for our gain of 100x, we can only guarantee it would work nicely (i.e. maintain the gain we want) under 17Khz. (1.7Mhz / 100).
Originally I intend to make this spectrum analyzer measure up to 16-20Khz, but in the end I found about 8Khz is good enough to show music. This can be changed by replacing the LM358 w/ something of audio-rated and changing the sampling rate. Just look for the gain bandwidth of the op-amps you choose.
Sampling and FFT
The FFT function used is the "fix_fft.c" code that many projects had adopted, it has been floating around in the internet for some years. I had tried a 16 bit version and a 8 bit version. Eventually I settled for the 8 bit version as for my purpose, I did not see a major advance on the 16 bit version.
I do not have a good understanding of the FFT mechanism except that it's a time domain to frequency domain conversion. That means the rate (time) of the sound samples, after feeding to the FFT calculation function, will affect the frequency of the amplitude I am getting as a result. So by adjusting the rate to sample sound, I can determine the frequency band as the result.
TimerA 0 CCR0 is used to keep the sampling time. We first determine the counts we need to achieve the band frequency (corresponds to our DCO clock rate of 16Mhz). i.e. TA0CCR0 set to (8000/(BAND_FREQ_KHZ*2))-1; where BAND_FREQ_KHZ is 8 for me. It can be changed if you got a better op-amp and / or wants it be different.
Frequency Bands and Amplitude Scaling
The firmware process 16 bands at one sweep, and the capture timing produces 500Hz separation between these banks. The LED matrix is of 8 columns and will only display 8 bands / amplitudes. Instead of displaying one every two bands, a non-linear frequency band list is used to show the more dynamic frequency bands (in terms of music). The list is of 500Hz gaps at the low end, 1KHz gaps in the middle bands and 1.5Khz bands in the highs.
The amplitude of individual bands are scaled down to 8 levels, which are represented by the number of horizontal 'dots' on the LED matrix display.The amplitude levels are scaled down via a non-linear map that translates FFT results into one of the 8 dots. A sort-of logarithmic scaling is used as it best represent our perception of sound levels.
There is built-in AGC logic and the spectrum analyser will try to scale down the amplitude levels when there are multiple peak levels detected in the previous cycles. This is done with a sliding ruler comparing table.