 martin2250
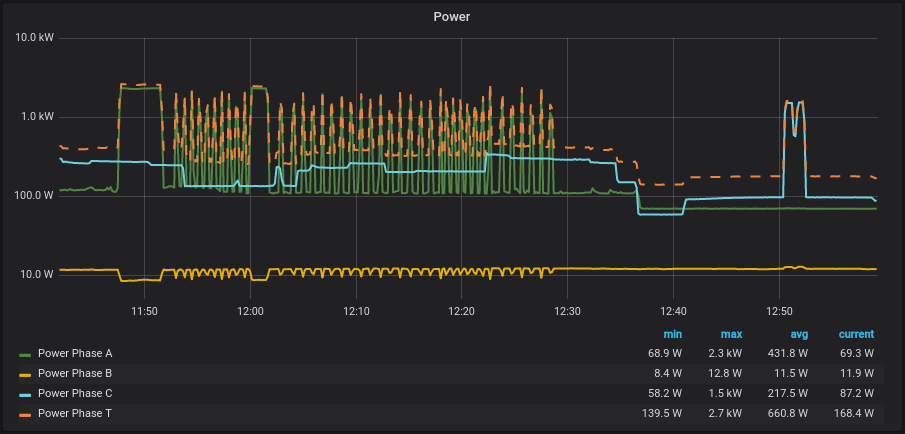
Cooking lunch on phase A (regular electric stove, not induction), then brewing coffee on phase C. You can see some crosstalk to phase B (which went from 94 to 73mA RMS).
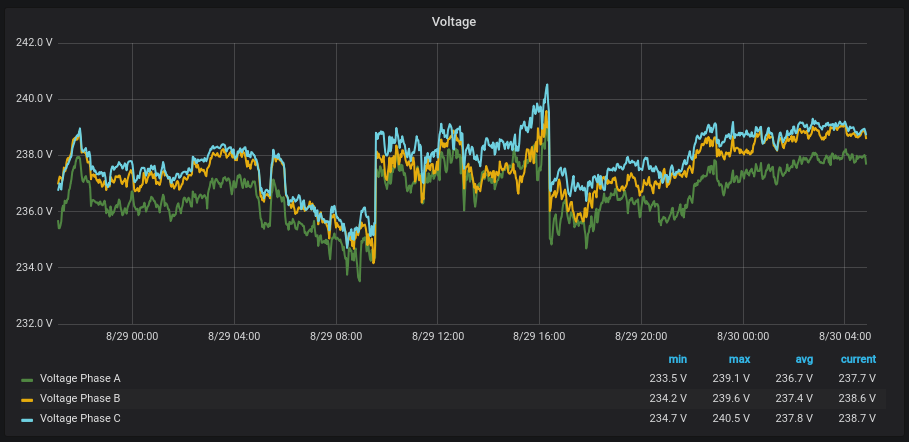
Regular jumps in the voltage of all three phases. These happen multiple times every day, often taking less than 10 seconds:
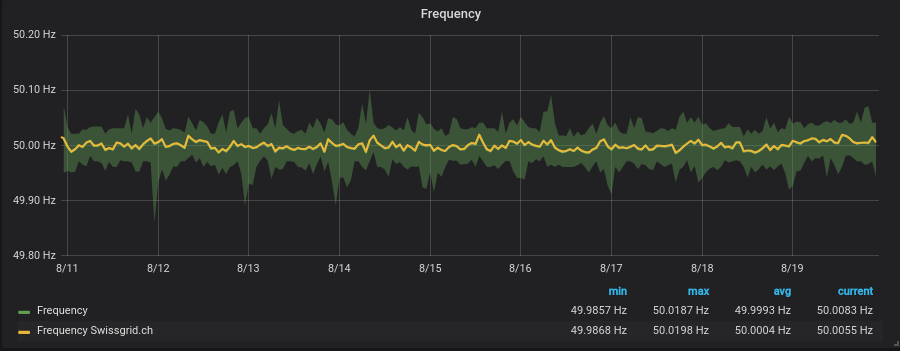
Frequency instability, the yellow curve is provided by swissgrid.ch, the green curve (covered by the yellow curve) is measured by the device. I live in germany but the two curves are perfectly coincident as the frequency should be exactly the same all across europe. The light green area shows the minimum and maximum values recorded in each interval:
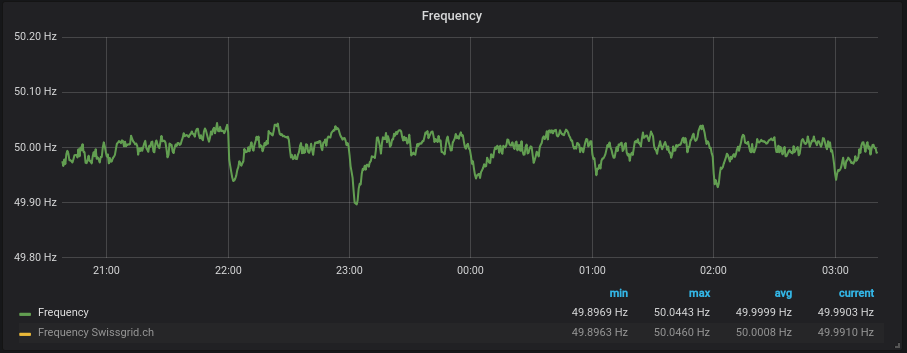
Regular jumps in the line frequency. These also happen multiple times a day, often taking less than 30 seconds:
Discussions
Become a Hackaday.io Member
Create an account to leave a comment. Already have an account? Log In.