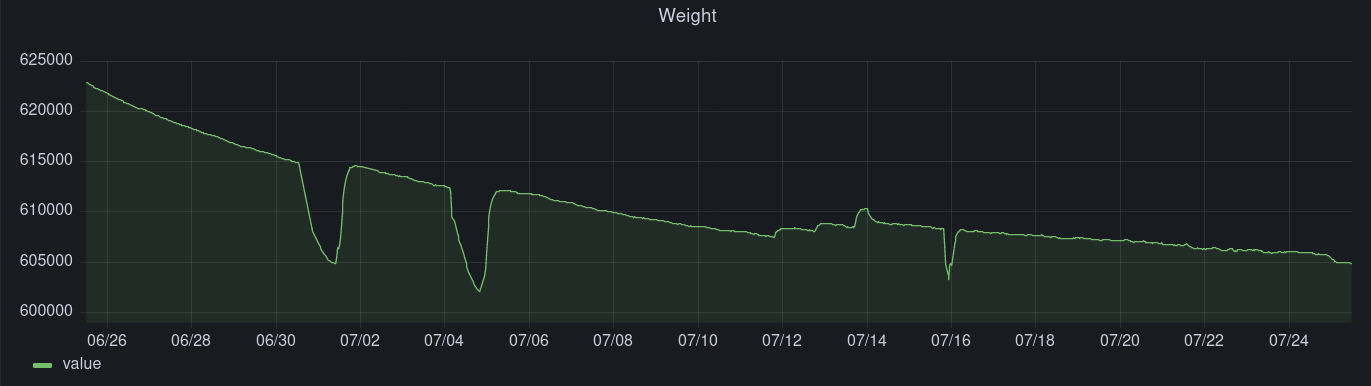
 30 days of "weight" measurements. This is actually taken from a strain gauge attached to a thin bridge across an aluminium block, where the block is supported at one end and the platform that the wood is on is attached to the other end. The problem with this approach is that as aluminium heats up it expands, causing more strain, therefore the reading is only representative of weight as long as the temperature stays constant.
The graph should be read not as an absolute value, but more as a "shape" - as it tends towards horizontal, then the weight of the wood is changing less and the wood is therefore dry.
There are periods on the graph shown here where the heater is not running (the two large dips and the later shorter dip) and where the fan speed is reduced (causing the smaller increases in the middle of the graph, as the overall temperature increases slightly due to the reduced fan speed).
Discussions
Become a Hackaday.io Member
Create an account to leave a comment. Already have an account? Log In.