 David H Haffner Sr
The first part of this script is a java based version for opening up a dual trace window (albeit an 'el cheapo version,) but very useful. I use it to monitor analog pins PA0 and PA1 on my Dev board for the ATmega1284P, using my 555 pulse generator circuit (the 1 with the 100k trimmer POT to adjust integration timing,) and a 220 ohm resistor at pin 3 at output, I can now monitor pins 3 and 6 of the 555 timer chip.
The first illustration will be the ocilloscope graphing plot and then the scripting itself:
The Red line is pin# 3-output and the Green line is pin# 6
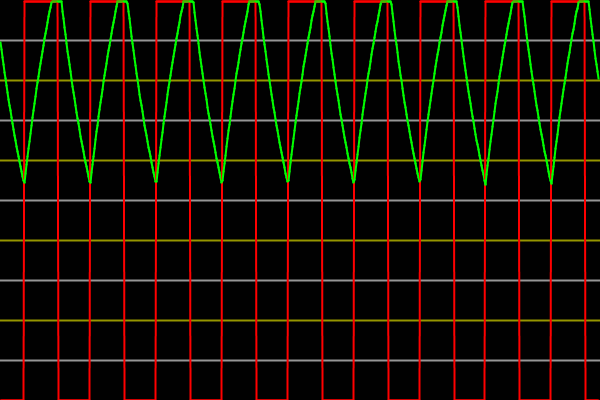
Plot is continuous at 50ms
Next is the Java script (which you need to run first, then load the arduino script.)
/*
* Oscilloscope
* Gives a visual rendering of three analog pins in realtime.
*
* This Software expands the channel amount of a previous version.
* The previous version was a project that is part of Accrochages
* See http://accrochages.drone.ws
*
* The author of this adapted software has no relation to Accrochages.
* He thanks them for the great template and the inspiration to write this software.
*
* The following declaration was part of the original software.
* This is for your information.
*
* (c) 2008 Sofian Audry (info@sofianaudry.com)
*
* This program is free software: you can redistribute it and/or modify
* it under the terms of the GNU General Public License as published by
* the Free Software Foundation, either version 3 of the License, or
* (at your option) any later version.
*
* This program is distributed in the hope that it will be useful,
* but WITHOUT ANY WARRANTY; without even the implied warranty of
* MERCHANTABILITY or FITNESS FOR A PARTICULAR PURPOSE. See the
* GNU General Public License for more details.
*
* You should have received a copy of the GNU General Public License
* along with this program. If not, see .
*/
import processing.serial.*;
Serial myPort; /* Create object from Serial class */
char HEADER = 'H'; /* character to identify the start of a message */
short LF = 10; /* ASCII linefeed */
short portIndex = 0; /* determines the USB port used */
int[] val = {-1, -1}; /* Variable used for getY function, 2 positions for 2 channels */
int[] valuesCh1; /* The next three variables will hold the data of the window in memory so that they can be pushed and displayed */
int[] valuesCh2;
float zoom; /* Define "zoom" as floating-point variable */
void setup()
{
//size(1014, 690); /* Opens a window of specific size, max size of my laptop screen, delay problems may occur */
size(600, 400); /* smaller screen => less to calculate => no delay problems */
myPort = new Serial(this, Serial.list()[portIndex], 115200); /* Open the port that the board is connected to and use the same speed (115200 bps) */
valuesCh1 = new int[width]; /* Define array with as many elements as x-pixel in window, used for plotting data of Channel1 */
valuesCh2 = new int[width]; /* ... of Channel2 */
zoom = 1.0f; /* Start with 1x zoom factor */
smooth(); /* Drawing images with smooth edges */
}
/* This function converts a channel data value into pixels shown from
* top of graph (which is the 0 position)
* this function returns an integer value */
int getY(int val)
{
return (int)(height - val / 1023.0f * (height - 1));
}
/* Function that reads the serial string data that were sent by arduino
* Puts out an array with the three values of the arduino
* Function is called in draw function */
int[] getData()
{
int[]ChValues = {-1, -1}; /* Define array for this function */
String message = myPort.readStringUntil(LF); /* Read in the serial data string sent by arduino */
if(message != null) /* Do this only when a complete valid message was received */
{
String [] data = message.split(","); /* Split the comma-separated message into it's segments */
if(data[0].charAt(0) == HEADER) /* Check for header character in the first field, always true for complete message */
{
for (int i = 1; i < data.length-1; i++) /* Skip the header and terminate cr and lf => look only at the three data points */
{
ChValues[i-1] = Integer.parseInt(data[i]); /* Write channel data into array, i shifted from data to array by 1 due to header */
}
}
}
return ChValues; /* Returns array ChValues which contains channel data */
}
/* This function pushes all the data points of the window one position further to the left, then it adds the data point that was just read */
void pushValue(int[] value)
{
for (int i=0; i<width-1; i++)
{
valuesCh1[i] = valuesCh1[i+1]; /* Move the data point over by on position */
valuesCh2[i] = valuesCh2[i+1];
}
valuesCh1[width-1] = value[0]; /* Add data point */
valuesCh2[width-1] = value[1];
}
/* This function draws the data into the window */
void drawLines()
{
int displayWidth = (int) (width / zoom); /* Calculates width of window, considering the x-change if a zoom is set */
int k = valuesCh1.length - displayWidth; /* This calculates position up to which the data points are shown */
int x0 = 0; /* x value at very left of window (=0) is assigned to x0 and used for all channels */
int ya0 = getY(valuesCh1[k]); /* y value of the last shown point is assigned to ya0 for channel1 */
int yb0 = getY(valuesCh2[k]); /* y value of the last shown point is assigned to yb0 for channel2 */
for (int i=1; i<displayWidth-1; i++) /* Loop that runs from point k to the very right side of window */
{
k++; /* Increment k for next data point */
int x1 = (int) (i * (width-1) / (displayWidth-1)); /* Calculate next x value */
int ya1 = getY(valuesCh1[k]); /* Get next y-value for channel1 */
int yb1 = getY(valuesCh2[k]); /* Get next y-value for channel2 */
strokeWeight(2); /* Draw thicker lines */
stroke(255, 0, 0); /* Draw a red line for channel1 */
line(x0, ya0, x1, ya1); /* Plot a line segment for channel1 */
stroke(0, 255, 0); /* Draw a green line for channel2 */
line(x0, yb0, x1, yb1); /* Plot a line segment for channel2 */
x0 = x1; /* Shift x value to calculate next line segments */
ya0 = ya1; /* Shift y-value for channel1 to calculate next line segments */
yb0 = yb1; /* Shift y-value for channel2 to calculate next line segments */
}
}
/* This function draws grid lines into the window
* I spaced the lines so they represent 10% and 20% steps in 2 different colors
* For Signals of 5V max, that is 0.5 & 1.0V steps */
void drawGrid()
{
stroke(150, 150, 0);
line(0, height/5, width, height/5);
line(0, height*2/5, width, height*2/5);
line(0, height*3/5, width, height*3/5);
line(0, height*4/5, width, height*4/5);
stroke(150, 150, 150);
line(0, height/10, width, height/10);
line(0, height*3/10, width, height*3/10);
line(0, height*5/10, width, height*5/10);
line(0, height*7/10, width, height*7/10);
line(0, height*9/10, width, height*9/10);
}
/* This function allows to zoom in the x-axis of the data
* It runs in the background and notices when the right key is pressed
* Zoom in with pressing "+"
* Zoom out with pressing "-" */
void keyReleased()
{
switch (key)
{
case '+':
zoom *= 2.0f;
println(zoom);
if ( (int) (width / zoom) <= 1 )
zoom /= 2.0f;
break;
case '-':
zoom /= 2.0f;
if (zoom < 1.0f)
zoom *= 2.0f;
break;
}
}
/* This is the main function that calls the other functions
* This function runs continuously */
void draw()
{
background(1); /* Sets the background of the window */
drawGrid(); /* Draws the grid into the window */
val = getData(); /* Reads the data from the three Channels as sent by the arduino into an array */
if (val[0] != -1) /* If data is in first channel, then carry out function */
{
pushValue(val); /* Pushes data down one position and adds one new data point */
}
drawLines(); /* Add the next data set to the window */
if (mousePressed) /*perform action when mouse button is pressed */
{
save("/2 channel ocillscope pics/OsciData1.png"); /* save screen shot of data window, but beware image will be overwritten with second mouse click */
}
}
This is the Arduino 2 channel ocilloscope script:
#include <util/delay_basic.h>
/* CommaDelimitedOutput sketch */
#define ANALOG_IN_Ch1 PA0
#define ANALOG_IN_Ch2 PA1
/*Arduino script for 2 channel ocilloscope program, I have this set up for my Dev board but you can easily configure it for your own applications */
void setup()
{
Serial.begin(115200);
}
void loop()
{
int val1 = analogRead(ANALOG_IN_Ch1); /* Reads values from analog Pin0 = Channel1 */
int val2 = analogRead (ANALOG_IN_Ch2); /* Reads values from analog Pin1 = Channel2 */
Serial.print('H'); /* Unique header to identify start of message */
Serial.print(",");
Serial.print(val1, DEC);
Serial.print(",");
Serial.print(val2, DEC);
Serial.print(","); /* Note that a comma is sent after the last field */
Serial.println(); /* send a cr/lf */
delay(20); //This may be able to be faster than 50ms
}
Discussions
Become a Hackaday.io Member
Create an account to leave a comment. Already have an account? Log In.