 Sumit
SumitBusiness Constraint
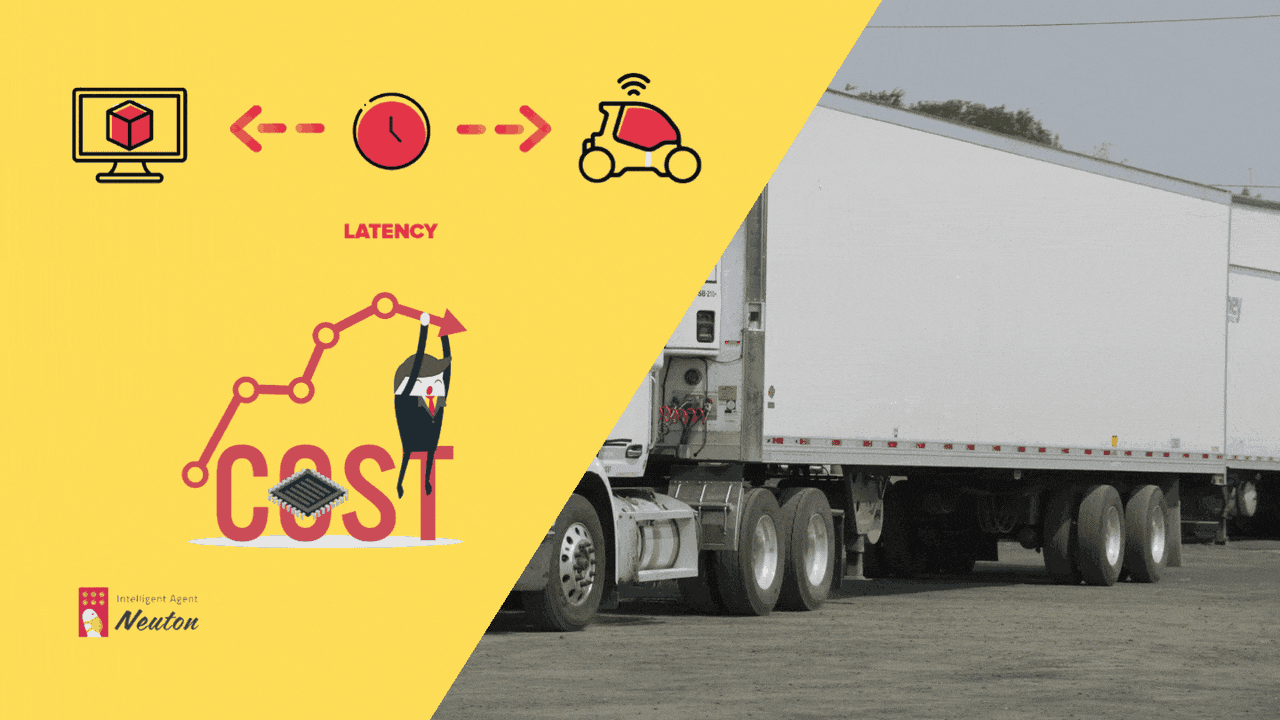
- Latency: The time taken to make predictions after getting the data must be fairly low to avoid any unnecessary increase in the maintenance time and cost.
- Cost of device: Having heavy GPUs, expensive edge devices would add unnecessary maintenance costs. Instead, the focus should be on better sensors and custom AutoML/TinyML solutions with higher accuracy and low memory footprints.
- Cost of misclassification: The cost of misclassification is very high, especially if wrongly classifying a positive class datapoint, as it can lead to a complete breakdown of the truck and incur some serious costs.
Technologies Used
- Neuton TinyML: Neuton is a no-code platform based on a patented neural network framework. I selected this solution for my experiment since it is free to use and automatically creates tiny machine learning models deployable even on 8-bit MCUs. According to Neuton developers, you can create a compact model in one iteration without compression.
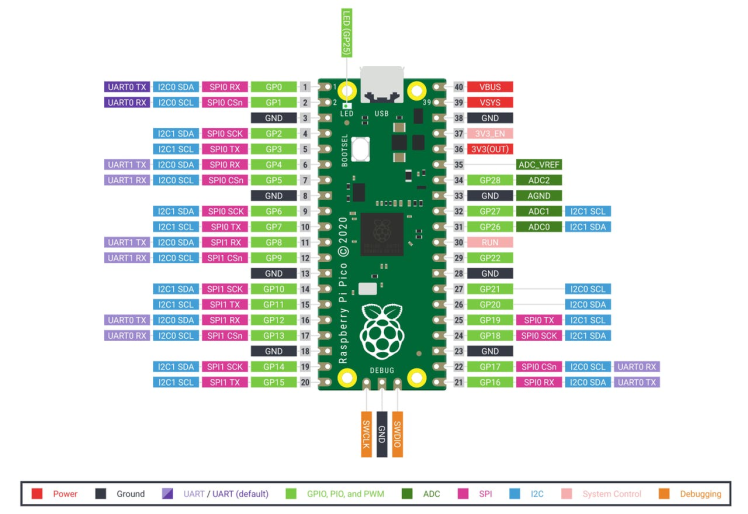
- Raspberry Pi Pico: The chip employs two ARM Cortex-M0 + cores, 133 megahertz, which are also paired with 256 kilobytes of RAM when mounted on the chip. The device supports up to 16 megabytes of off-chip flash storage, has a DMA controller, and includes two UARTs and two SPIs, as well as two I2C and one USB 1.1 controller. The device received 16 PWM channels and 30 GPIO needles, four of which are suitable for analog data input. And with a net $ 4 price tag.
Let's Build It
The goal of this tutorial is to demonstrate how you can easily build a compact ML model to solve a binary classification task in which the positive class means that the problem in the truck is due to a fault in the APS while the negative class means otherwise.
In our case, we utilize the dataset made using readings taken from Scania Trucks in their daily use (collected and provided by Scania themselves). The names of all the features are anonymized due to proprietary reasons. The dataset for this case study can be found here: https://archive.ics.uci.edu/ml/datasets/APS+Failure+at+Scania+Trucks
The experiment will be conducted on a $4 MCU, with no cloud computing carbon footprints :)
Dataset Description
The dataset is divided into two parts, a train set, and a test set. The train set contains 60, 000 rows while the test set contains 16, 000 rows. There are 171 columns in the dataset, one of them is the class label of the datapoint, resulting in 170 features for each data point.
Step 1: Creating a New Solution and Uploading the Dataset on the Neuton TinyML Platform
Once you are signed in to your Neuton account, you should have a Solutions Home page, click on Add New Solution button.
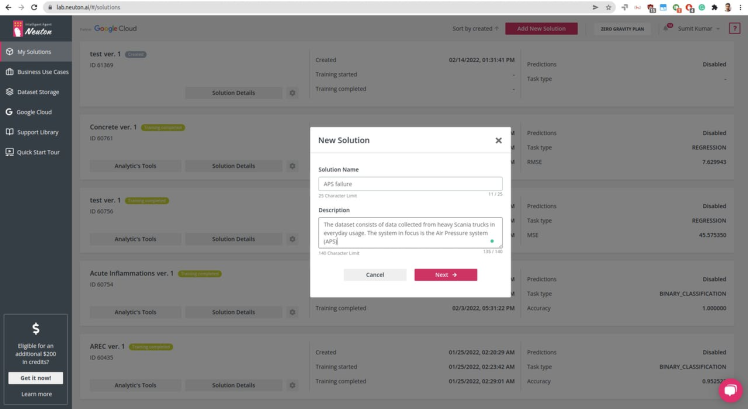
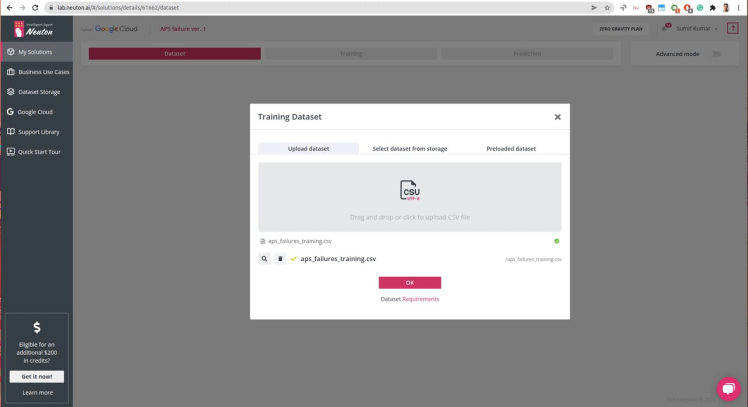
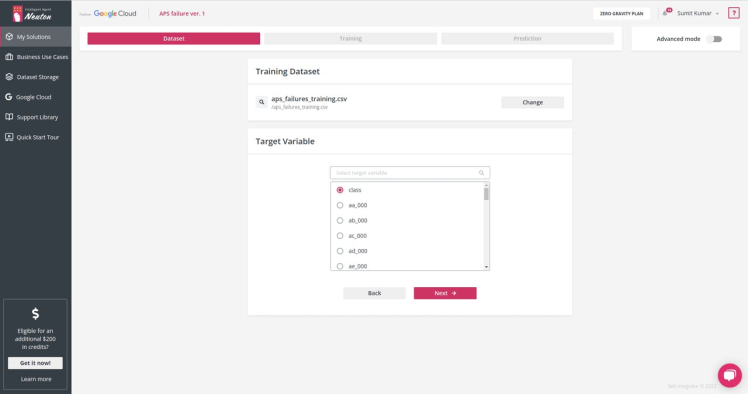
Once the solution is created, as shown above, proceed to dataset uploading (keep in mind that the currently supported format is CSV only).
Select the target variable or the output you want for each prediction. In this case, we have class as Output Variable: 0 for 'negative' and 1 for 'positive'
Step 2: Model Training and Parameters
Since we are going to embed the model onto a tiny MCU, we need to set the parameters accordingly. The Raspberry Pico can run 32-bit operations and set normalization type to Unique Scale for Each Feature
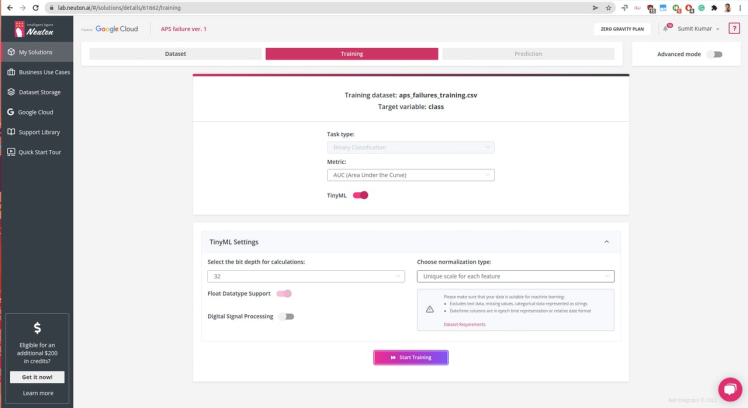
Click start training, it might take longer to train since the dataset is huge, for me, it took about ~6 hours. In the meantime, you can check out Exploratory Data Analysis generated once the data processing is complete, check the below video:
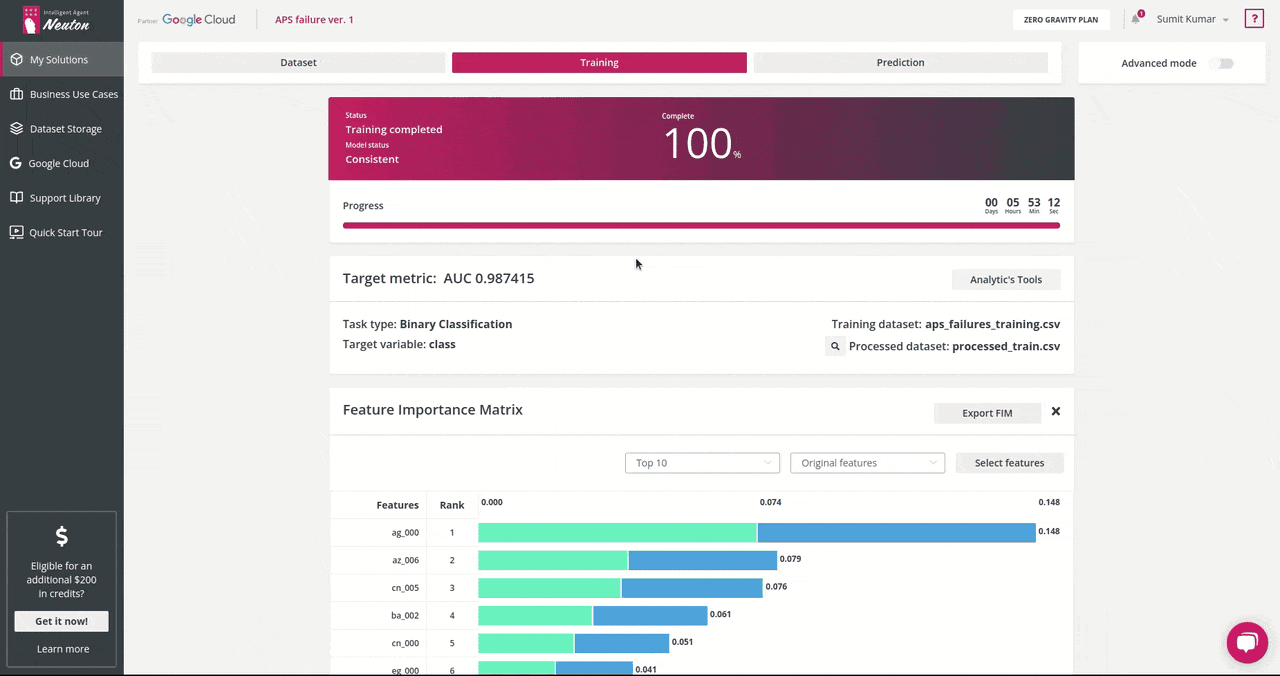
- During training, you can monitor the real-time model performance by observing model status (“consistent” or “not consistent”) and Target metric value.
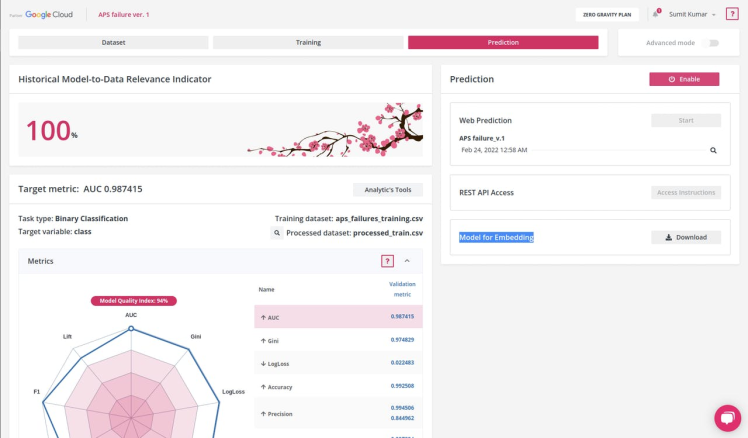
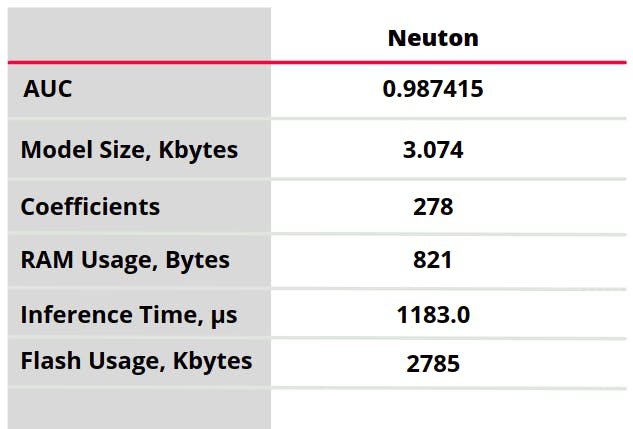
The target metric for me was: AUC 0.987415 and the trained model had the following characteristics:
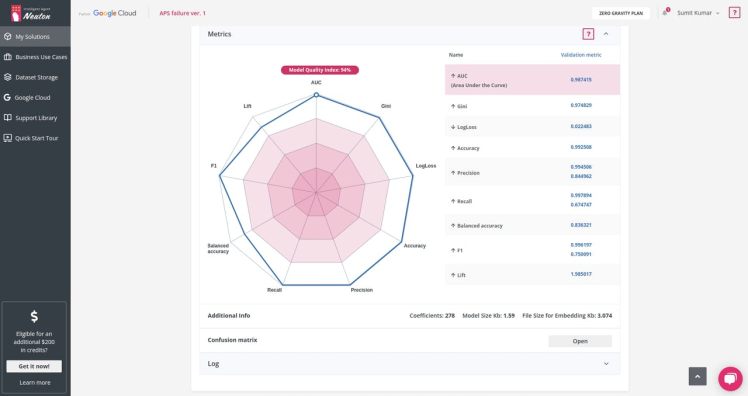
Number of coefficients = 278, File Size for Embedding = 3.074 Kb. That's super cool!
Step 3: Prediction and Embedding on Raspberry Pico
On the Neuton ai platform, click on the Prediction tab, and click on the Download button next to Model for Embedding, this would be the model library file that we are going to use for our device.
Once you have downloaded the model files, it's time to add our custom functions and actions. I am using Arduino IDE to program Raspberry Pico
Setting up Arduino IDE for Raspberry Pico:
I used Ubuntu for this tutorial, but the same instructions should work for other Debian based distributions such as Raspberry Pi OS.
1. Open a terminal and use wget to download the official Pico setup script.
$ wget https://raw.githubusercontent.com/raspberrypi/pico-setup/master/pico_setup.sh
2. In the same terminal modify the downloaded file so that it is executable.
$ chmod +x pico_setup.sh
3. Run pico_setup.sh to start the installation process. Enter your sudo password if prompted.
$ ./pico_setup.sh
4. Download the Arduino IDE and install it on your machine.
5. Open a terminal and add your user to the group “dialout.” This group can communicate with devices such as the Arduino. Using “$USER” will automatically use your username.
$ sudo usermod -a -G dialout “$USER”
6. Log out or reboot your computer for the changes to take effect.
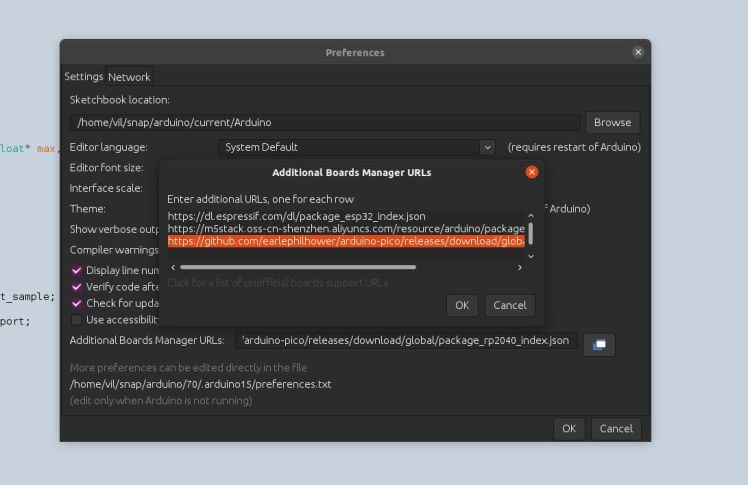
7. Open the Arduino application and go to File >> Preferences.
8. In the additional boards' manager add this line and click OK.
https://github.com/earlephilhower/arduino-pico/releases/download/global/package_rp2040_index.json
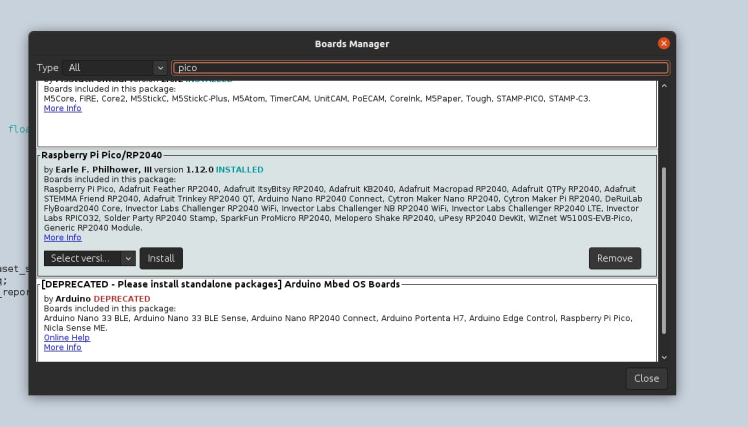
9. Go to Tools >> Board >> Boards Manager.
10. Type “pico” in the search box and then install the Raspberry Pi Pico / RP2040 board. This will trigger another large download, approximately 300MB in size.
Note: Since we are going to make classification on the test dataset, we will use the CSV utility provided by Neuton to run inference on data sent to the MCU via USB.
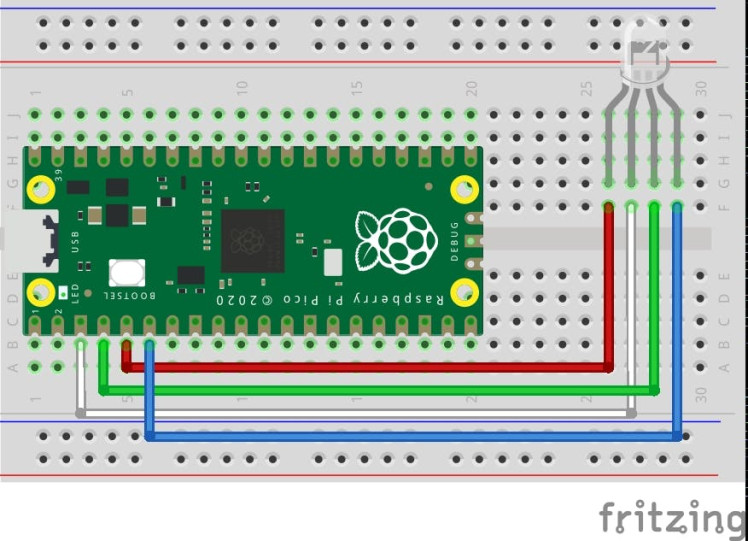
Here is our project directory,
user@desktop:~/Desktop/APS_Failure_detection$ tree
.
├── application.c
├── application.h
├── APS_Failure_detection.ino
├── checksum.c
├── checksum.h
├── model
│   └── model.h
├── neuton.c
├── neuton.h
├── parser.c
├── parser.h
├── protocol.h
├── StatFunctions.c
└── StatFunctions.h

1 directory, 13 files
Checksum, parser program files are for generating handshake with the CSV serial utility tool and sending column data to the Raspberry Pico for inference.
[Secrettip: If you train a similar binary classification model, just replace the model.h file and modify the *.ino file accordingly to run running inference on the CSV dataset via USB serial] See pin connection below
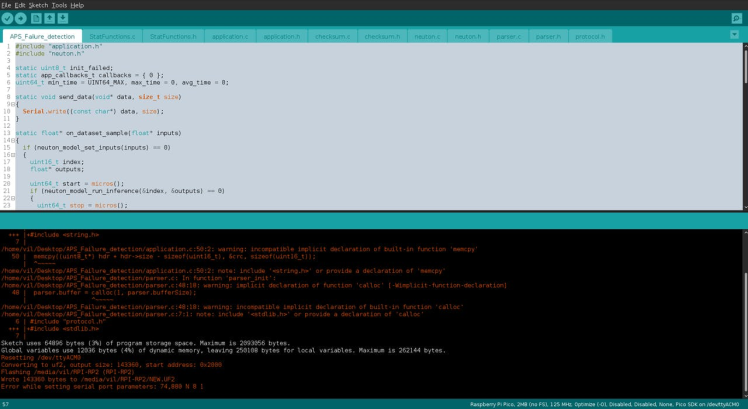
Understanding the code part in APS_Failure_detection.ino file, we set different callbacks for monitoring CPU, time, and memory usage used while inferencing.
void setup() {  Serial.begin(230400);  while (!Serial);
  pinMode(LED_RED, OUTPUT);  pinMode(LED_BLUE, OUTPUT);  pinMode(LED_GREEN, OUTPUT);  digitalWrite(LED_RED, LOW);  digitalWrite(LED_BLUE, LOW);  digitalWrite(LED_GREEN, LOW);
  callbacks.send_data = send_data;  callbacks.on_dataset_sample = on_dataset_sample;  callbacks.get_cpu_freq = get_cpu_freq;  callbacks.get_time_report = get_time_report;
  init_failed = app_init(&callbacks);
}
The real magic happens here callbacks.on_dataset_sample=on_dataset_sample
static float* on_dataset_sample(float* inputs)
{  if (neuton_model_set_inputs(inputs) == 0)  {    uint16_t index;    float* outputs;
    uint64_t start = micros();    if (neuton_model_run_inference(&index, &outputs) == 0)    {      uint64_t stop = micros();
      uint64_t inference_time = stop - start;      if (inference_time > max_time)        max_time = inference_time;      if (inference_time < min_time)        min_time = inference_time;
      static uint64_t nInferences = 0;      if (nInferences++ == 0)      {        avg_time = inference_time;      }      else      {        avg_time = (avg_time * nInferences + inference_time) / (nInferences + 1);      }  // add your functions to respond to events based upon detection     switch (index)      {      case 0:        //Serial.println("0: No Failure");        digitalWrite(LED_GREEN, HIGH);        break;
      case 1:        //Serial.println("1: APS Failure Detected");        digitalWrite(LED_RED, HIGH);        break;
      case 2:        //Serial.println("2: Unknown");        digitalWrite(LED_BLUE, HIGH);        break;
      default:        break;      }
      return outputs;    }  }
  return NULL;
}
Once the input variables are ready, neuton_model_run_inference(&index, &outputs) is called which runs inference and returns outputs.
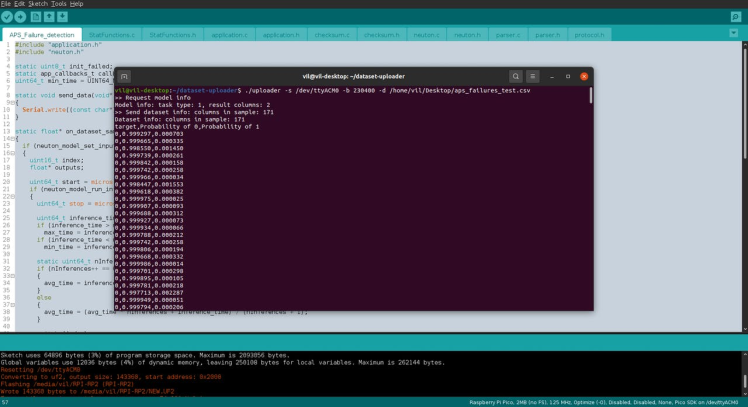
Installing CSV dataset Uploading Utility (Currently works on Linux and macOS only)
- Install dependencies,
# For Ubuntu
$ sudo apt install libuv1-dev gengetopt
# For macOS
$ brew install libuv gengetopt
- Clone this repo,
$ git clone https://github.com/Neuton-tinyML/dataset-uploader.git
$ cd dataset-uploader
- Run make to build the binaries,
$ make
Once it's done, you can try running the help command, it's should be similar to shown below
user@desktop:~/dataset-uploader$ ./uploader -h

Usage: uploader [OPTION]...
Tool for upload CSV file MCU  -h, --help                Print help and exit  -V, --version             Print version and exit  -i, --interface=STRING    interface  (possible values="udp", "serial"                              default=`serial')  -d, --dataset=STRING      Dataset file  (default=`./dataset.csv')  -l, --listen-port=INT     Listen port  (default=`50000')  -p, --send-port=INT       Send port  (default=`50005')  -s, --serial-port=STRING  Serial port device  (default=`/dev/ttyACM0')  -b, --baud-rate=INT       Baud rate  (possible values="9600", "115200",                              "230400" default=`230400')      --pause=INT           Pause before start  (default=`0')
Step 4: Running inference on Raspberry Pico
Upload the program on the Raspberry Pico,
Once uploaded and running, open a new terminal and run this command:
$ ./uploader -s /dev/ttyACM0 -b 230400 -d /home/vil/Desktop/aps_failures_test.csv
Green Light means no APS failure, Red Light means APS failure based upon the CSV test dataset received via Serial.

Green Light means no APS failure, Red Light means APS failure based upon the CSV test dataset received via Serial.
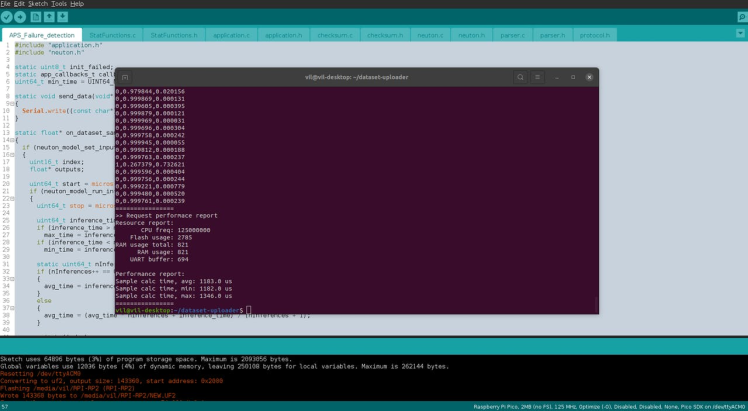
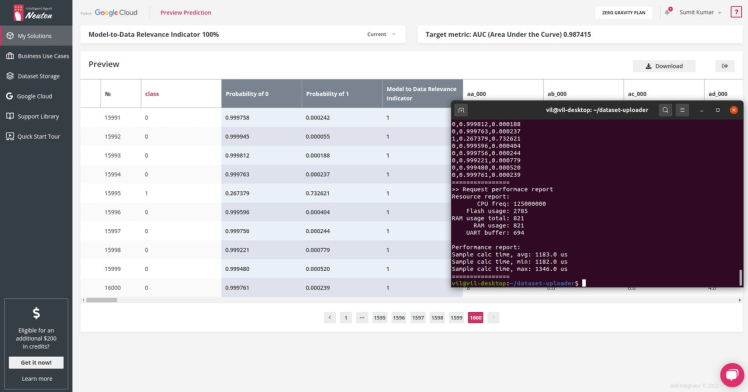
The inference has started running, once it is completed for the whole CSV dataset it will print a full summary.
>> Request performace report
Resource report:       CPU freq: 125000000    Flash usage: 2785
RAM usage total: 821      RAM usage: 821    UART buffer: 694

Performance report:
Sample calc time, avg: 1183.0 us
Sample calc time, min: 1182.0 us
Sample calc time, max: 1346.0 us
I also did a comparison with Web Prediction on the Neuton TinyML platform and the results were similar.Plus, I tried to build the same model with TensorFlow and TensorFlow Lite. My model built with Neuton TinyML turned out to be 14.3% better in terms of AUC and 9.7 times smaller in terms of model size than the one built with TF Lite. Speaking of the number of coefficients, TensorFlow's model has 7, 060 coefficients, while Neuton's model has only 278 coefficients (which is 25.4 times smaller!).
So, the resultant model footprint and inference time are as follows:
Isn't it amazing that Raspberry Pico is able to perform tasks that are otherwise handled using high-performance machines on the cloud?
Conclusion
This tutorial is vivid proof that you don’t need to be a data scientist to rapidly build super compact ML models to proactively solve practical challenges. And, most importantly, the implementation of such solutions using tinyML, which saves lots of money and resources, doesn’t require high costs or efforts, but only a free no-code tool and a super cheap MCU!
Stay tuned for more exciting tutorials and don't forget to sign for a free Neuton AI account :)