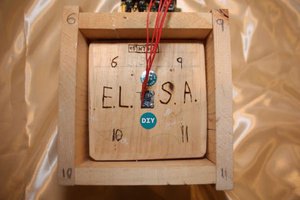
 Florian Wilhelm Dirnberger
1. Prototypes
Status as of February, 2023
With an SSD1306 0.96'' OLED and a buzzer.
2. G-M tube SBM-20 (or STS-5, Cyrillic CTC-5)
With this Soviet Union tube you can detect Beta and Gamma radiation (as with any Geiger tube, you cannot distinguish them), but not Alpha. For the tubes you are seeing on the pictures I paid around 30€ (in 2022, probably more expensive now), including shipment.
Technical data: SBM-20_GER1.pdf (mikrocontroller.net)
For registering pulses by the counting system proper working conditions have to be established. That means in practical terms generating a tube voltage within the Plateau area.
Beyond the characteristic "Knee" all pulses are (or ought to be) counted. Below the starting voltage, no pulses are counted at all.

3. Emitters, natural radiation and testing
To test the general viability of the assembly I use small pieces of Uranium glass that can be purchased online (this matter doesn't radiate intensely for obvious reasons).
The natural radiation is detected about 20 CPM (in 49°464874268' N, 11°125233650' E) with the most recent prototypes. There's of course inherent randomness in the measured data.
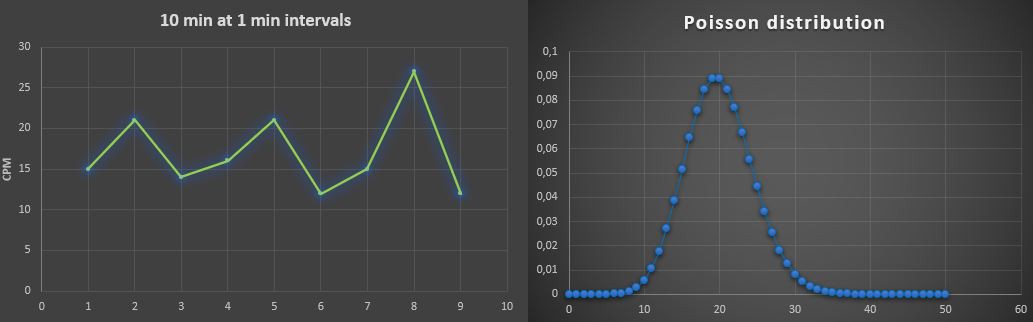
Note: for a reasonably accurate realization of the underlying probability distribution there are a lot of samples needed, the given graphs are just for illustration (for seldom events such as radioactive decay, Poisson distribution can be a helpful mathematical model).
4. Program development and display of data
4.1 Conceiving an algorithm from scratch
I use C language for program development. In order to work with it, I had to install the tool chain (the C development system) on my Raspberry Pi.
Necessary for the HV-generation is a PWM with a frequency of e.g. 10 kHz and a duty cycle of e.g. 60% (output here on GP3, see paragraph 5) - these are empirical parameters.
As we have an MCU connected there are several ways how to handle measurement data.
Triggering IRQs and counting them (here on GP2) is one pragmatic method, for a pulse (gas discharge, i.e. counting event) has a duration of about 0.3 ms. Problems may arise with high counting rates for the interrupt handler might be unable to deal with them properly (up to about 500 CPM, a counting rate I'm able to generate with the emitters, everything seems alright).
4.2 Displays
For a more sophisticated display of data (statistical calculations, graphs etc.) than just flashing LEDs or triggering a buzzer, an attached off-the-shelf subassembly can be used. The Pico SDK makes common types of displays, e.g. a 16x2 LCD or a SSD1306 OLED, fairly easy to use - keeping in mind that an LCD/OLED connected to the I2C bus may or may not have its own pull-up resistors.
LCDs consume too much power for my taste, so I don't use them any more (though they look aesthetic).
With the OLED, a compromise has to be found between sophistication of display and power consumption. More characters i.e. activated pixels and more contrast equal higher consumption. Hacker NuclearPhoenix uses an identical 0.96'' OLED for his project and he generates intricate graphs on this actually tiny display. The OLEDs have a further advantage for you can use them in freezing cold conditions as well.
4.3 Non-wireless data transfer
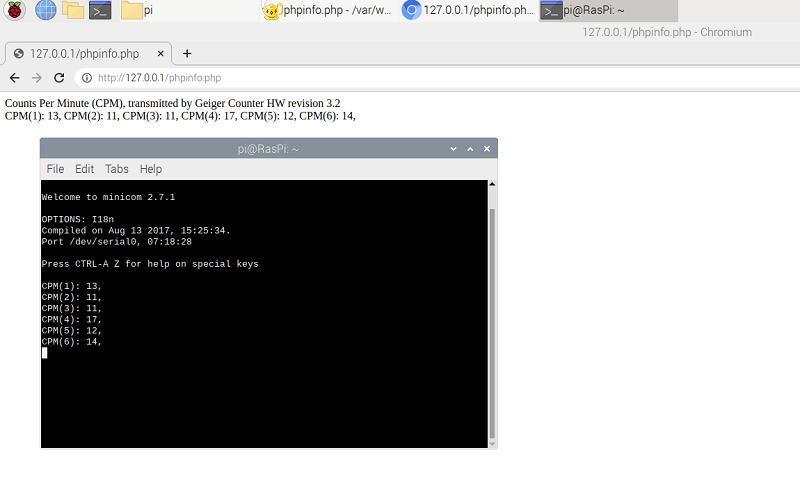
Just transmitting the data via cable to an other device is also an option, for instance via serial port to the Raspberry Pi (which in turn can provide the data on e.g. a webserver via php-script).
Raspberry-Pi/Project-6/CPMinfo.php at main · Florian-Wilhelm/Raspberry-Pi (github.com)
5. Schematic
The device comprises in essence the MCU board, the boost converter, a power supply network, the HV control loop and of course the Geiger tube.
Diode D1 prevents immediate discharge of capacitor C1 and tube voltage is building up quickly. The coil voltage peaks into the double, then triple digits every time the transistor...
Read more »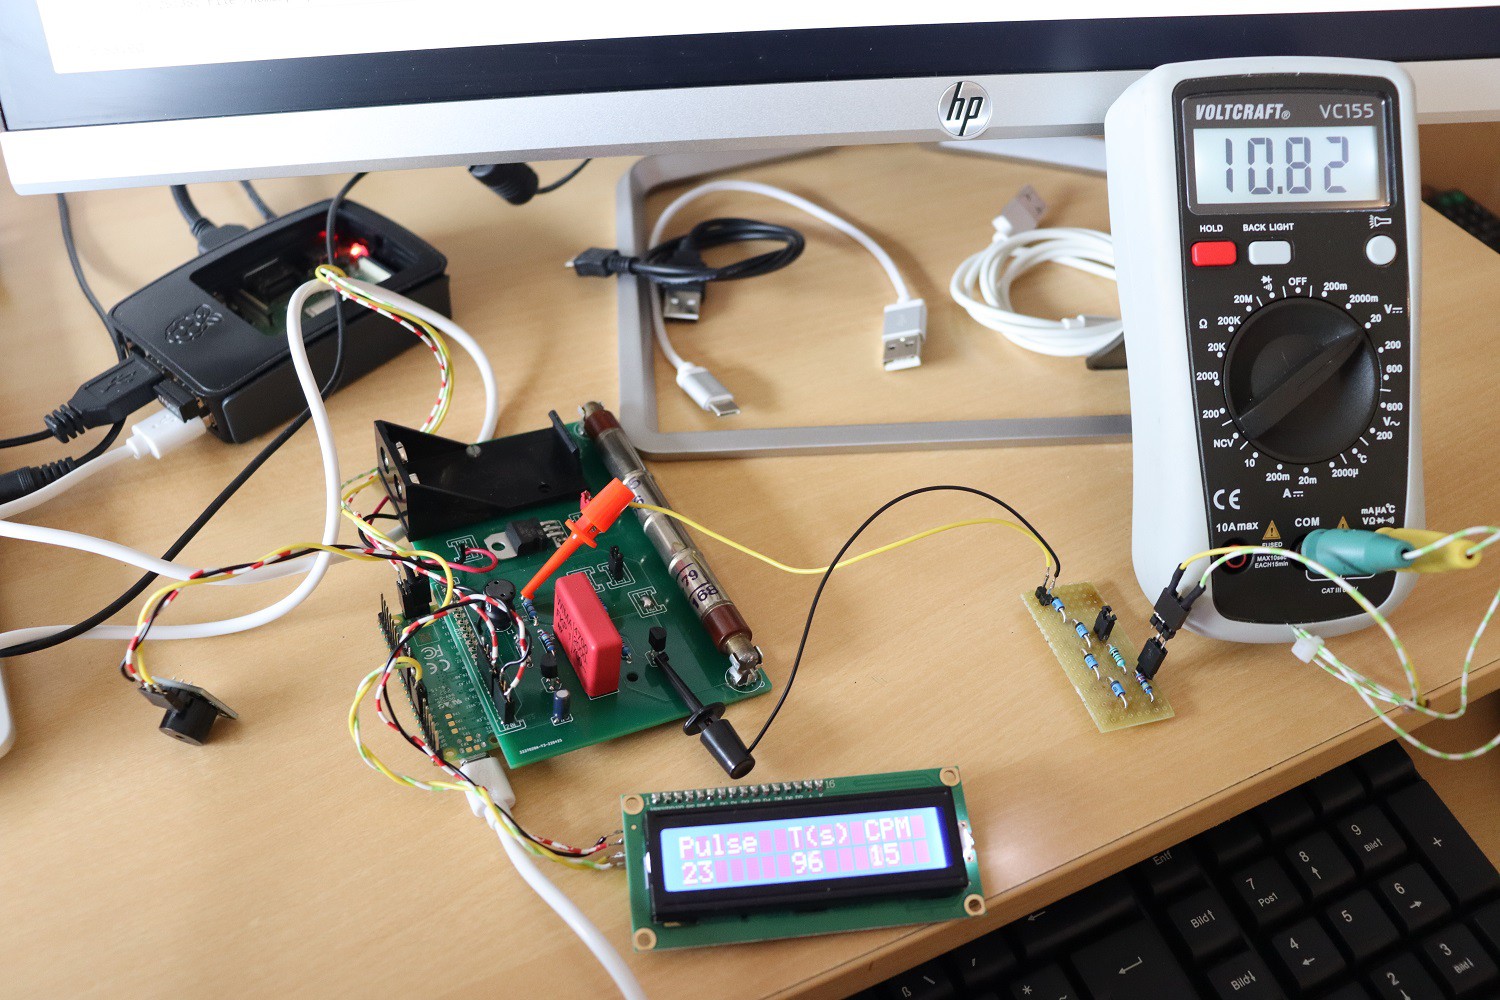


 Michael
 Matthias Kesenheimer
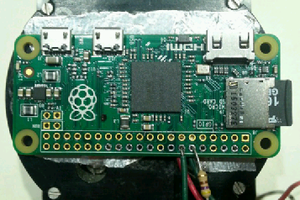
The counter on some of your photos is not SBM-20, but STS-5, an older version with similar specifications.