 EK
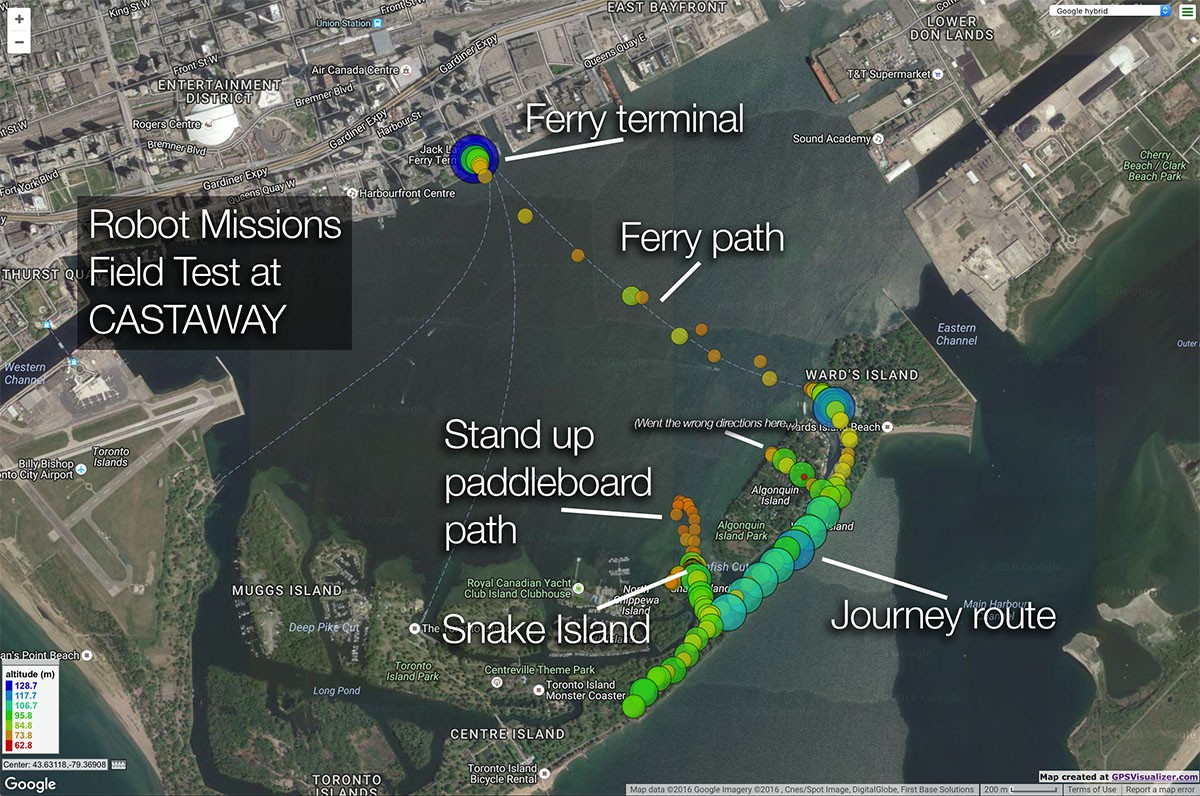
EKDuring the CASTAWAY Field Test, we used a GPS unit with the robot to plot its location. We learned that we're able to see exact cluster locations of where the robot collects debris. This is extremely interesting, as we can use a similar technique in the future to find trends in where the debris is located.

Sneak peek at our observations. Read on for the technical details!

Setup
Since we needed to get this ready as fast as possible, the setup was very simple:
- Arduino Diecimila
- GPS + SD shield
- Li-Ion Batt
- Powerboost 1000
- Water resistant case (like a pelican or otterbox case)
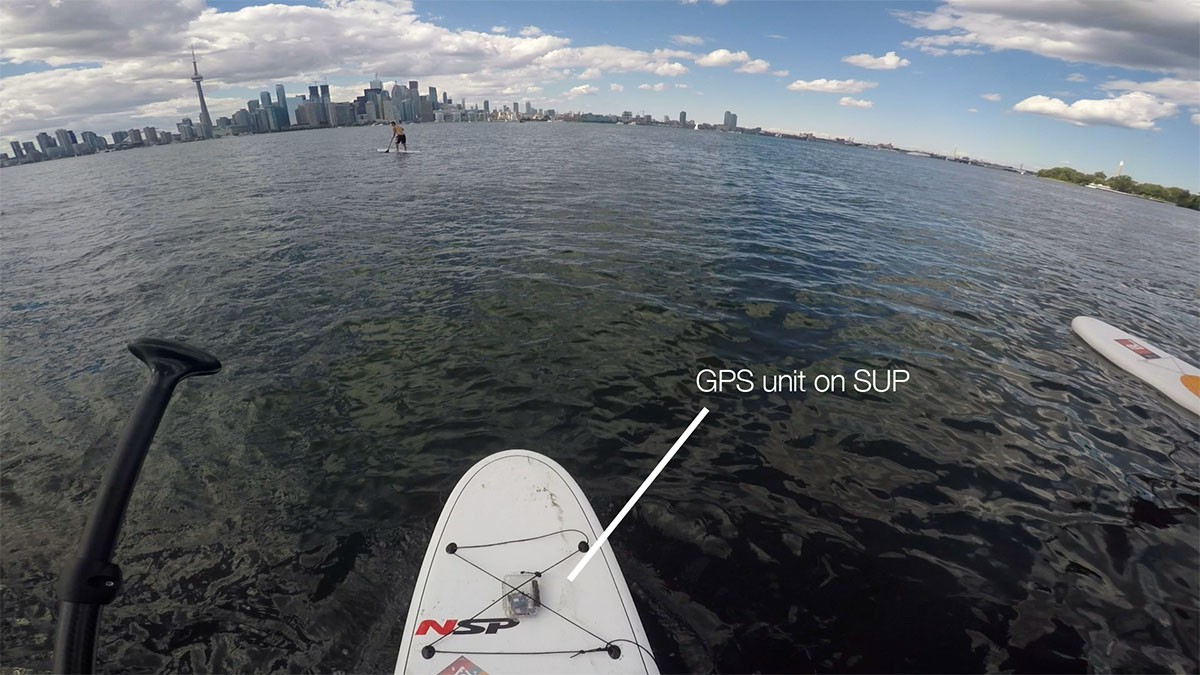
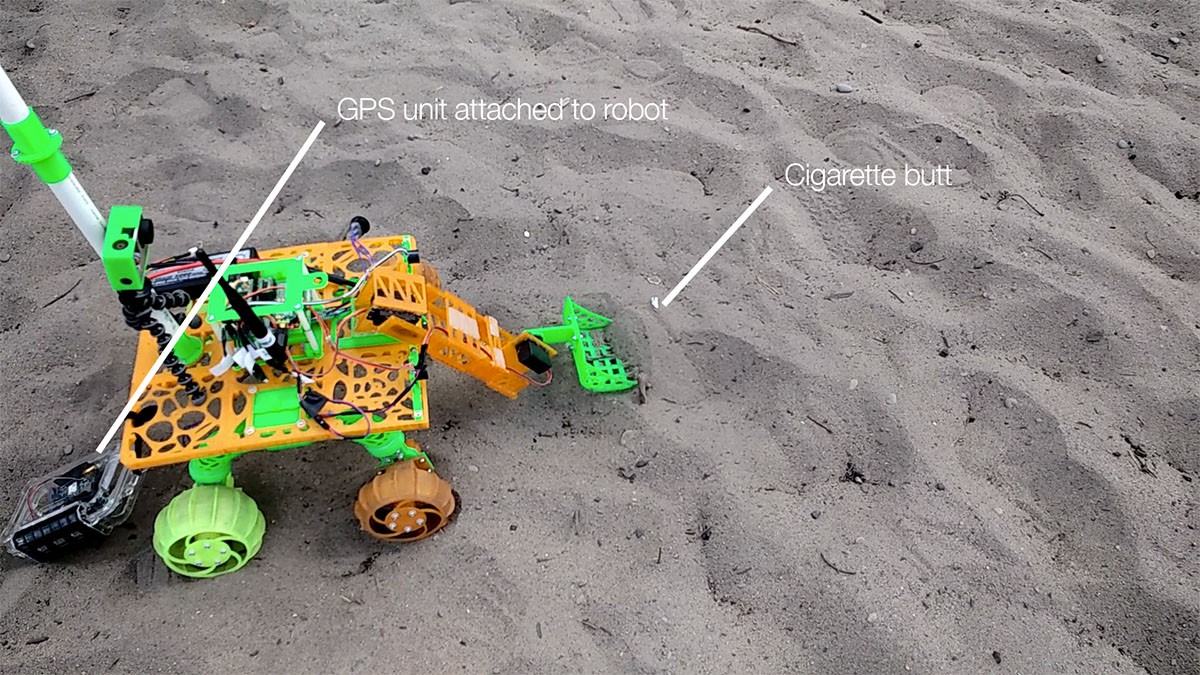
We moved the GPS unit around with us all day - either in the backpack or holding it. When attaching it to Bowie, we tied it onto the back. For the stand up paddleboard (SUP), we placed it in the cords on the board and tied it. (Glad we didn't tip over!)
Method
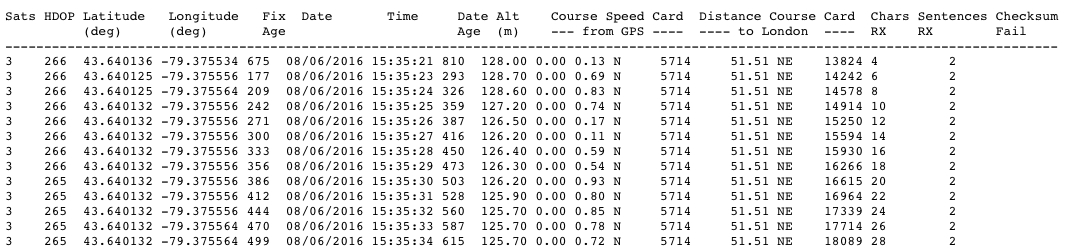
The code running on the Arduino is based on the TinyGPS++ example code. Sampling was at 1Hz, and this data was logged to a text file.
We then generated 3 csv files, which included data every 60 seconds (rather than every second). This was then used with the maps.
Map
We used GPSVisualiser.com to view the data. This a great tool that is easily accessible, letting us colourise the bubbles and vary their size according to altitude.
The data source was file2.csv. The data included was latitude, longitude, altitude, and time.
Here's the settings we used for the map:
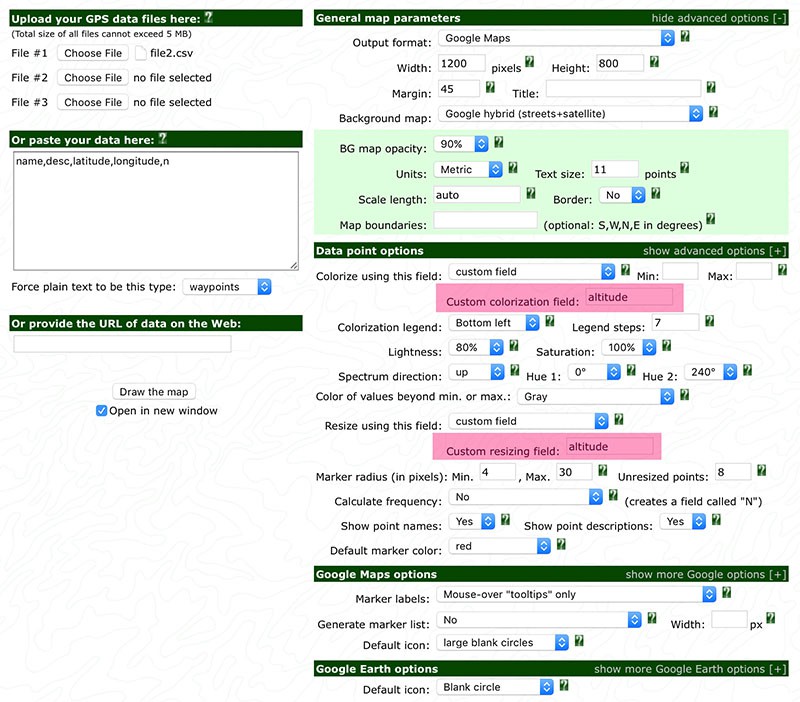
This generated a map that looks like this, where we can now visualise the data!
Observations
Below are observations from the data
1. Ferry path
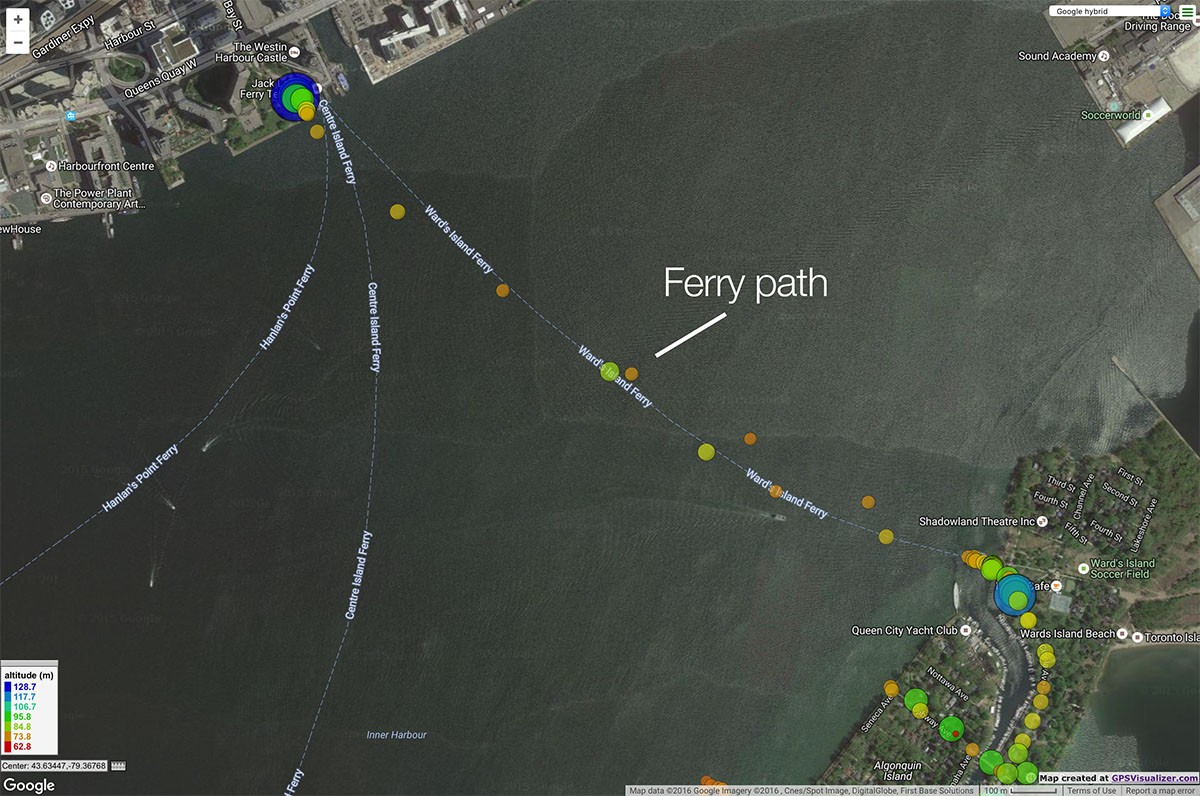
The spacing between the points represents how fast we were moving. Here you can see on the ferry to go from Toronto to the island, we were moving rapidly. Not surprising, the altitude remained roughly the same for the trip.
2. Walking path
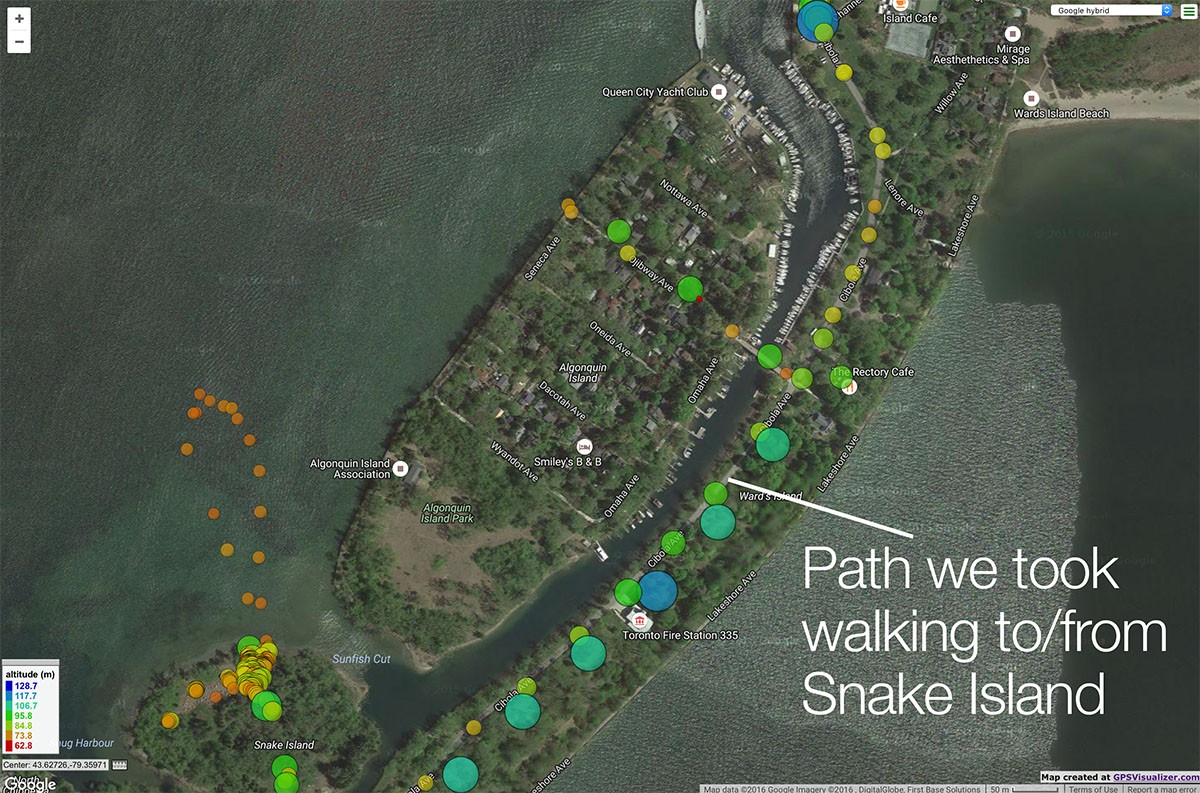
Compare the ferry path to the walking path, and you can see we were moving slower. Along Cibola Ave, the elevation did increase!
3. Snake Island Field Test area
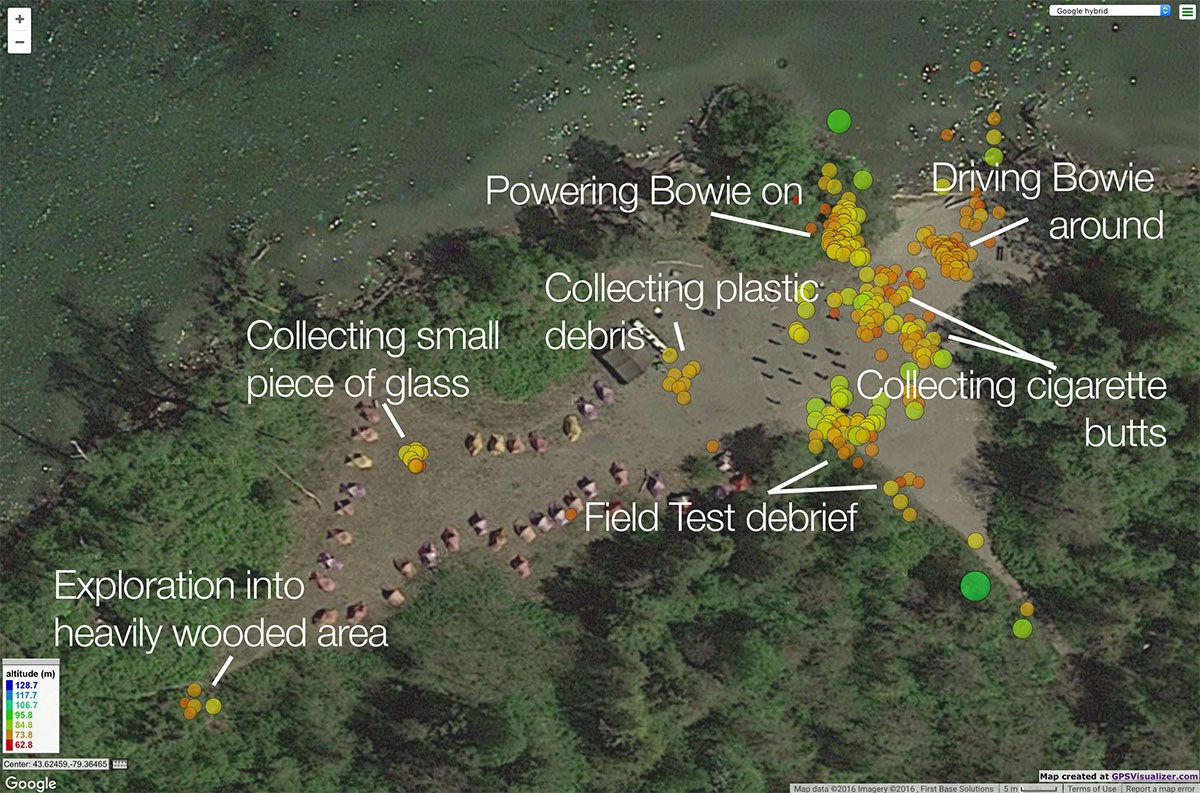
Snake Island is where the Field Test took place. The first thing you see here, are all the clusters of areas that we were in. The areas where we were collecting debris were more concentrated as there was more time spent there testing the robot.
Being able to see these clusters gives a good idea of where we spent the most time. Which was on the beach near the water, where everyone at CASTAWAY was.
As for exploration into heavily wooded area - check out this project update for a video!
4. SUP path
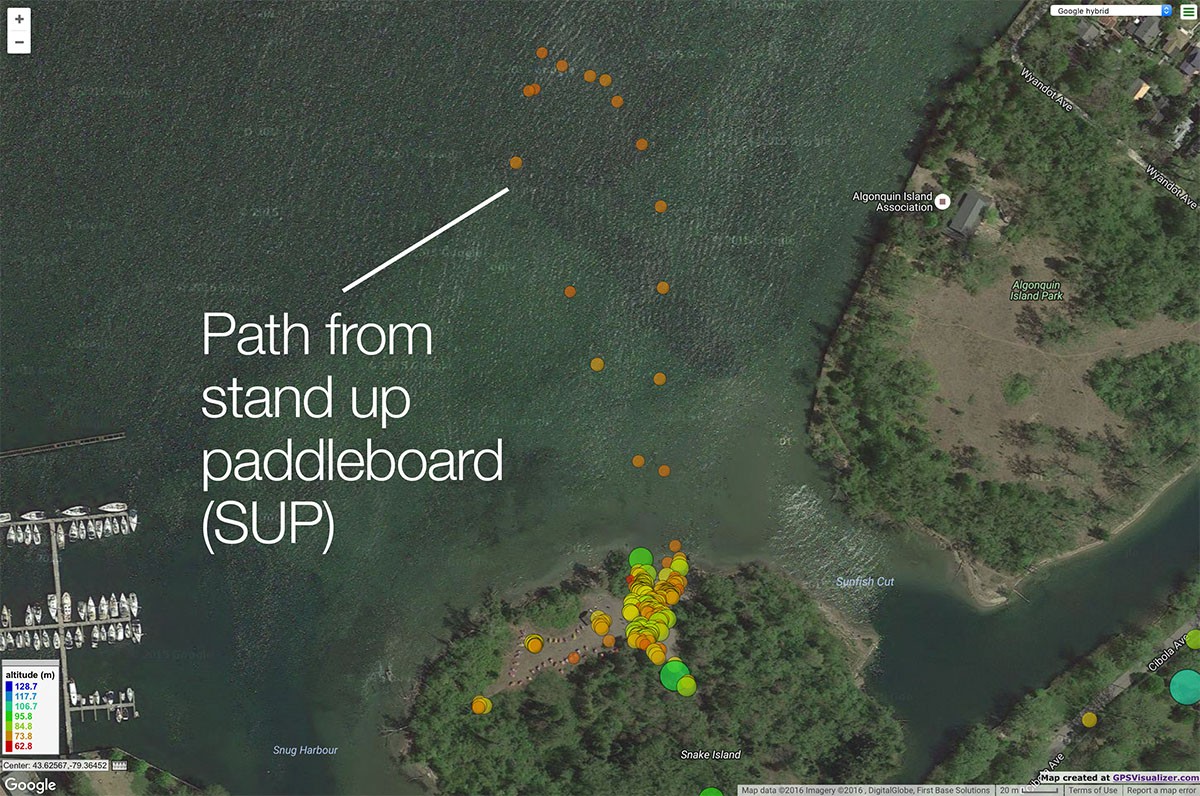
We also took the GPS unit for a spin on the stand up paddleboards. Here was the path. It was surprising to see how small it was, as it seemed much longer and closer to Toronto mainland when we were out on the water!
5. Errors
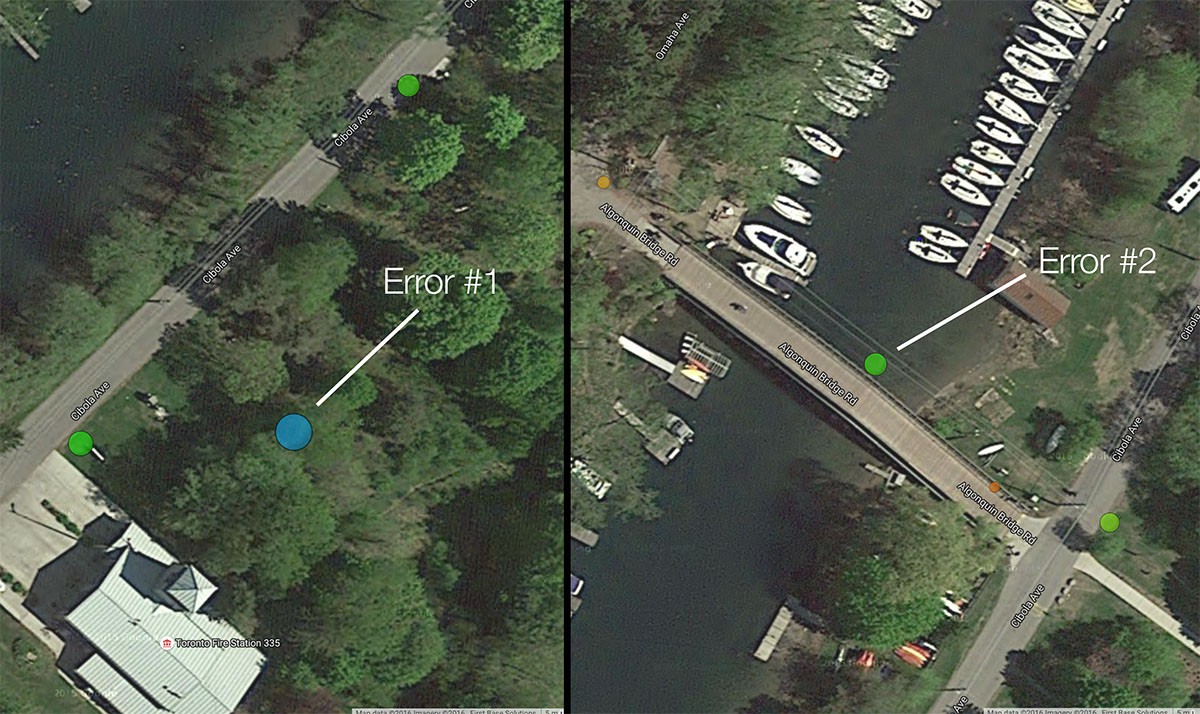
A key observation we wanted to make was how accurate the GPS is. For the most part, it seems pretty on spot. Here are two points where it was not. The one on the left - we didn't venture that far off of the road. The one on the right - we were on the bridge, and the point shows that we were in the water. However, the bridge was small, and so getting to the precision of being on it might not be feasible.
Outcomes
It was interesting to see the cluster areas where the robot was collecting debris. This will lead to better analytics about where debris is - and we can track changes over time to see any trends.
- Accuracy is much better than expected!
- Need a button to mark points of interest
- Indicate there is a fix with the satellites with an LED
- Indicate if battery level becoming low
- 1Hz sampling rate might be too frequent
- Using additional sensors for the colour or size of the bubble will lead to more insights
The next step is to improve the GPS unit, and make it communicate with the robot controller so that it will be able to navigate to a specific latitude and longitude using the compass. (If you've been following on social media, you might have been hearing about our progress with the magnetometer!)
Special thanks to Sam, Jeff, Fiona and Erin for helping with this Field Test!
Discussions
Become a Hackaday.io Member
Create an account to leave a comment. Already have an account? Log In.