 makeTVee
I just started to play around with parsing data from internet sources to the matrix.
Starting with this page (German parliament seat distribution):
https://www.bundeswahlleiter.de/bundestagswahlen/2017/ergebnisse/bund-99.html
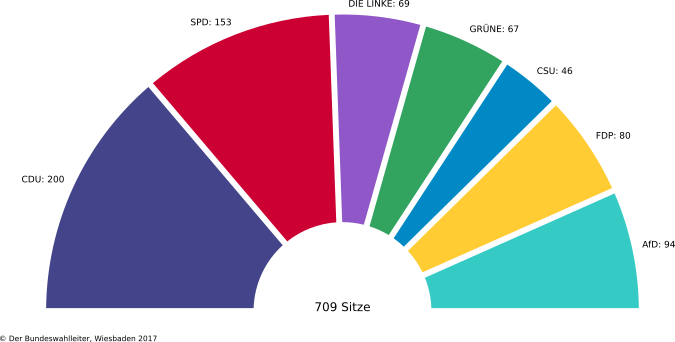
and extracting data and colors from the SVG image using this code:
doc = minidom.parse('diagramm.svg')  # parseString also exists
    style_string = [path.getAttribute('style') for path in doc.getElementsByTagName('path')]
    label_string = [path.getAttribute('aria-labelledby') for path in doc.getElementsByTagName('path')]
    text_string = [text.getAttribute('id') for text in doc.getElementsByTagName('text')]
    data_string = [text for text in doc.getElementsByTagName('text')]
    rgb=[]
    percentage=[]
    index=0

    for i in range(0,7):
        rgb.append(style_string[i].split("(")[1].split(")")[0].split(","))
    for i in range(0,text_string.__len__()):
        if text_string[i]==label_string[index]:
            percentage.append(int(round(200*int(data_string[i]._get_childNodes()[0]._get_data().split(": ")[1])/709)))
            if index < label_string.__len__()-1:
                index=index+1

    doc.unlink()
    pix=0
So after sending this data to the matrix, I got this:
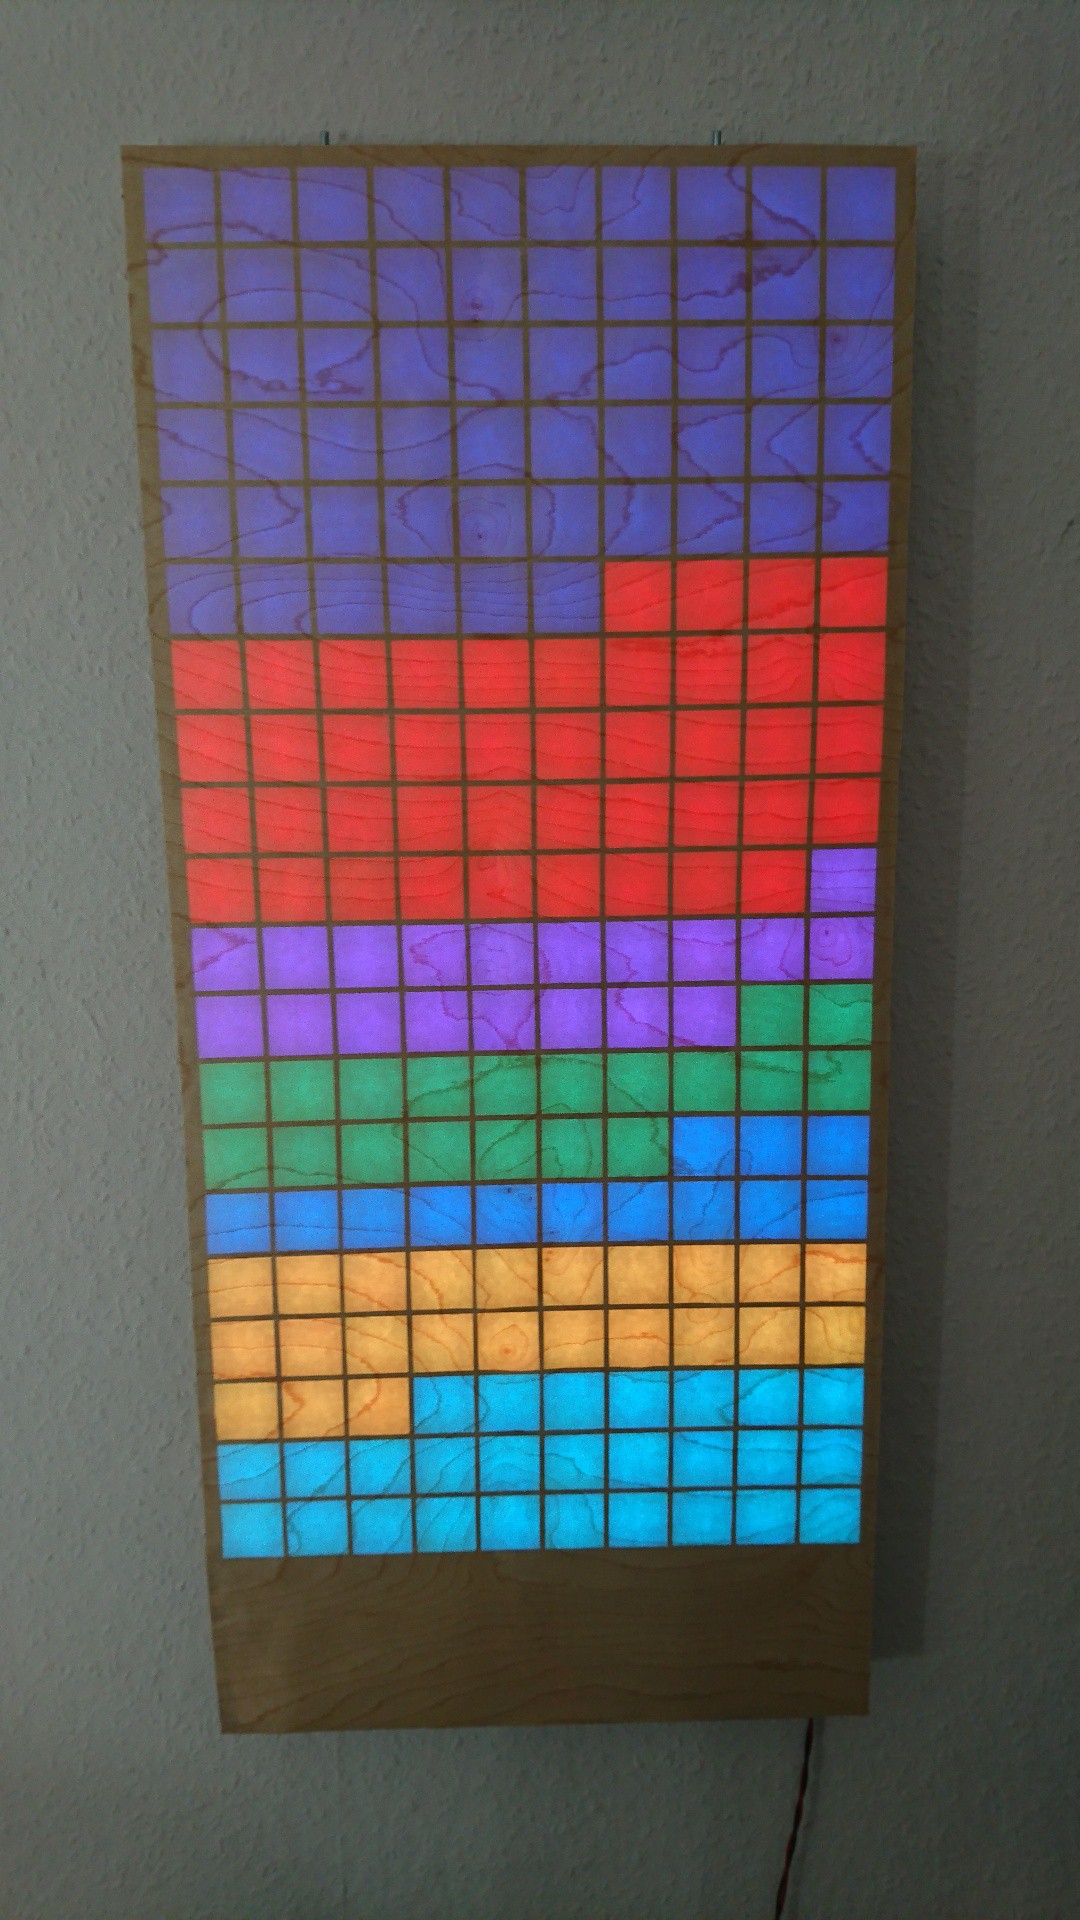
Nice starting point...
Discussions
Become a Hackaday.io Member
Create an account to leave a comment. Already have an account? Log In.