 T. B. Trzepacz
Having generated the waveform data and tested it in Shadertoy, the next step was to convert it to C++ code and write out to datatables to include in the synth code. This was a little trickier than expected for some reason... you'd think the math would all work the same, but it actually required a bit of rework to get the same results. I ended up making the code more explicit about samples, transition steps, and segments of the continuous waveform, and I rewrote all of the transitions to use a smooth-in/smooth-out transition (basically cosine from PI to 2*PI).
In order to check to make sure my results were correct, I decided to graph the text output datatables. That was a good thing, because there were a lot of problems!
First, I tried LibreOffice, but it kept choking on my dataset and would just hang forever. I have to keep reminding myself that LibreOffice is a really terrible program that will always let me down.
Next I tried an online program called Plot.ly. At first, I couldn't get it to do a height map with my data, but it turns out that was just a problem with the version 2 beta they tried to force me into. It works fine in the original version.
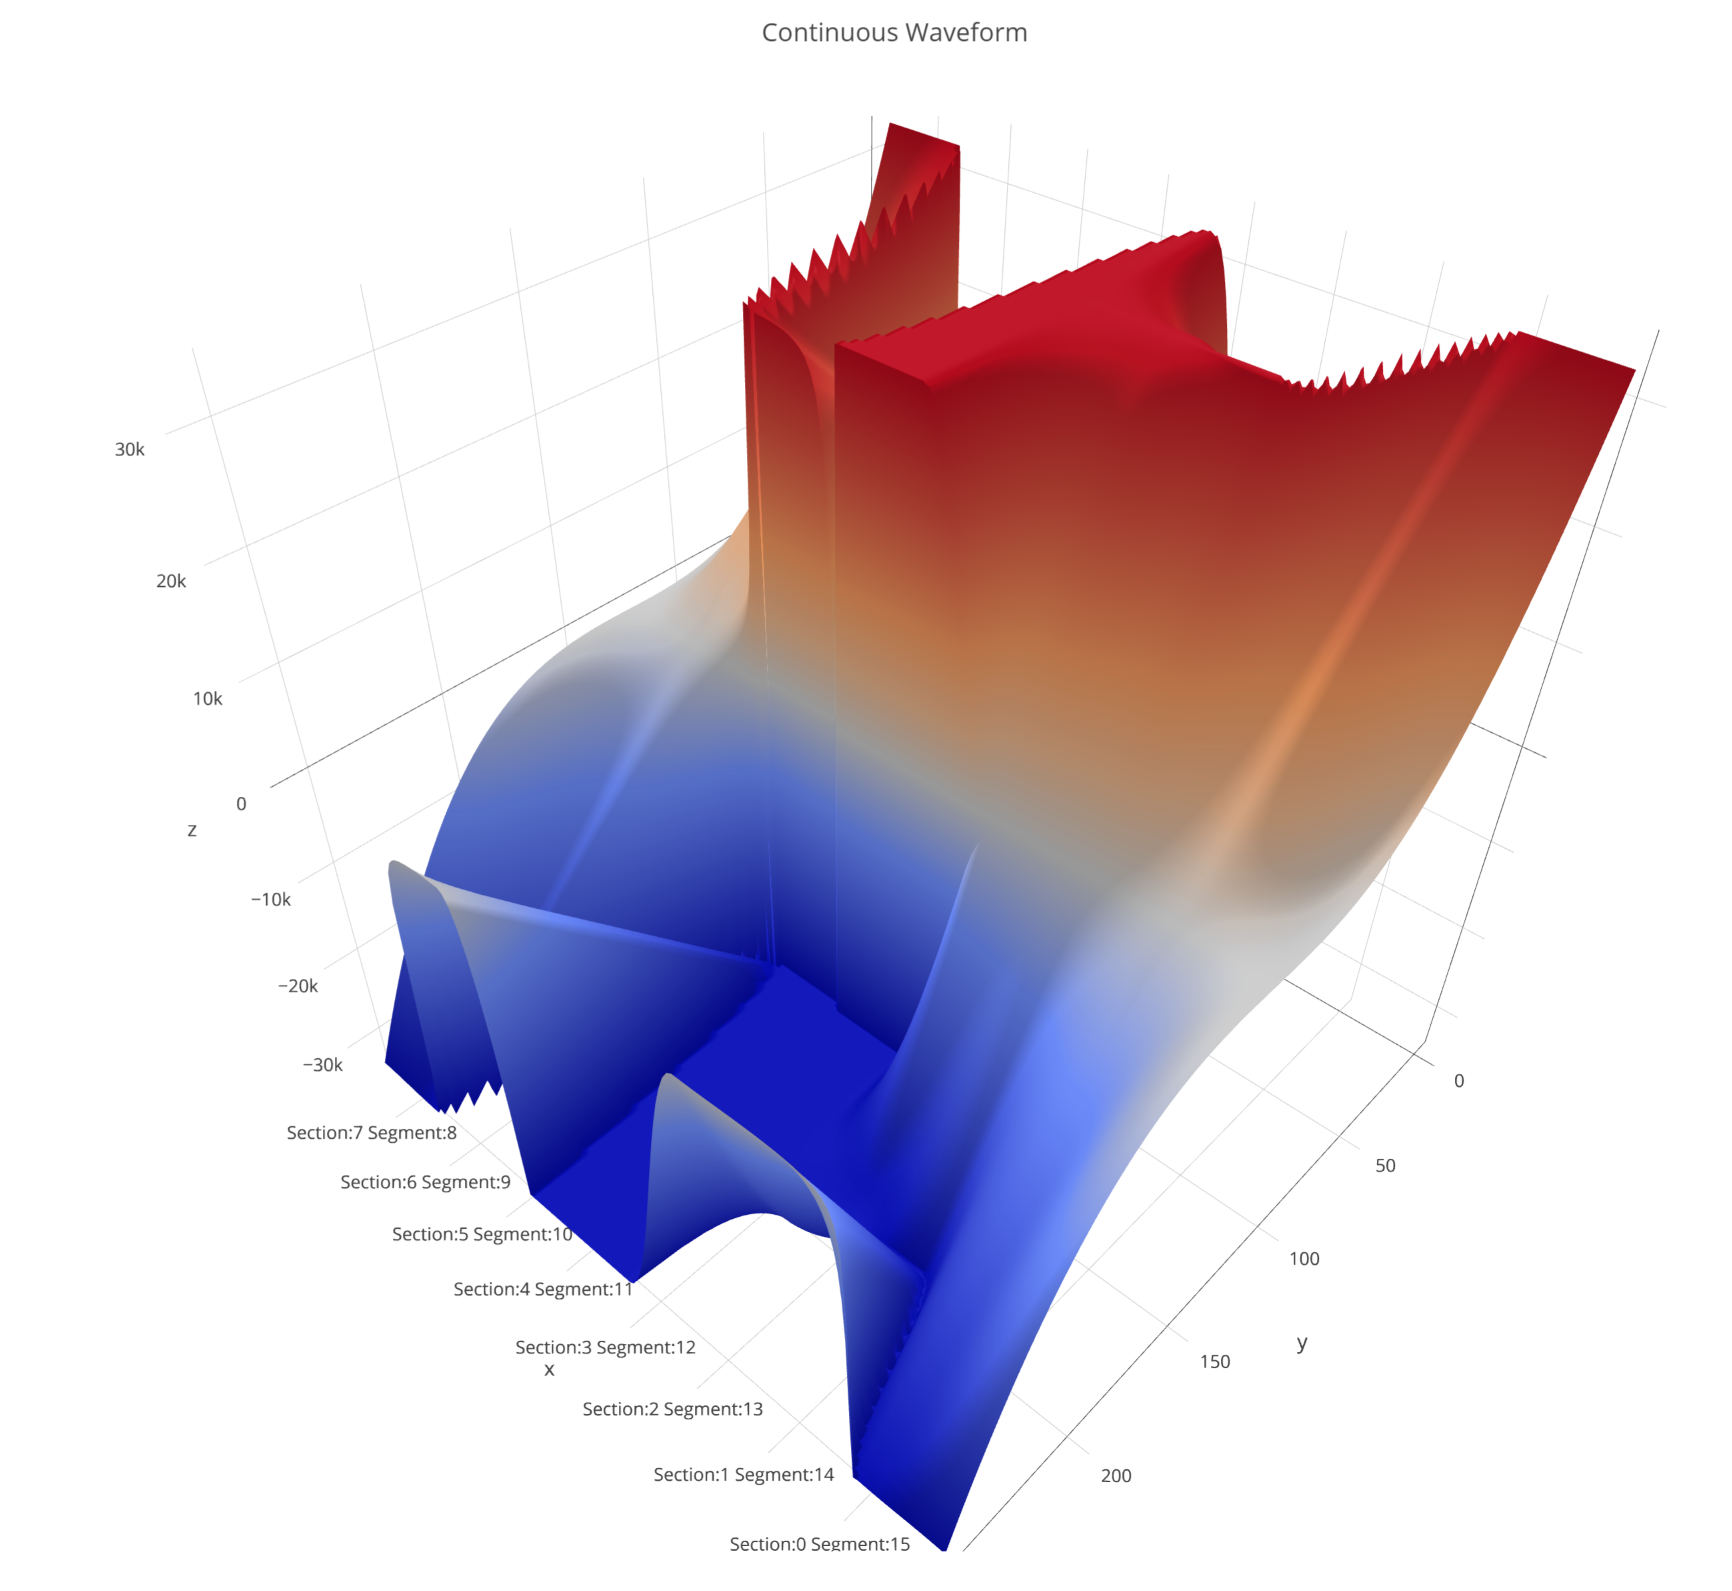
One of the great things about doing this in Plot.ly is that it lets you spin the graph around, which was really handy with a 3d graph like this when I wanted to understand exactly what was going on with the data.
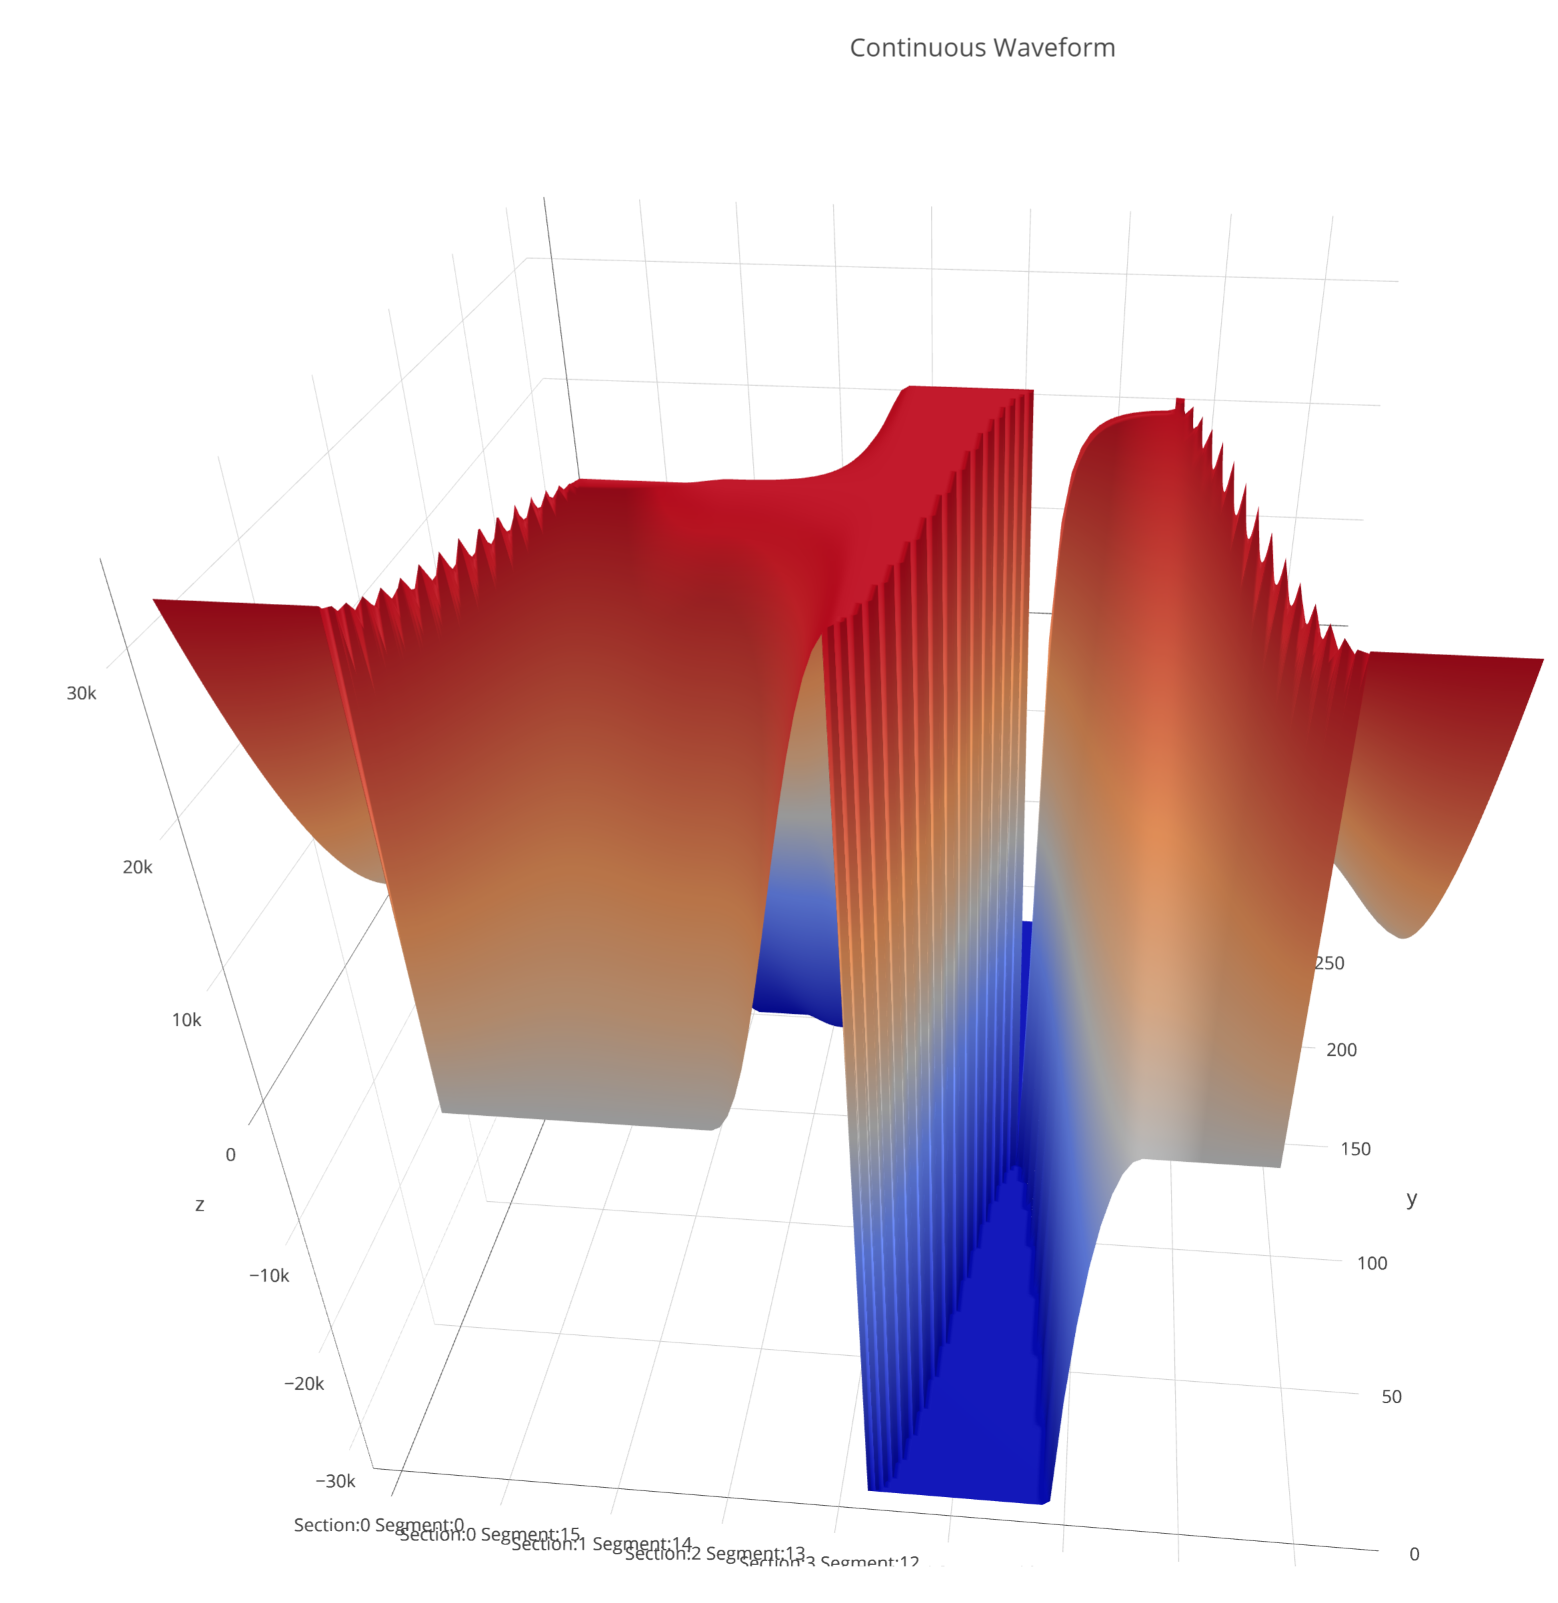
I probably repaired and re-uploaded the data about ten times before I finally got the proper data that you see here.
The next thing was to actually put the data in the program. Surprisingly, I had actually written the code correctly, and even though there were an order of magnitude more waveforms, it actually went in quite smoothly, with minimal changes to the code or the configuration data.
Everything sounded good, but I wanted to give one more test to make sure everything was working as implemented, so I found a PC oscilloscope program called Visual Analyzer (which is very nice and I highly recommend it) and used it to generate this video, which includes not only the time-domain output waveform, but also the unknown pleasures of the frequency domain spectrograph of the sound.
One of these days I'll be able to generate a screen video with a good framerate that isn't compressed to the point of blurriness... the struggle is real!
I initially had some trouble getting the waveform to not jitter and stay on the screen. The "trigger" works pretty well, but not perfectly, especially when I am changing the waveform with the knob. I could turn triggering off, but there was no way I could find to dial in the refresh rate of the scope. Eventually, I just adjusted the pitch of the synthesizer until the waveform stayed on the screen.
At the end of the video, I messed around with multiple oscillators, waveform sync, and filters a little bit. It looks prettier than it sounds...
Discussions
Become a Hackaday.io Member
Create an account to leave a comment. Already have an account? Log In.