The user interface is an often overlooked but highly important aspect of a home automation system. A lot of experimentation and effort has gone into the user interface for the system I'm describing here as it evolved over the years. Initially implemented in Visual Basic Forms which was limited to simple display and control, the next version used Microsoft Silverlight which allowed a more functional interface including animation.
When Microsoft ditched Silverlight I had to re-think the interface again. A native app would have been an easy option but I chose HTML5 which at the time was looking promising and has now evolved to a rich platform for web interfaces and widely implemented now.
Web Interface
The browser is the main interface to the system via a webserver on the hub (an integrated Node.JS Express webserver) which serves up a HTML5 / JavaScript rich client that communicates with the hub server over websockets. The main page displays the header and footer and handles core services like security, navigation tabs and network. JQuery and Twitter Bootstrap libraries are used to make the coding easier. This design pattern is a proven approach for a SPA (single page application) but popular SPA JavaScript frameworks like AngularJS aren't used here as they would complicate things - this system should be considered a framework for home automation as it has an opinionated implementation tuned specifically for home automation use-cases.
What is unique is the use of HTML5 objects to represent all the entities inside a dashboard iframe, there is nothing hard coded, the user picks widgets from a toolbox and drags them to wherever on the screen, resizing if needed and setting attributes via a right-click menu or typing on the widget itself (eg. click on a widget's text and start typing to edit). These widgets can be simple drawing objects like a line or a panel, or richly functional widgets like a graph or lightbulb graphic that subscribes or publishes messages to and from the hub. It is a 'design surface' and works similar to Inkscape or Microsoft Powerpoint giving the user full flexibility about how they want the screen to look. The widgets are fully compliant HTML, CSS and JavaScript leveraging the full power of HTML5 (like SVG for vector graphics) so widgets can look as simple or as complex as you want them to be, including animation.
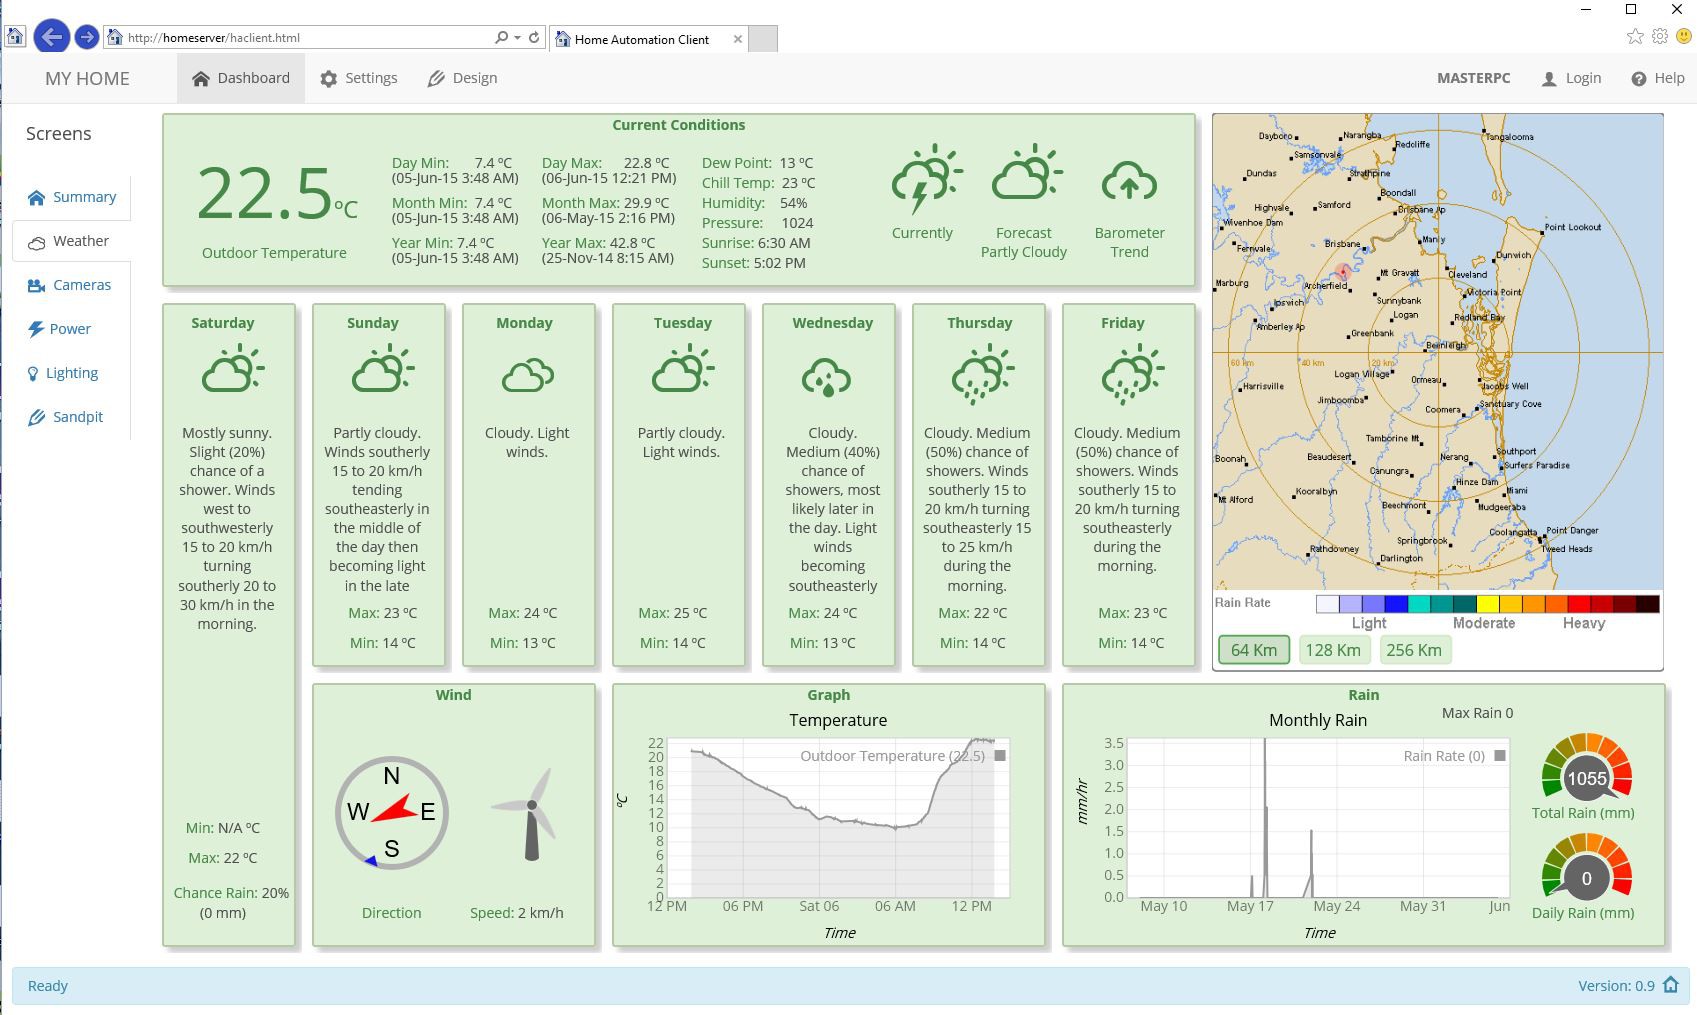
Above is an example of one of the dashboard screens (click to see it in higher resolution). This is the weather tab and it combines feeds from the home weather station (temperature, wind direction and speed, rain and humidity), as well as services from the cloud (the local Bureau of Meteorology 5 day forecast and rain radar), day, month and year highs and lows calculated real time by the transformation module and graphs with data provided by the history (database) module.
The graph widget is particularly interesting as it uses the excellent D3 JavaScript library and the user on a touchscreen can swipe left or right to scroll through history, or pinch to expand the view for more detail. There is also subtle use of animation - the weather radar is a moving slideshow of rain over the last hour, the needle on the dial and compass mimics an analog meter (accelerating from start to final position with some overshoot), the graph line is animated and the windmill rotates proportional to wind speed.
By combining information from different sources with a layout that is sympathetic to the information presented, as well as rich graphics and animation all makes for an intuitive and compelling page. Nothing on this screen except for the header / footer is hard coded - it is all user configured and can be easily re-arranged if needed.
Designing and Configuring Screens
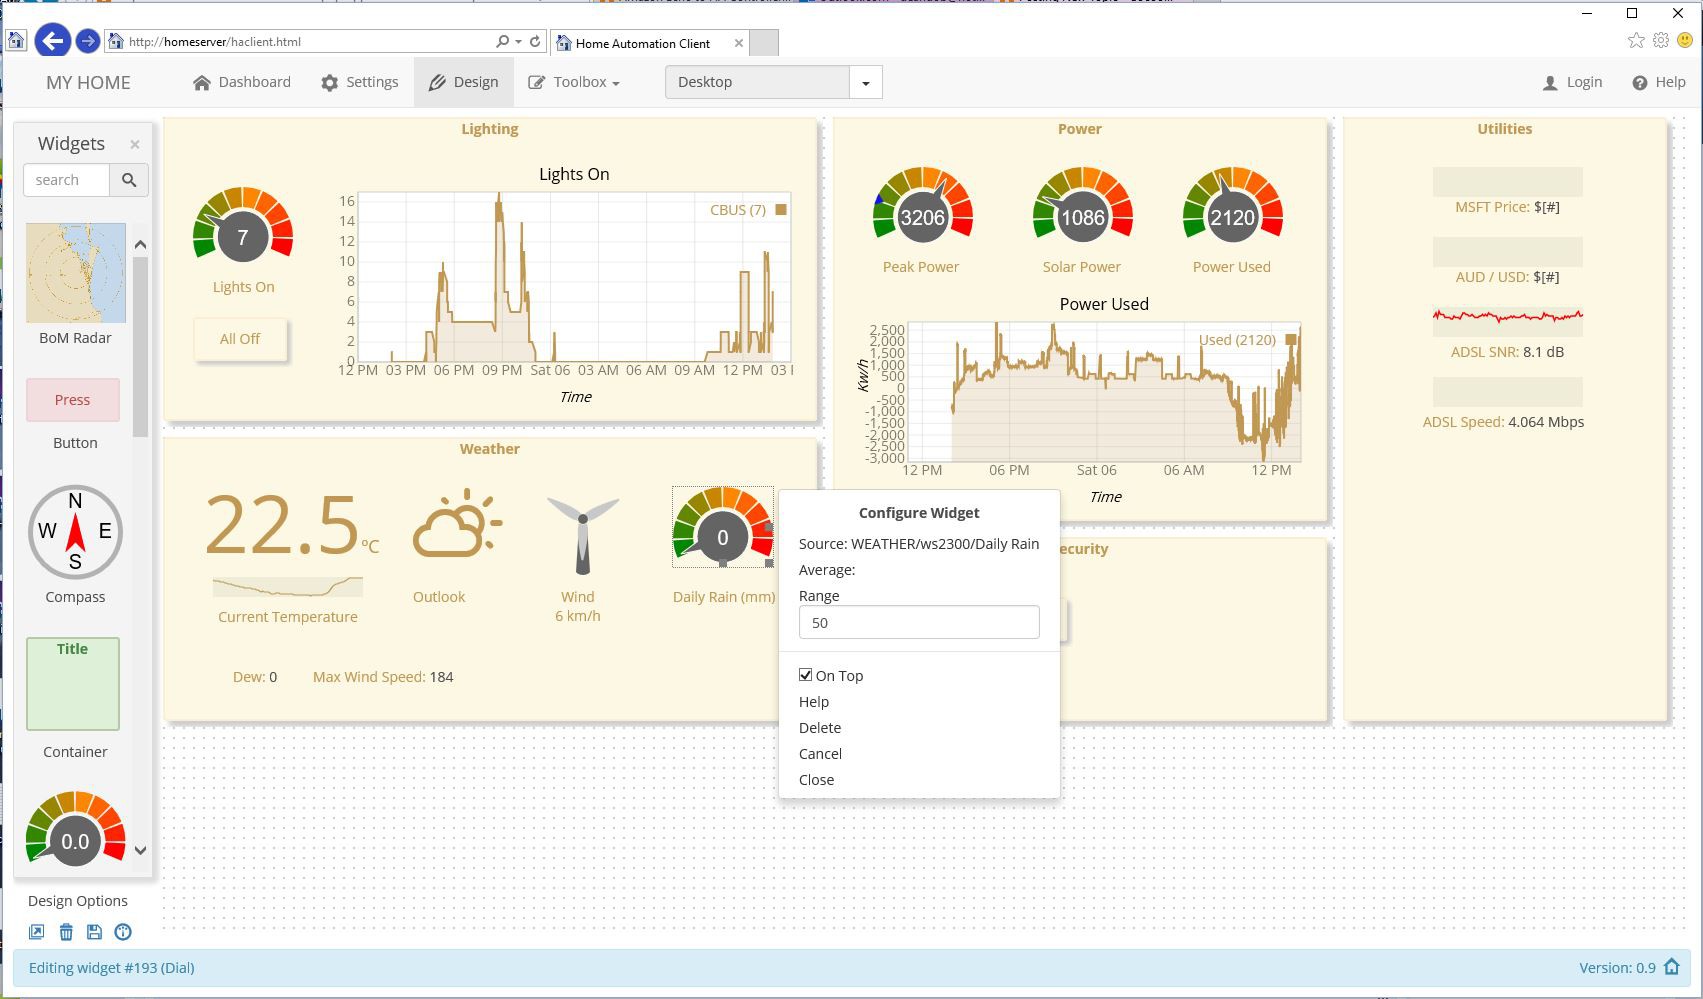
Above is another dashboard screen in design mode for editing (click for higher resolution). On the left you can see the widget toolbox that the user can scroll or search for a widget, drag it onto the design surface and place it or resize it as needed with a mouse (drag the resize blocks on the widget outline). Right click a widget and the widget configuration menu pops up for editing widget attributes as seen with the dial in the center of the screen, with standard attributes like tooltip message if hovering or display on top (if overlapping another widget), as well as widget specific attributes in this case to subscribe to a channel for the dial value and the value range to display.
Widgets
Lets dive deeper into these widgets by taking a closer look at the dial widget as an example of moderate complexity. This dial has 2 indicators, the main needle and a secondary (blue) indicator on the outside of the colored graduations.
Widgets are standalone HTML5 files written in standard HTML, CSS and JavaScript with a little boilerplate HTML and JavaScript. You drop the HTML file into the widget directory (or use the integrated editor available in the settings panel to edit) and it will appear in the toolbox for use.
Below is the HTML code for dial widget.
<!DOCTYPE html>
<html lang="en">
<head>
    <title>Dial Widget</title>
</head>
<body id="body">
    <style>
        body {
            overflow: hidden;
        }
    </style>

    <span id="TBtooltip" data-default="Displays current and average channel values"  />
    <span id="attrib0" data-type="channel" data-name="Source" data-default="" />
    <span id="attrib1" data-type="channel" data-name="Average" data-default="" />
    <span id="attrib2" data-type="input" data-name="Range" data-default="100" />
    <span id="ontop" data-default="true" />

    <div id="group">
        <svg id="widget" width="100" height="80" style="position: absolute; left: 0px; top: 0px; z-index:4">
            <style type="text/css">
                text {
                    font-family: "Helvetica Neue", Arial, Helvetica, sans-serif;
                    font-weight: normal;
                    font-style: normal;
                    font-size: 20px;
                    text-align: center;
                    pointer-events: none;
                }
            </style>

            <g id="svgGroup" style="position: absolute; left: 0px; top: 0px;">
                <g id=" noScale">
                </g>
                <g id="scale">
                    <path id="seg1" fill="none" stroke="rgb(0, 134, 0)" d="M13.46,66.27 A40,40,0,0,1,10.1,52.79" stroke-width="20" />
                    <path id="seg2" fill="none" stroke="rgb(50, 134, 0)" d="M10.01,50.7 A40,40,0,0,1,12.18,36.98" stroke-width="20" />
                    <path id="seg3" fill="none" stroke="rgb(100, 134, 0)" d="M12.91,35.02 A40,40,0,0,1,20.27,23.23" stroke-width="20" />
                    <path id="seg4" fill="none" stroke="rgb(150, 134, 0)" d="M21.72,21.72 A40,40,0,0,1,33.1,13.75" stroke-width="20" />
                    <path id="seg5" fill="none" stroke="rgb(200, 134, 0)" d="M35.02,12.91 A40,40,0,0,1,48.6,10.02" stroke-width="20" />
                    <path id="seg6" fill="none" stroke="rgb(255, 134, 0)" d="M50.7,10.01 A40,40,0,0,1,64.33,12.66" stroke-width="20" />
                    <path id="seg7" fill="none" stroke="rgb(255, 100, 0)" d="M66.27,13.46 A40,40,0,0,1,77.79,21.23" stroke-width="20" />
                    <path id="seg8" fill="none" stroke="rgb(255, 70, 0)" d="M79.25,22.72 A40,40,0,0,1,86.82,34.37" stroke-width="20" />
                    <path id="seg9" fill="none" stroke="rgb(255, 35, 0)" d="M87.59,36.32 A40,40,0,0,1,90,50" stroke-width="20" />
                    <path id="seg10" fill="none" stroke="rgb(255, 0, 0)" d="M89.95,52.09 A40,40,0,0,1,86.82,65.63" stroke-width="20" />
                    <polyline id="avg" points="44,0 56,0 50,8 44,0" fill="rgb(20, 20, 230)" stroke-width="0" style="display: none" transform="rotate(-112, 50, 50)"><title id="avgtool">Average: 0</title></polyline>
                    <path id="TBNeedle" fill="rgb(100, 100, 100)" stroke="rgb(255, 255, 255)" stroke-width="1" d="M24.39,54.51 A26,26,0,1,1,27.6,63 l-20,4 Z" />
                    <text id="TBNumVal" x="36" y="58" fill="rgb(255, 255, 255)">0.0</text>
                </g>
            </g>
        </svg>
        <svg id="needle" style="position: absolute; left: 0px; top: 0px; transform-Origin: 50% 62.5%; z-index:2">
            <path id="svgNeedle" fill="rgb(100, 100, 100)" stroke="rgb(255, 255, 255)" stroke-width="1" d="M24.39,54.51 A26,26,0,1,1,27.6,63 l-20,4 Z" />
        </svg>
        <svg id="text" style="position: absolute; left: 0px; top: 0px; z-index: 3">
            <text id="numVal" x="36" y="58" fill="rgb(255, 255, 255)">0.0</text>
        </svg>
    </div>

    <script src="../widgetFramework.js"></script>
</body>
</html>
The <span> tags are not exposed in the user interface and are used to describe the widget semantics to the dashboard framework and settings edited through the right click widget edit menu.
- The first span holds the text for the tooltip popup when a mouse hovers over the widget in the toolbox in design mode (displaying the tooltip is handled automatically by the dashboard).
- The second and the third spans describe the two automation channels that this widget subscribes to - the channel that the dial needle responds to, and a secondary indicator that spins around the edge of the dial to represent an average value.
- The last two span descriptors are settings for the dial range (eg. 0 - 100 for scaling the dial value over the swing range of the needle) and if the widget should be in the foreground or background when rendered (eg. a container widget should be in the background).
The dashboard framework will expose these settings when you right click the widget when in design mode using an attribute menu, and the menu behavior is defined by the 'data-type' (eg. a channel list so that the user can select a channel which are subscription / publish feeds from the server, or an input to prompt the user to enter a value). These settings are stored on the server and the dashboard framework will customise the widget based on these settings when loading at startup.
The rest of the HTML is embedded SVG which is a vector graphics language used by modern browsers to draw sophisticated shapes.
- The first section describes the font for the number display in the middle of the dial.
- The second bit with the <path> tags draws the outer colored segments of the dial, the inner needle, outer secondary indicator and center.
Any vector graphics drawing app can be used to draw the widget shape (eg. Google's svg-Edit) then you simply copy the SVG code into the widget HTML. I like SVG as you can create visually pleasing and sophisticated widgets and they scale nicely if the user adjusts the widget size, but you could also use the HTML5 canvas commands for simpler graphics without the added complexity of SVG.
The final script tag brings in some of the common dashboard framework functionality and makes it easy for the widget to communicate with the framework through a separate javascript file that all widgets share.
Here is the widget JavaScript (not shown in the HTML above).
        var needleID = document.getElementById("needle");		    // id of the path to rotate
        var svgNeedle = document.getElementById("svgNeedle");		// id of the path to rotate
        var numID = document.getElementById("numVal");		        // id text field
        var svgText = document.getElementById("text");		        // id of text SVG
        var avgID = document.getElementById("avg");                 // id average marker
        var oldVal = 0;

        // Called from framework when widget starts
        function widgetStart(param) {                               // widget specific startup
            range = parseInt(_attribs[2].value);
            if (_attribs[1].value !== "") avgID.style.setProperty("display", "inline");
            // Hide the svg used to display the widget in the toolbox for proper drag/drop (can only drag id=widget SVG element) & put dial face in background
            document.getElementById("TBNeedle").style.setProperty("display", "none");
            document.getElementById("TBNumVal").style.setProperty("display", "none");
            _widgetID.style.setProperty("z-index", "1");
            return true;
        }

        function startDesign() {            // called when switching to design mode
        }

        function endDesign() {            // called when switching to design mode
        }

        function startEdit() {              // called when editing started
        }

        function endEdit(param0) {                                  // called when editing finishes
            if (_attribs[1].value !== "") avgID.style.setProperty("display", "inline")
            else avgID.style.setProperty("display", "none")                             // Only display average marker if channel is set
        }

        function scale(scaleX, scaleY) {    // manage scaling
            numID.setAttribute("transform", "scale(" + scaleX + "," + scaleY + ")");
            svgText.setAttribute("transform", "scale(" + scaleX + "," + scaleY + ")");
            svgNeedle.setAttribute("transform", "scale(" + scaleX + "," + scaleY + ")");    // scale needle
        }

        // Called from framework for incoming channel events
        function feed(channel, scope, data) {
            var numeric = parseFloat(data);
            if (isNaN(numeric)) return;
            if (channel === _attribs[0].value.split("/")[2]) return rotateDial(numeric);
            if (channel === _attribs[1].value.split("/")[2]) return setAvg(numeric);
        }

        // Called from framework for initial channel status
        function ini(channel, scope, data) {
            return feed(channel, scope, data);
        }

        // Set the average indicator
        function setAvg(avgVal) {
            document.getElementById("avgtool").textContent = "Average: " + avgVal;
            if (avgVal > range * 1.05) avgVal = range * 1.05;                       // allow a little overrun
            if (avgVal < range * -0.05) avgVal = range * -0.05;                     // allow a little underrun
            var angle = parseInt(avgVal * 227 / range - 114);
            avgID.setAttribute('transform', 'rotate(' + angle.toString() + ' 50 50)');
        }

        // Rotate dial between old and new
        function rotateDial(newVal) {
            var textVal = newVal;
            var newVal = Math.abs(newVal);
            if (newVal > range * 1.05) newVal = range * 1.05;                       // allow a little overrun
            if (newVal < range * -0.05) newVal = range * -0.05;                     // allow a little underrun
            if (range > 10) {                                                       // format displayed range
                numID.textContent = Math.round(textVal);
            } else {
                numID.textContent = Math.round(textVal * 10) / 10;
            }
            numID.setAttribute("x", (document.getElementById("widget").clientWidth / 2 - numID.getBBox().width / 2));       // Adjust number to be center
            needleID.style.setProperty('transition', 'transform ' + Math.abs(newVal - oldVal) * 2 / range + 's cubic-bezier(0.680, -0.550, 0.265, 1.550)');
            needleID.style.setProperty('transform', 'rotate(' + newVal * 223 / range + 'deg)');
            oldVal = newVal;
        }
Lets go over these functions and describe their use.
- The 'widgetStart' function is called by the framework when the widget is first loaded into the dashboard and all the initialization code goes here. The _attribs[] array data is provided by the dashboard framework and stores this widget instance's setting (eg. if there is no secondary channel set when the widget was setup during design mode, it won't display the secondary value indicator).
- The empty functions below the widgetStart function are optional and will be called when the dashboard enters or exits design mode, and when starting or finishing editing the widget properties in the designer. This allows the widget to do different things during design time and can be very useful for more sophisticated widgets (eg. add more design time functionality in addition to the standard design features all widgets inherit from the framework). In this example, if the secondary channel isn't set, the secondary indicator marker on the dial is hidden, a small but nice touch possible with only needing a line of code.
- The 'scale' function handles how you scale the widget HTML/SVG entities when the user edits a widget and uses the mouse on one of the scale 'handles' to expand or contract the widget size. The framework will automatically scale simple widgets but sometimes you need the scaling logic to be different which you can implement in this function. Here a CSS transform function is used on the needle and text.
- The 'feed' function is called by the framework when there is an event that the widget has subscribed to. Here we direct the incoming message depending if it is for the primary channel (attrib0 - the needle) or the secondary channel (attrib1 - the secondary blue indicator).
- The 'ini' function is called once loaded to provide the initial data. The automation framework maintains state of all events so when the browser first launches the framework sends the current channel state to the widget via this function. So it is similar to the feed function (that receives all real-time events) but is separate as you may want to do some initial work on the state data. Here we don't care, so we call the feed function to display the initial value
- The next two functions are specific to the dial widget, and animate the needle and secondary indicator. Here we take advantage of CSS3 functionality by using a nice Bezier curve to vary the acceleration rate of the needle so it feels like a real dial needle - it accelerates quickly from 0, and if the dial has to swing a long way on the dial it will overshoot the mark a bit and smoothly return to the true setting.
The above may look a little daunting at first glance but anyone who can do basic web development can tackle this - it isn't that much code to create a graphical, functional and animated widget as most of the heavy lifting is done by the dashboard framework behind the scenes or HTML5 functionality. All with standard HTML/CSS/JavaScript so anything you can do in HTML5 can be used in a widget, enabling you to utilize the full power of the web ecosystem for the dashboard.
Remote Access
Being able to access the automation system when away from home is a fundamental feature. Instead of having to punch a hole in the home internet router firewall it uses a web service in the Cloud (Microsoft Azure in this case) to act as the remote web server and to accept and proxy the websockets call back to the home hub server. The hub server calls out to the Cloud web service to setup a permanent websockets channel between the home hub and the Cloud.
This approach has a number of advantages:
- No need to setup complex firewall rules on the internet router, which can be troublesome or insecure
- HTML files that run the dashboard including widgets are available in the Cloud making for faster performance, especially if your home has a slower internet connection.
- The Cloud Service can act as a gateway for integrating with other Cloud Services, like the Alexa voice service.
GitHub repository sync is used to keep the files in sync between the home hub and the Azure web service.
Security is also important as you don't want unauthorized access to the house information or even worse control of devices like the front gate. Better security is on the to-do list, currently I use a simple password and rely on obscurity. Security will be based on device token authentication which also caches username, once a device is authenticated it will reuse the token so that you don't always have to logon to access the system which would be annoying, although it assumes the authenticated devices are secure.
Mobile
Being able to access the home automation system on a smartphone is a common requirement. I spent some time investigating the best way to have a mobile interface as rich as the one developed for the web. Should I use a mobile framework like Xamarin or build a native app? What about making it 'responsive' (adjusting for the small form factor) by replacing Bootstrap with a UI library that was designed for mobile? I wasn't keen on doing too much development specifically for mobile and especially to support multiple mobile platforms.
Then I realised that all the effort that went into the flexibility of the desktop / tablet interface was just as appropriate (if not more so) for smartphones. No need for a native app with offline ability as you need to be connected to the web to get to the home automation system anyway, and a well written HTML5 web app will be as responsive and functional as a native app and work on any mobile platform. All I had to do to optimize for smartphone use was have the dashboard recognize the smaller screen size and use dashboard screens setup for mobile (exactly the same as a desktop dashboard screen except the screen width is smaller), and even the Bootstrap functions like the navbars being responsive switched automatically to suit the smaller screen width. Even the dashboard design functionality works on the smartphone however a desktop is better due to speed and better control of the UI.
As all the front end code is written in standard JavaScript without the overheads of a framework like AngularJS performance on the phone is good. The remote access infrastructure outlined in the section above is used by the mobile browser the same way as the desktop / tablet browser.
Below is a picture of a mobile screen (fully user configurable just like the desktop browser screens), the graph is showing the day history of power use (green) and solar power generated (blue - it was a cloudy day).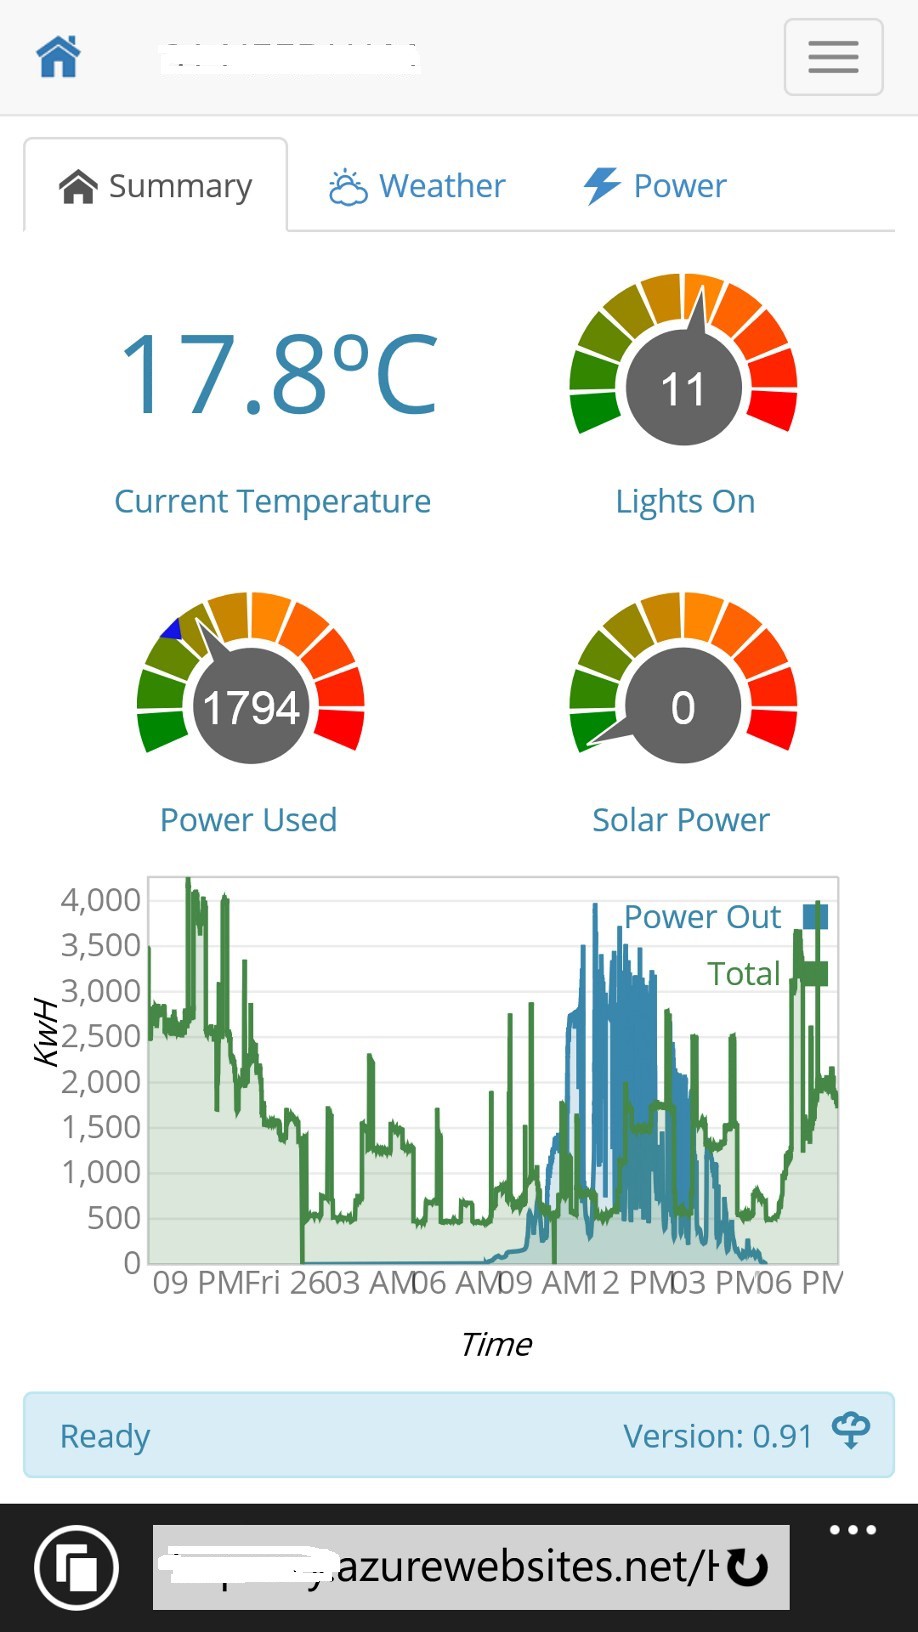
Conversational Interface
Voice is the most natural way for us to interact with others, and clearly is going to be the future when you see concepts like Iron Man's Jarvis. That future is almost here (the voice recognition and synthesis at least) as the quality of voice recognition in the last 5 years has jumped significantly with services like Siri, Cortana and Alexa. I have an Amazon Echo and am constantly amazed at how well it understands me, even from afar, the error rate is very low. I don't think that Cloud Services are a good fit for the automation engine but the sheer compute power of the Cloud is perfect to improve the quality of voice recognition and it shows. Even the latency is pretty good but there is still an (acceptable) pause.
My Alexa connects to the home hub via Microsoft Azure Web Services used for remote access which converts the speech strings into the home automation message format. At this point it is pretty basic (your sentence needs to be structured so that the class and instance message fields can be translated - although synonyms help). This is just the start and I intend to continue experimenting and expanding the interface so that it moves past voice control / command recognition to a proper conversational interface, using services like Microsoft's CRIS.
The Room as the Interface
The last part of the vision for the user interface is using the room as the user interface. This part of the solution has had several prototypes but not in full time use yet. The concept is to have a 'mini hub' in each room that orchestrates the activities in the room, as follows:
- Audio amplifier to power in-room speakers for music and voice synthesis
- Motion sensors and proximity sensors
- Security sensors like window open sensors
- Microphone for speech recognition
- Camera for a video intercom
- Small touchscreen
A Raspberry Pi could fill this function and I have been prototyping the intercom and have PCB designs ready for the audio amplifier and Power over Ethernet (see my other hackaday projects here and here). The prototype I have in mind is the size of a light switch with a 5" LCD touchscreen, mounted next to the light switches and uses the same HTML5 dashboard but with screens designed for the form factor (similar to the smartphone screens). The LCD touchscreen driver is what is in development at the moment. Another interesting alternative is a small form factor PC running Windows 10 (full not the IoT version) with an integrated capacitive touchscreen that I have on order (GOLE1 for $79).
Summary
This approach to the user interface has meant that I can address many of the key points outlined earlier for a successful home automation system - user personalisation, integration and transformation of raw data to create useful information, infinite layout possibilities, available via multiple channels like voice, mobile through the use of very rich and functional display entities (widgets). The web interface is expressive, easy and fun to use - it has been interesting seeing how my kids and wife knock up their own screens with their interpretation of how they want to manage the house.
Discussions
Become a Hackaday.io Member
Create an account to leave a comment. Already have an account? Log In.