 helge
helge Sensors deployed in industrial applications tend to work quite reliably, until they don't. Typical failure modes include
- cable breaks
- water ingress and electrocorrosion
- contamination with process media
- range and drift (mechanical, electrochemical)
- wear (abrasive, temperature cycles, cyclic bending, vibrations)
- mishandling / contact with other components / machinery
- voltage surges
Transferring these expectations to the reservoir scale scenario, a few points seem seem rather likely right out the gate:
- cable damage / unplugged conntectors: consumer products will have cheaper cables and connectors
- water ingress: sealed connectors are expensive, so unless there is some intrinsic protection against spashes, this may well be an issue
- electrocorrosion: moist contamination spells trouble while conformal coating and sealed assemblies add cost. Keep peripherals powered off most of the time, only activate for brief periods. Maybe also add simple means to detect moisture if possible.
- changes in full-scale value and drift: depending upon the measurement principle, yielding of metal and plastic parts is to be expected, changing the output. To be evaluated at design time.
- plastic deformation: parts subjected to static or cyclic loads can accumulate strain, leading to dimensional changes and hardening. To be evaluated at design time if possible.
Assuming proper handling and controlled conditions, temperature and deformation effects can be investigated... and that's what we're going to do now.
Measurement setup
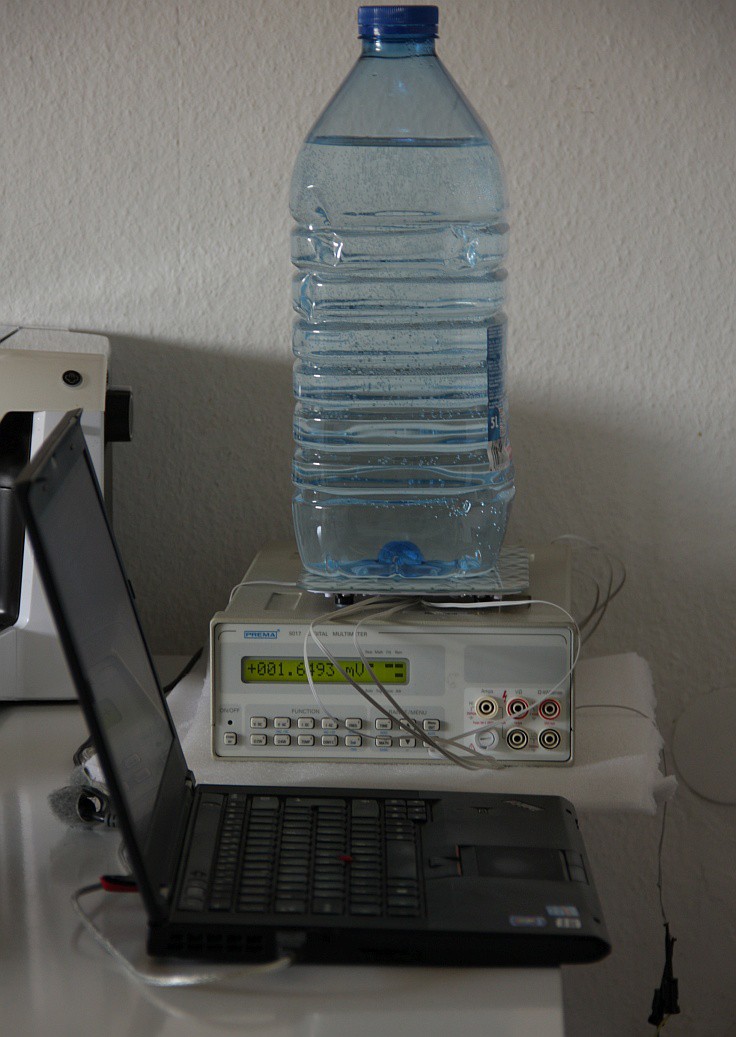
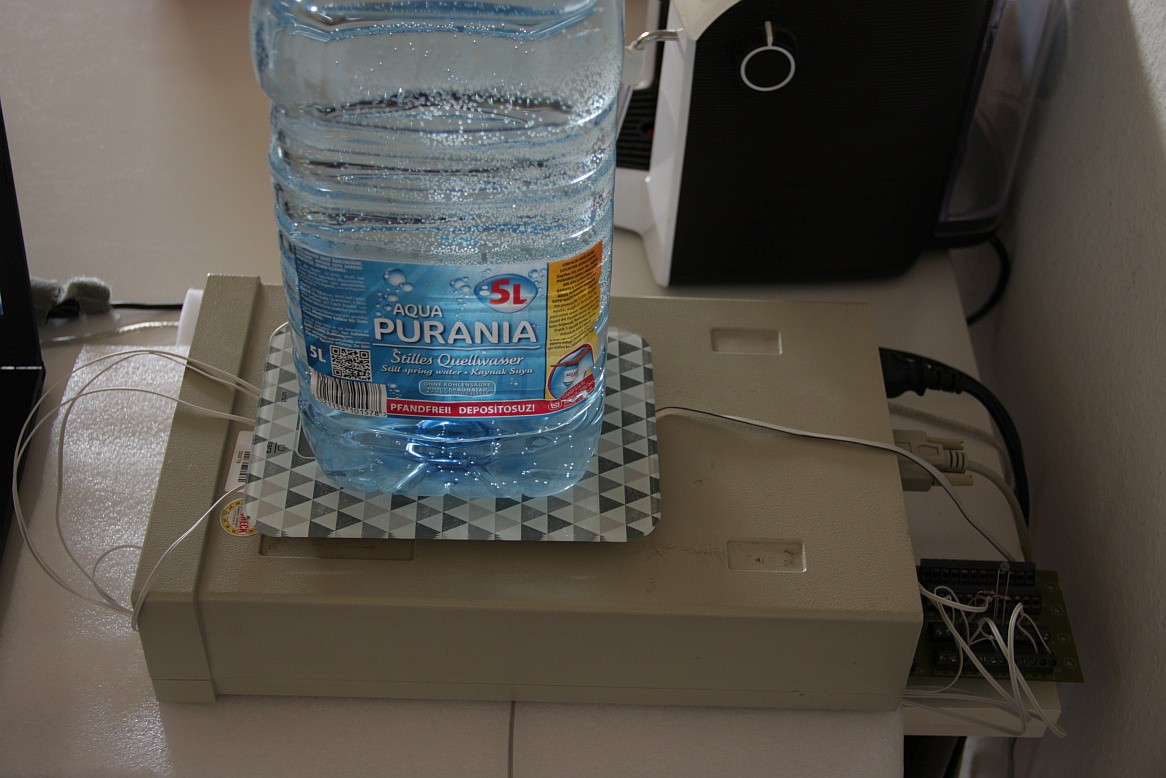
One of the modified scales is set up on the windowsill and loaded with 5kg to investigate loss of calibration after a few days of static loading with the maximum permissible weight.
Another scale with both the internal electronics and a HX711 board connected is powered with 5V into the HX711 (SCK needs to be pulled to GND to enable AVDD). This device has four cable pairs connected to the sense and excitation pins.
All are connected to a multichannel digital multimeter:
- excitation voltage (E+ | E-)
- sense voltage (S+ | S-)
- partial voltage (S+ | E+)
- partial voltage (S- | E+)
- 10k NTC (rear panel PCB / air temperature)
- reference short circuit for 300mV range (same as 2.)
A rear panel PCB has screw terminals to hook up wires and an NTC sensor. In a later measurement, an additional short circuit on channel 6 was added to investigate instrument drift error during the measurement sequence.
a python script initializes and periodically reads values from individually configured input channels. Git repository:
https://github.com/MisterHW/pyPrema5017SC
Results
A first run is conducted through the night to determine offsets and intial settling under full load. The measurement consists of three parts to measure initial offset without any applied voltage, no-load offset of the load cell and fullscale output with a 5kg weight placed on the scale. note the strain gauge output is in millivolt while the excitation voltage is displayed in Volt.
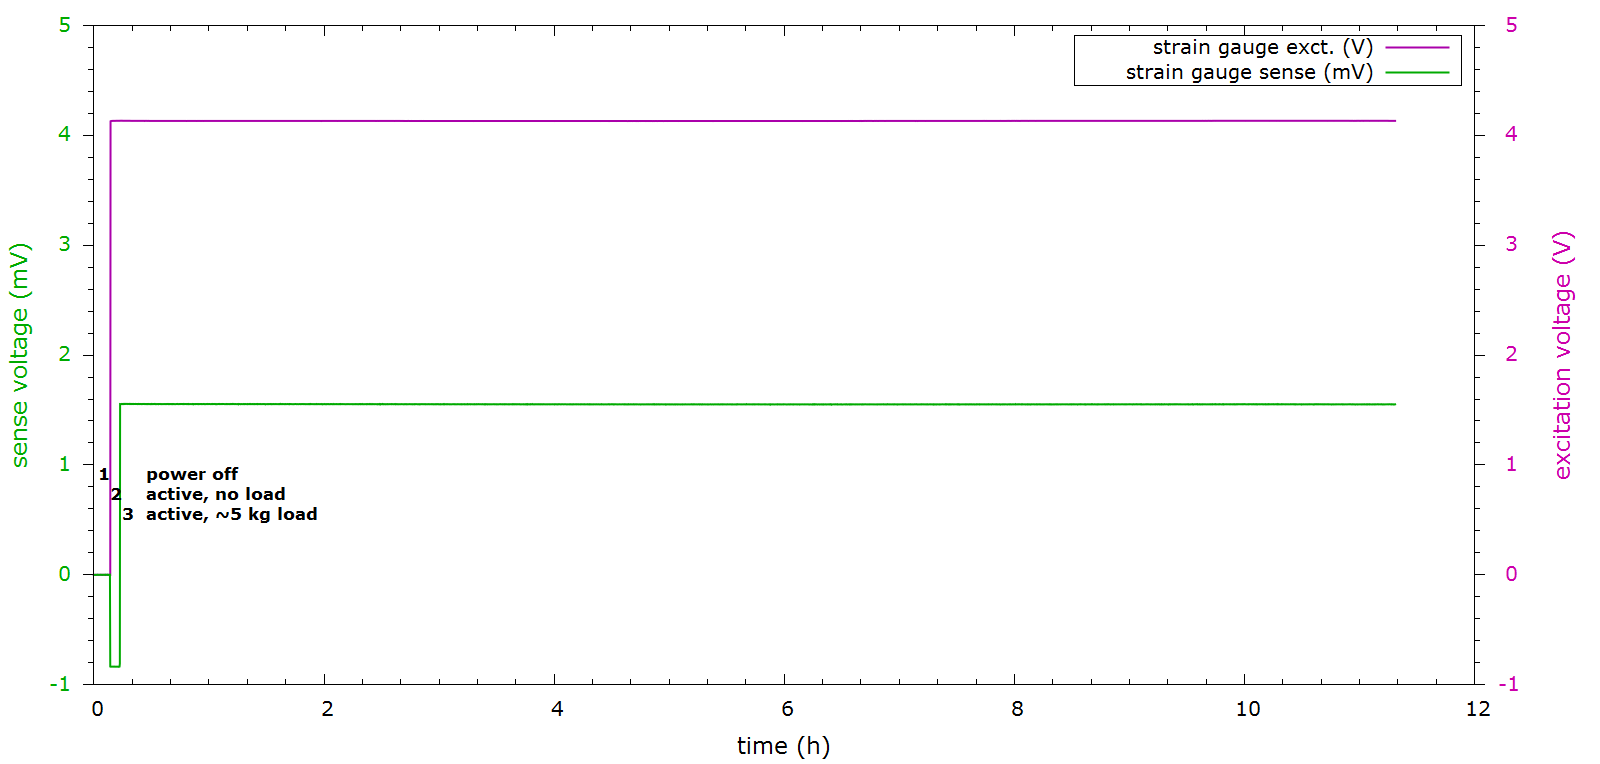
In this graph the instrument error of 74 µV has already been compensated for to better represent the strain gauge output. Y axes ranges are chosen arbitrarily to highlight relative changes over the measurement period after power-up.
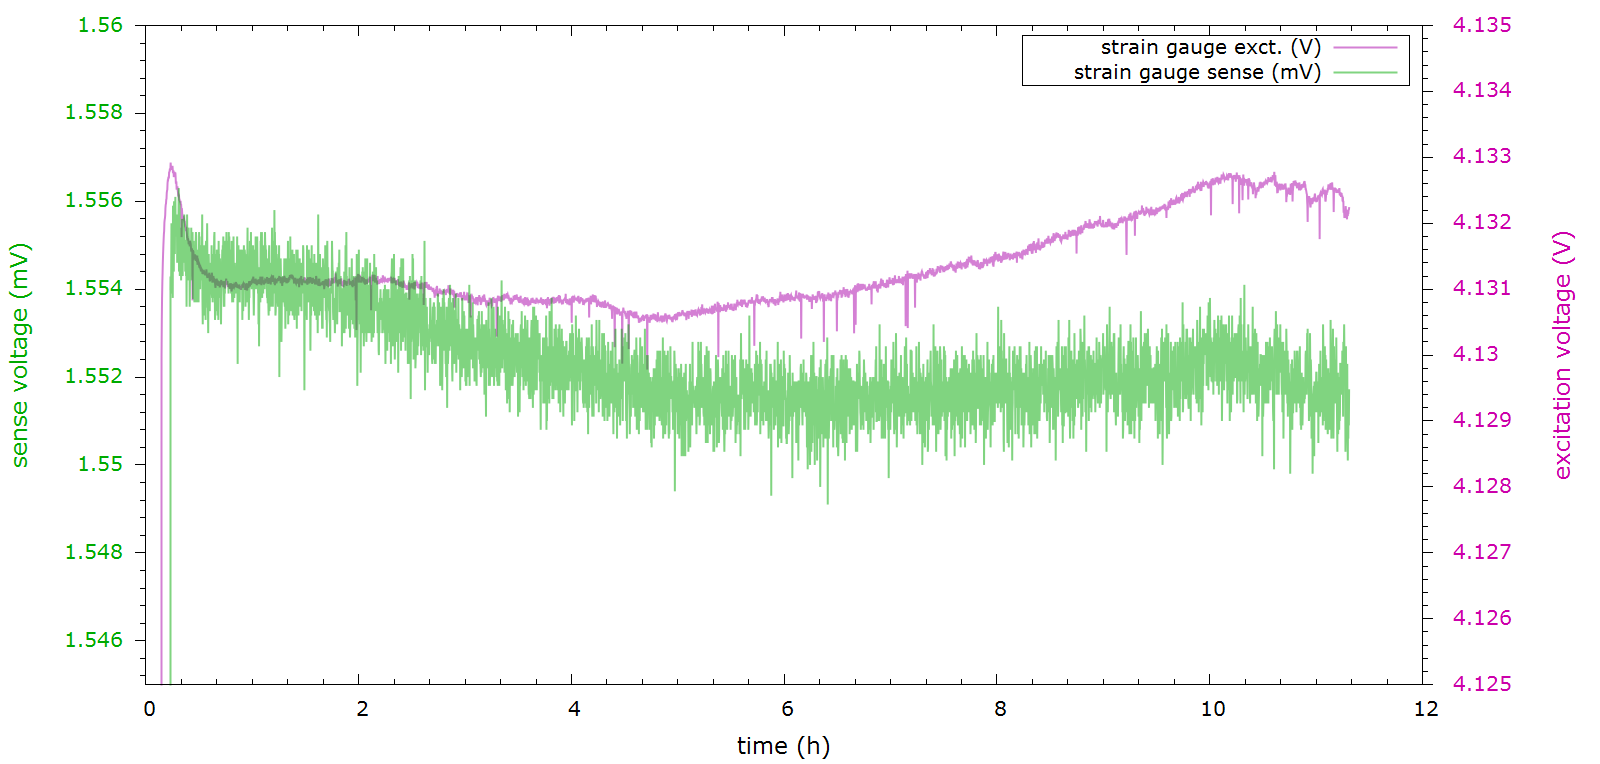
The measurement was halted to add a 10k NTC senor and test changes to the code, then restarted. Restart might cause the multimeter to calibrate zero, although it is later found that the offset remained at around 74 µV.
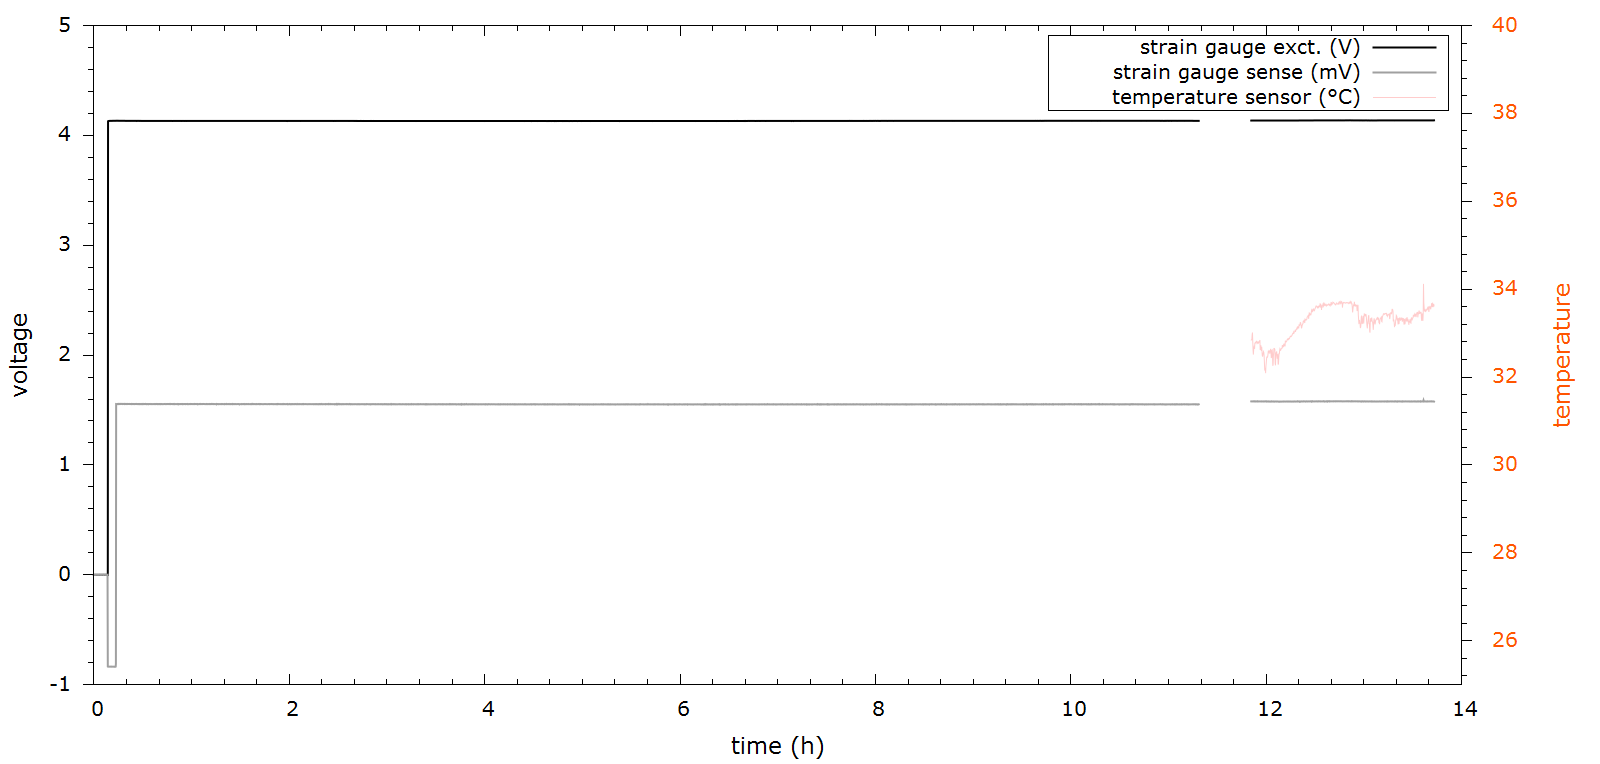
Note the restarted strain gauge sense voltage appears to be slightly higher than in the initial run.
There is hardly a change between the 2nd and 3rd run:
The last plot shows both sense voltage and temperature over time, illustrating the 25..30 µV jump upon restart.
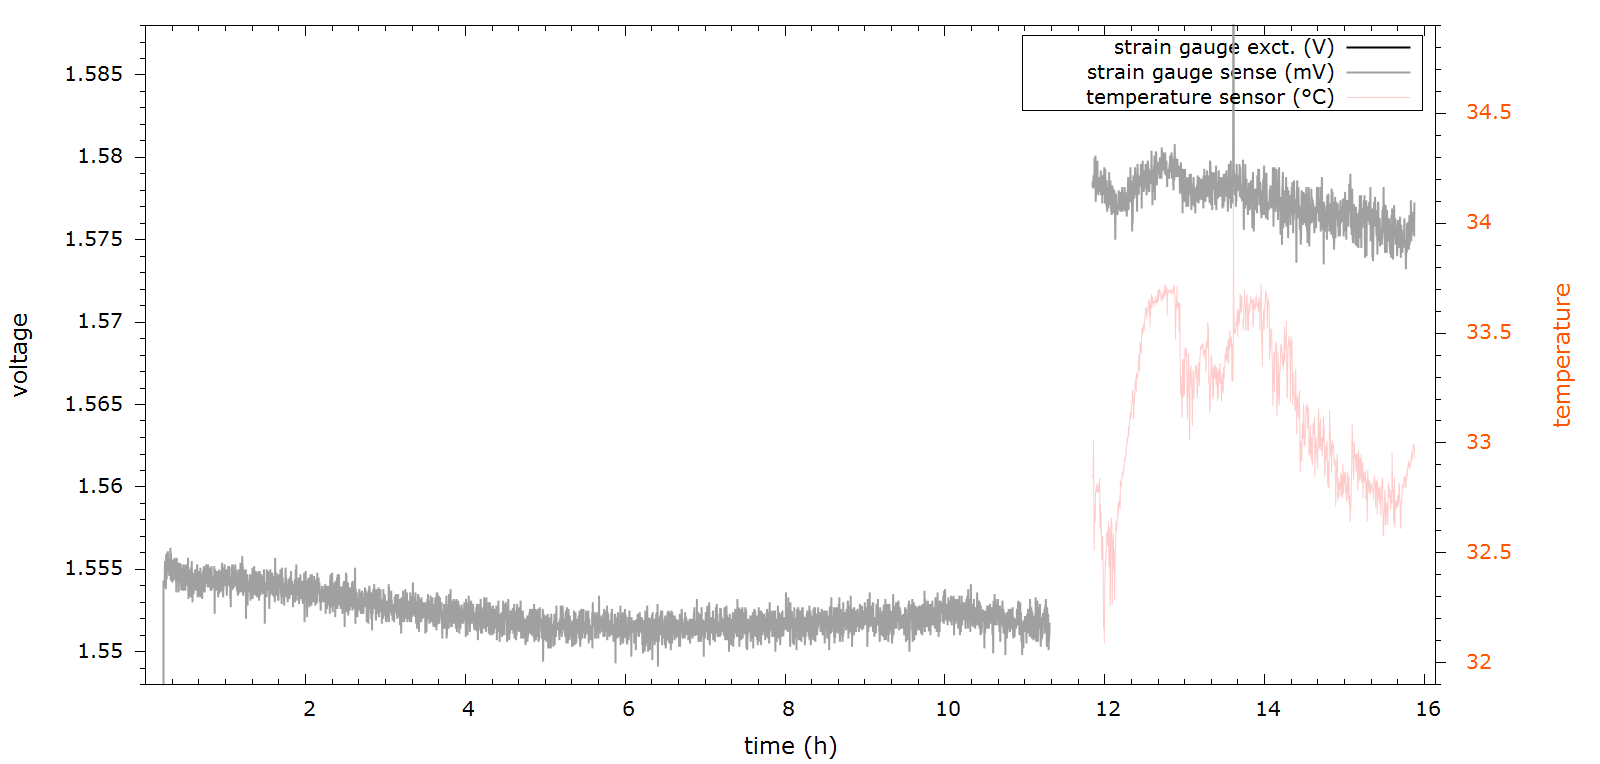
To better understand temperature effects, the experiment will continue for as long as I can keep it here in the kitchen. A longer term experiment (maybe also with a stepper motor that lifts and lowers the weight) can be set up in the lab elsewhere.
Conclusion
A logging setup that monitors excitation and sense voltage of steel spring element strain gauges connected to an HX711 frontend IC has been presented in an effort to investigate drift of the sensed and excitation voltages over time and temperature changes. The extended measurement setup also quantifies drift of the voltmeter which is found to be within +/- 2 µV (1st vs. 3rd measurement).
The initial strain gauge drift is found to be around 0.5%.
Based on these preliminary observations the investigated strain gauge type appears to be well suited for water reservoir monitoring. Possible sensor failure can be detected under operation when a pump removes water from a full reservoir with a known rate.
Outlook
Further investigations should also include aluminium single point strain gauges and investigate hysteresis and yield under load cycles :-)
ps. auto power off
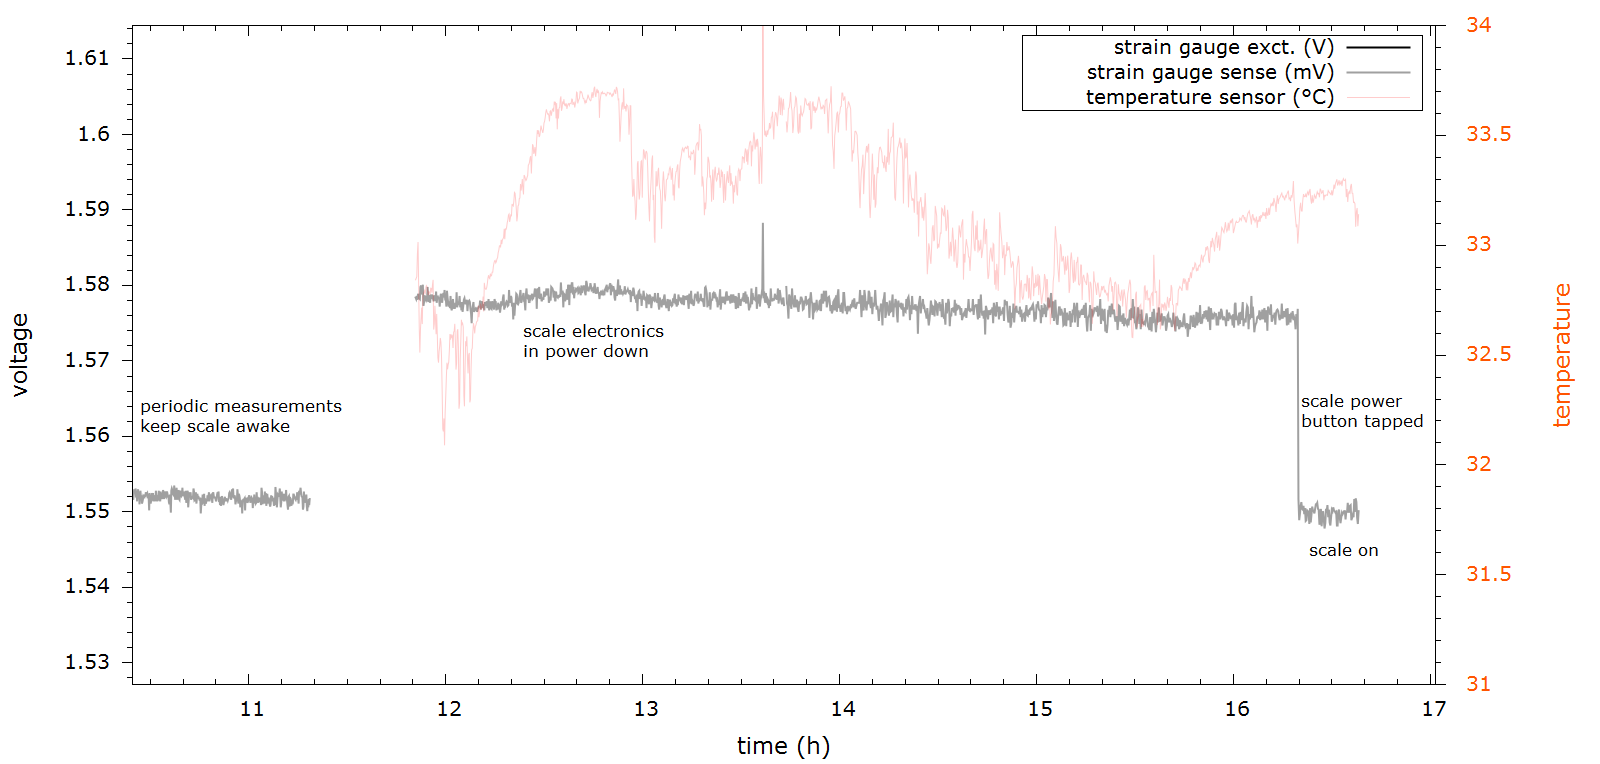
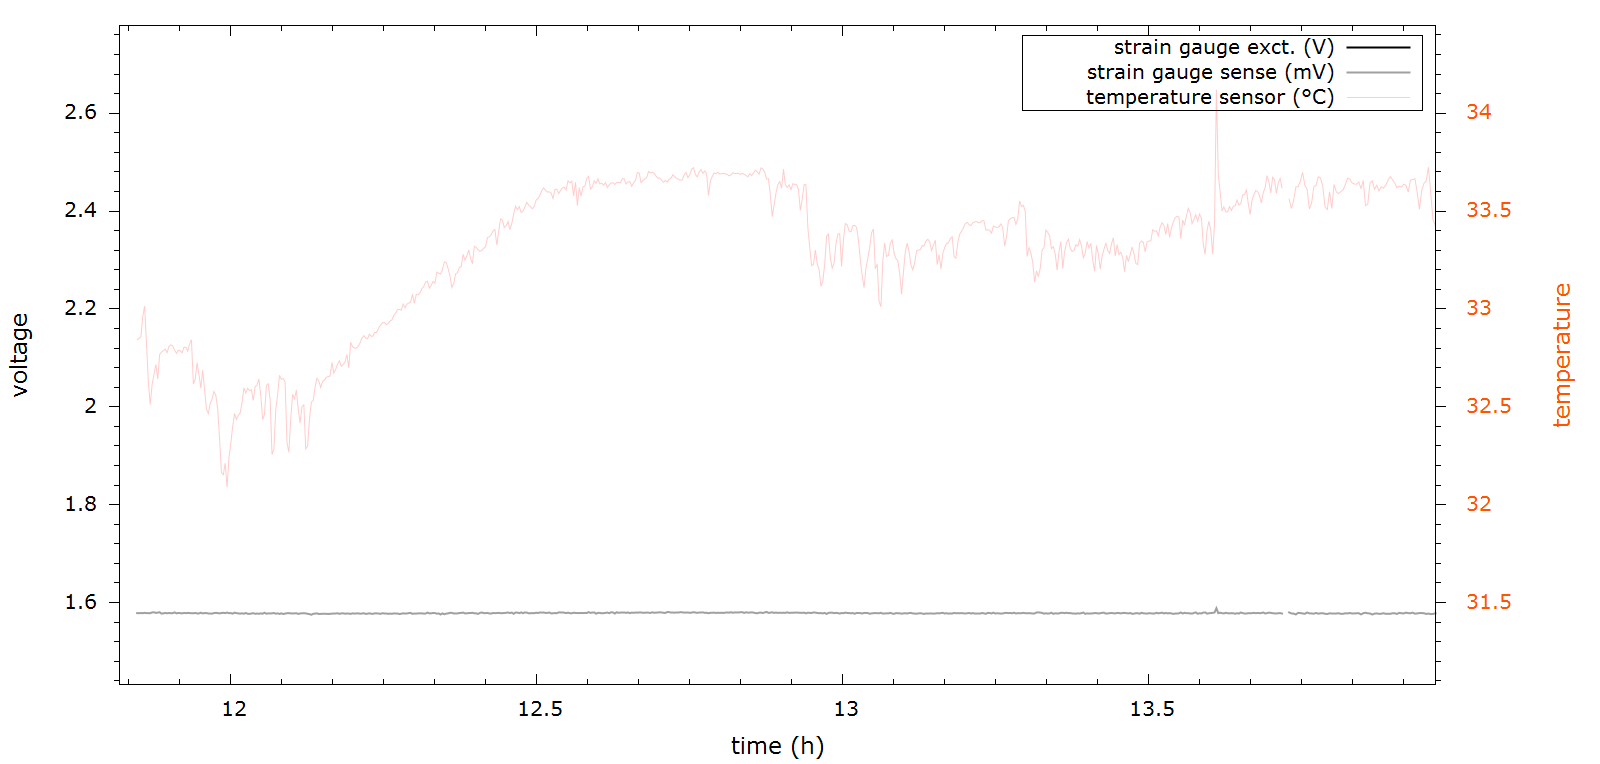
The scale electronics still connected can draw some power and possibly load the sense points differently. Now it's somewhat evident that the 25..30 µV shift is related to the state of the scale PCB and can be eliminated easily if need be.
pps. : shifting the center of mass
It appears the 5L jug has been off center from the start but also inching sideways ever so slightly over the course of the day. I suppose this is due to it rocking back and forth when the table is touched. Just typing on the laptop makes it jiggle.
Since the load is shared by four cells which are summed due to the wheatstone bridge arrangement, the exact center of mass of the load should not show up in the data unless there are variations in sensitivity or hysteresis effects.
In the data the effect is barely visible and level lines have been guessed as a guide to the eye (fitting constants over intervals would be the proper way to do it).
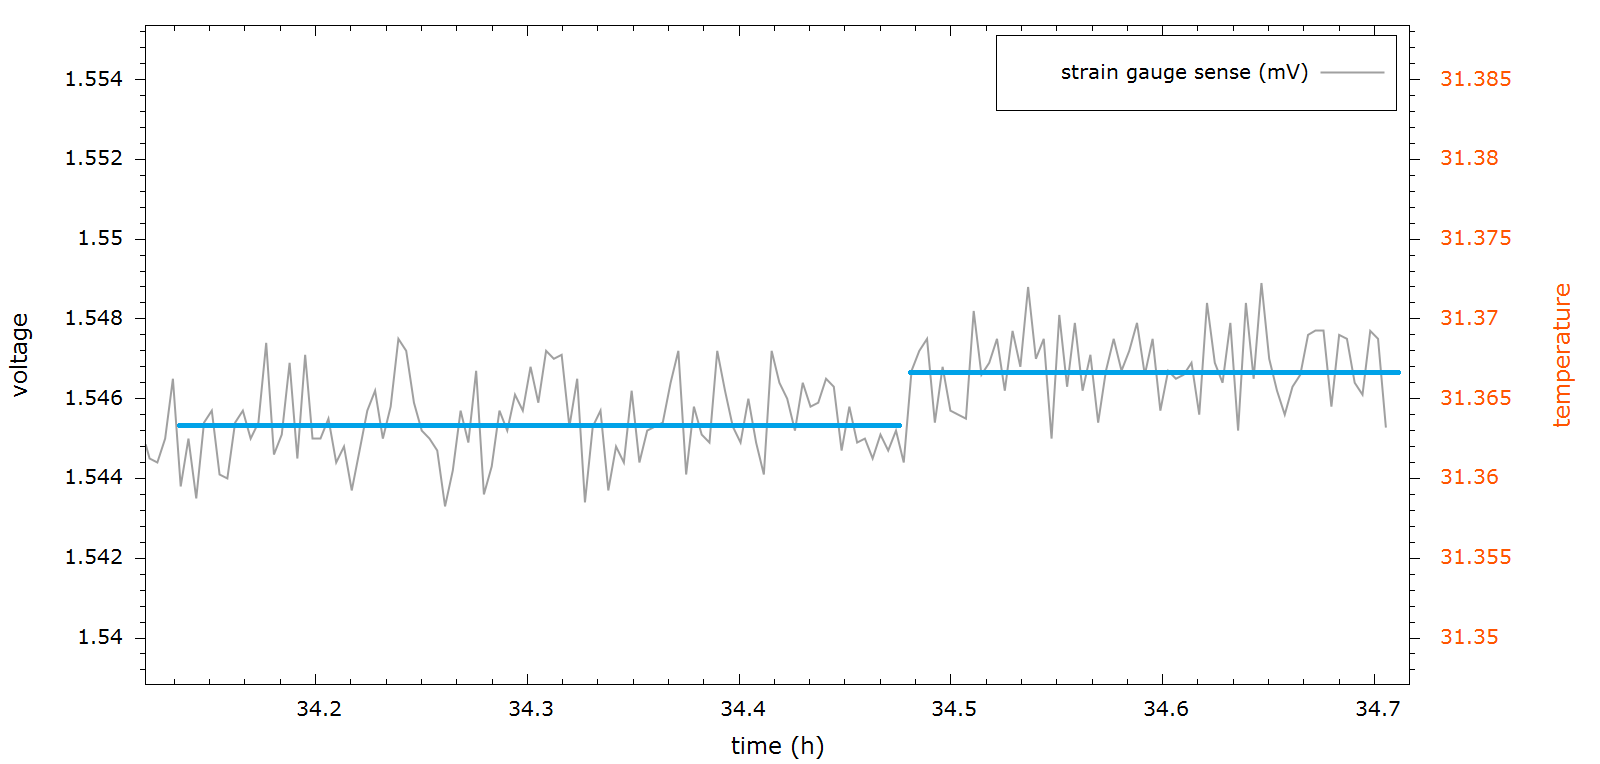 So shifting 5kg by 3-4 cm creates a 1.6 .. 1.8 µV change.
 Accounting for the no-load starting value -0.836 mV of the strain gauge bridge sense voltage, a total range of 2.381 mV corresponding to 5 kg load is observed, making the observed change by shifting equivalent to a 4 g measurement error.
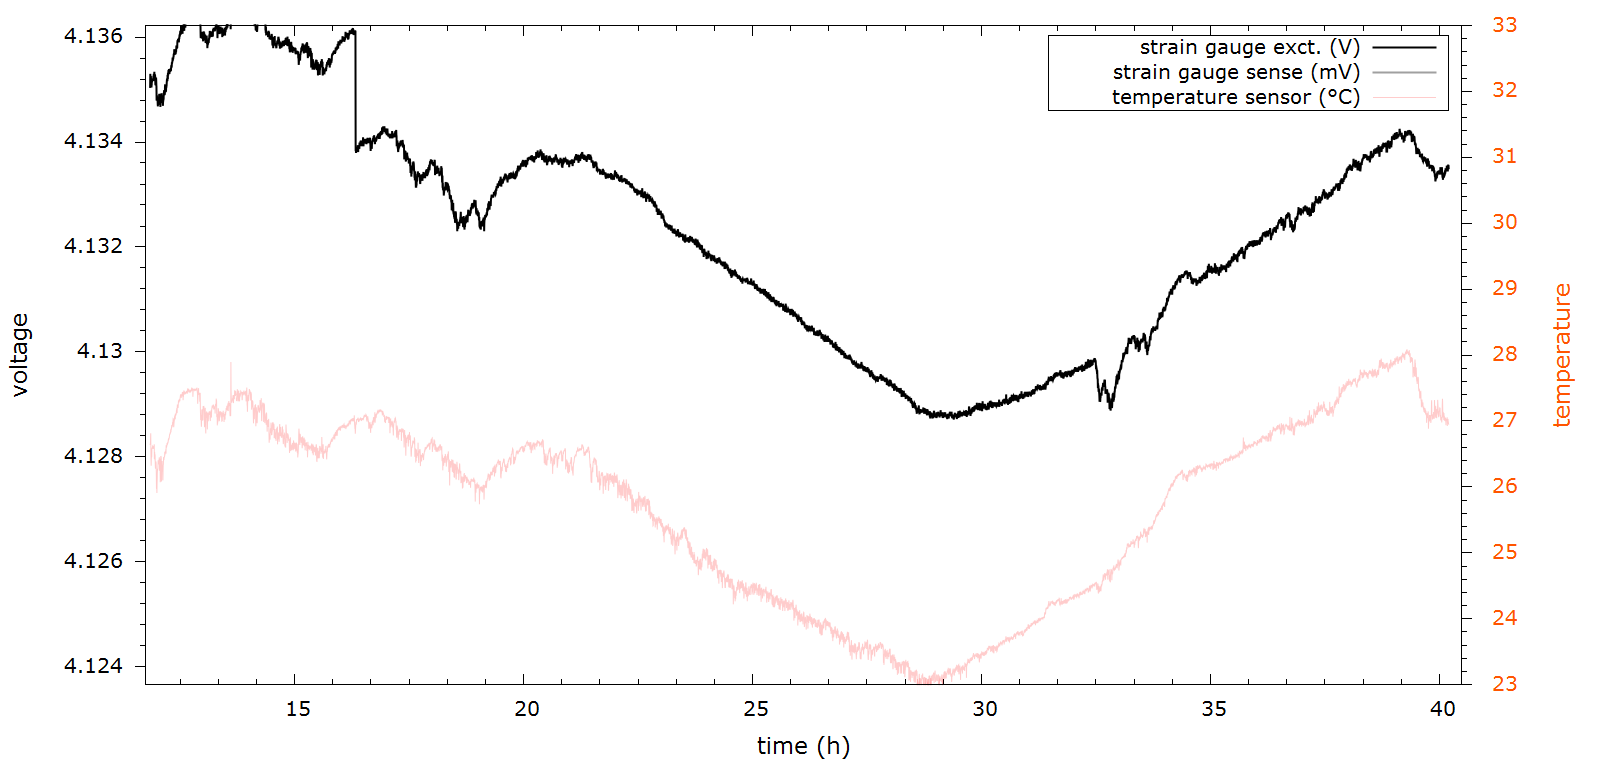
ppps. HX711 regulator drift
It appears the HX711 linear regulator has a thing or two to explain regarding temperature drift - if what we're seeing it not in some obscure way related to load variations by the backfed scale PCB. Also note the corrected temperature calculation.
 p^4s:
p^4s:after 68.5h, the test weight is removed, also exposing its approximate weight during resistance measurement where the wheatstone bridge is unloaded by the multimeter: "4730 g" - a new (out of the box, same type) scale shows 4672g. The people scale I bought says 4.7 kg which ain't helping. The only other kitchen scales that haven't been tampered with don't go beyond 3.5 kg.
A 1.25 L bottle seems to create 1289 g differential reading ( new 5 kg scale: 1271 g, 3 kg scale: 1273g ).
so with the 1.27 kg weight we're out of cal by +1.336(4)% and +1.2414(3)% at 4.67 kg.
input loading by the HX711 ADC would tend to decrease the factor so we're left suspecting that driving the load cell with 4.135 V instead of the 2.4 V the original scale PCB would output ever so slightly voids the calibration. It's surprising though that this kind of misuse is tolerated to seamlessly ;-)
Discussions
Become a Hackaday.io Member
Create an account to leave a comment. Already have an account? Log In.