 Kris Winer
3 August 2018
Now that the spectrometer design is basically complete (I might replace the switch with a solder jumper to lower cost) and the spectrometer functions (I get 18 channels of data) I want to learn how to get the most out of it---along the way to answering the question: What is it good for?
First step is to assess reproducibility and accuracy for any given task. I have been struggling with a proper reference material as well. Since I don't want to spend a lot of money, I have tried paper, aluminum foil, and most recently teflon. I bought a 12 inch x 12 inch x 40 mil (0.040 inch)-thick piece of teflon to use as a (relatively cheap) reference. It does a good job of diffusing incident light but even at 40 mils it is not completely opaque (glad I didn't get the 4 mil version!). So I slipped a piece of aluminum foil under the teflon sheet and arranged the spectrometer about 2.5 cm above the teflon surface to take some spectra as follows:
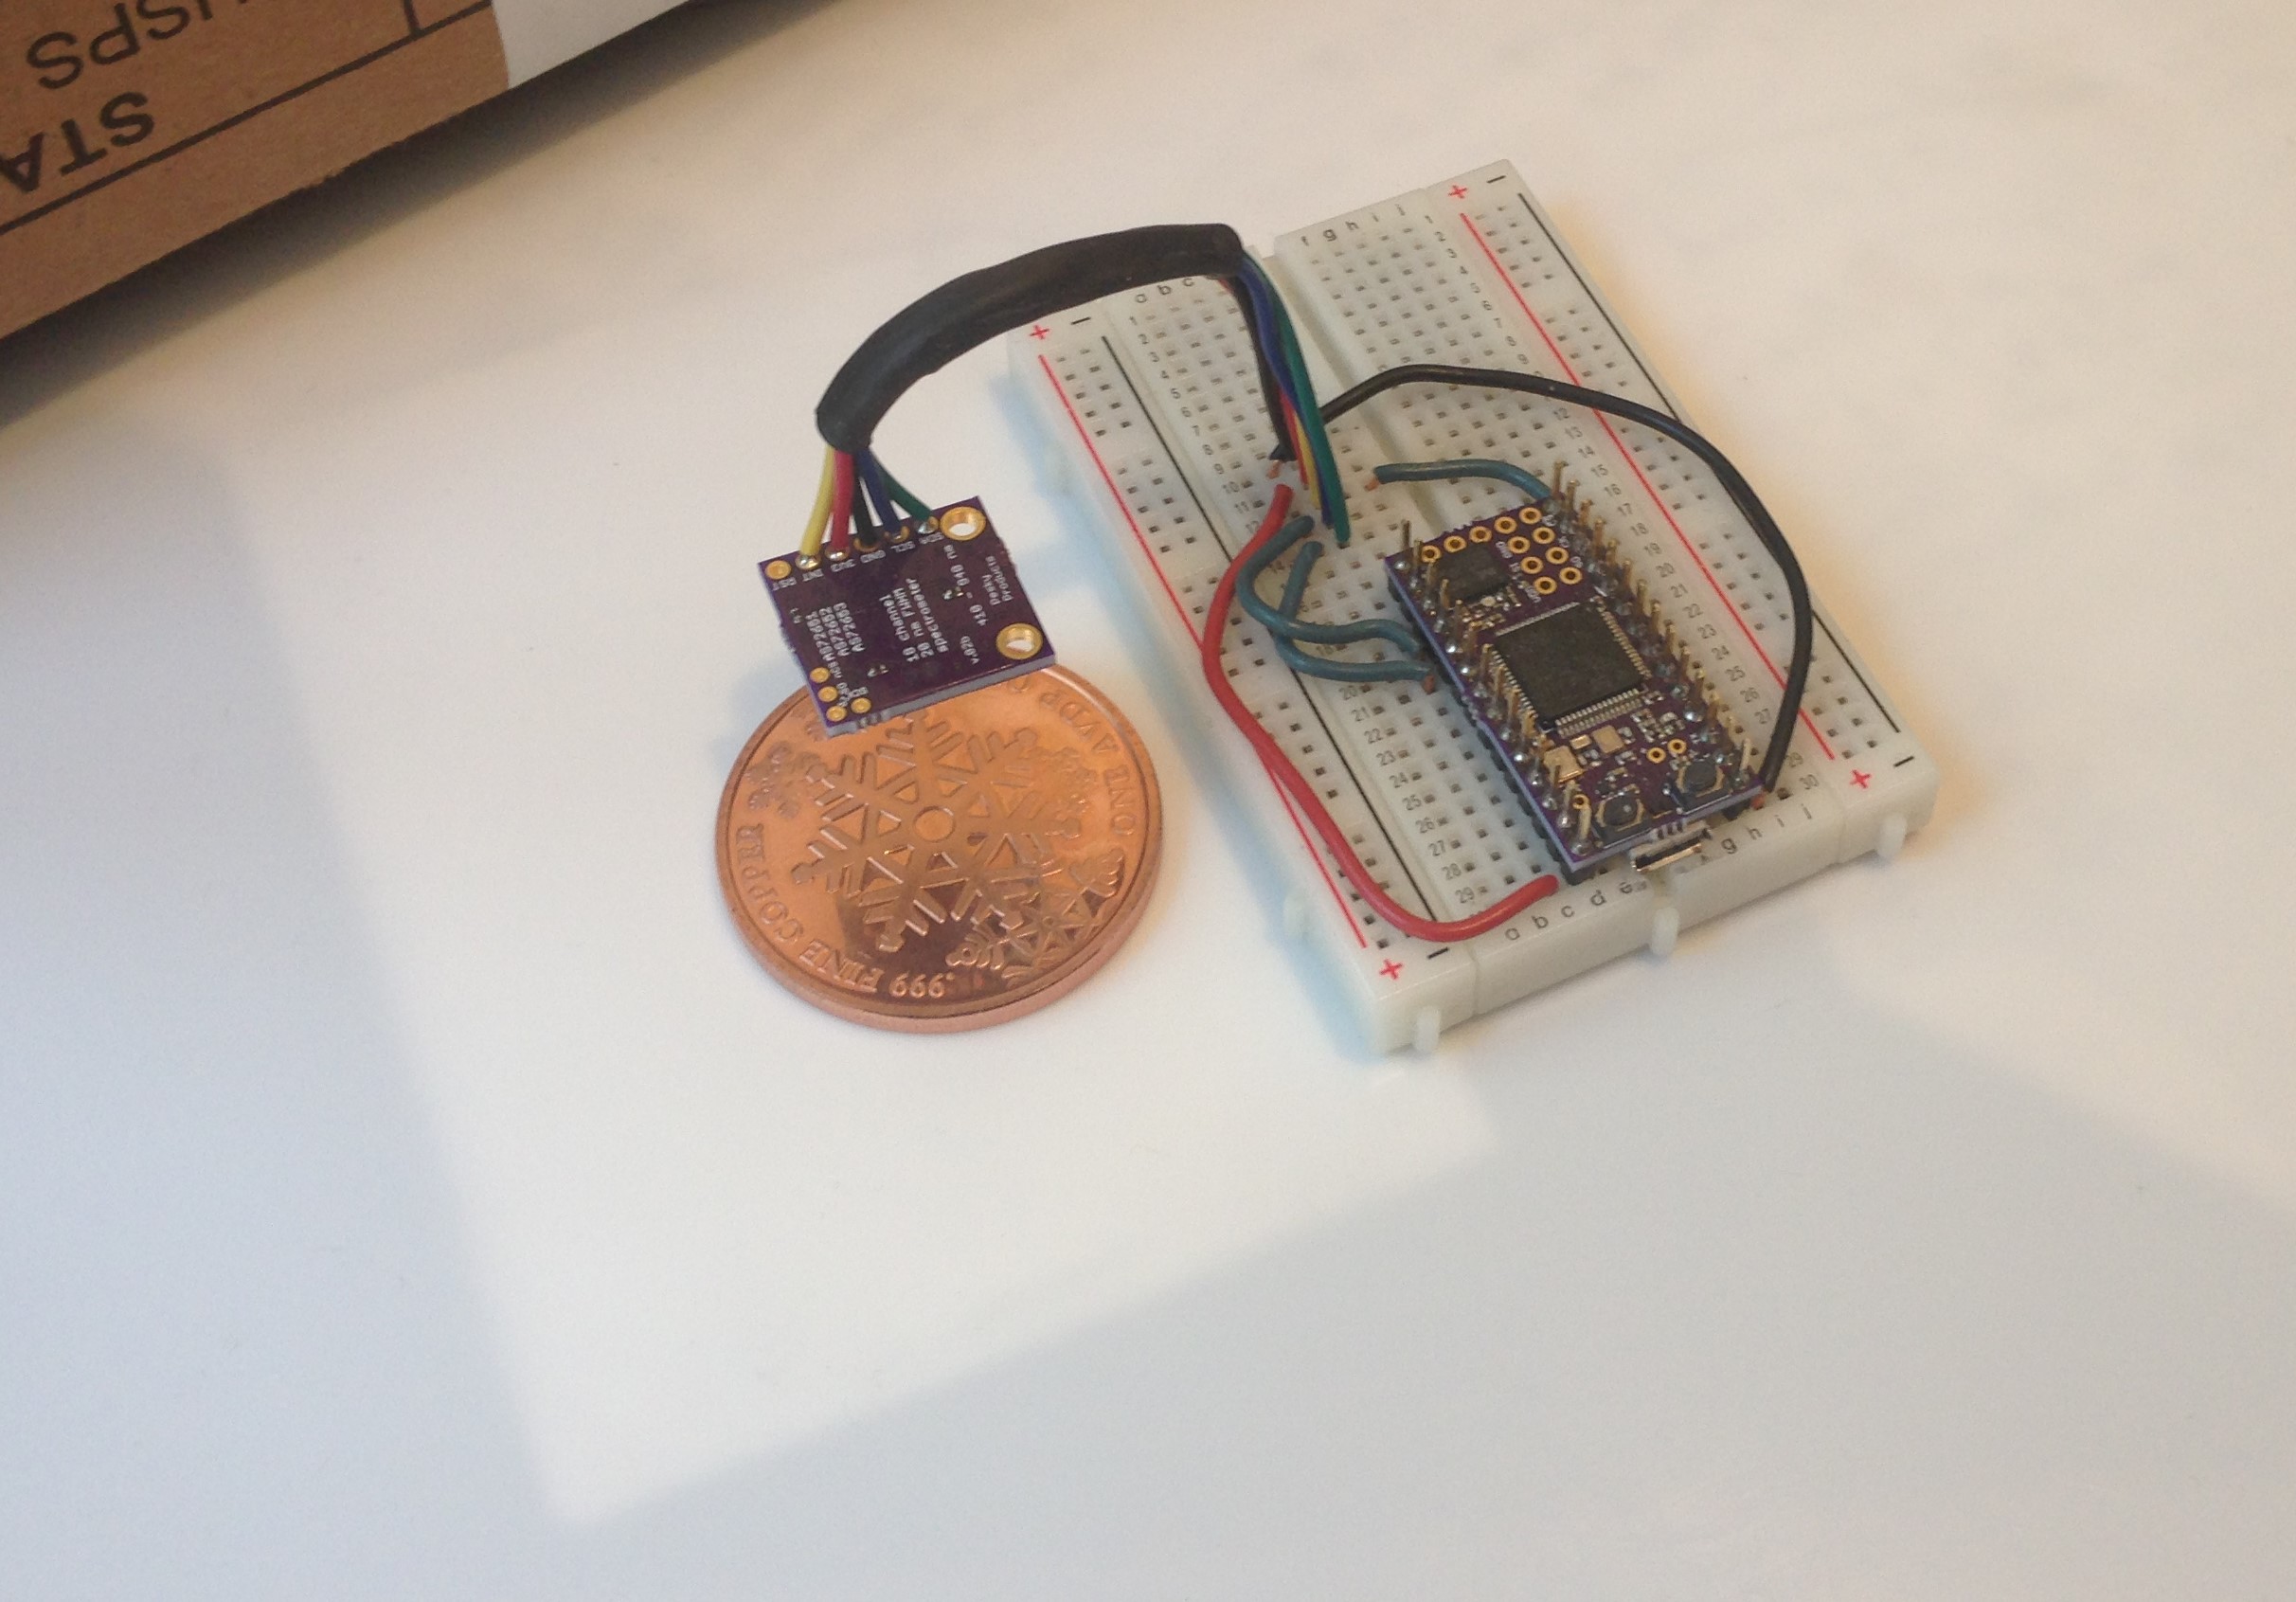
Breadboard with spectrometer, target (coin of 0.999 pure copper), and cardboard box to place over everything when accumulating data all sit on top of the white teflon sheet. You can see the rectangular piece of aluminum foil (a bit bigger than the breadboard) just under the copper coin and teflon sheet.
The idea is to average spectra with and without the target in place (in both cases with the cardboard box in place over the whole apparatus to minimize external light sources) and then compare by dividing the target spectrum by the reference spectrum at each of the 18 different frequencies. There remain flaws in this method: I am not rigidly fixturing the spectrometer, the box is leaky, I am not controlling position of the coin except by eye, etc. But I would expect even this semi-lax method to produce something close to the reflectivity spectrum shown here:
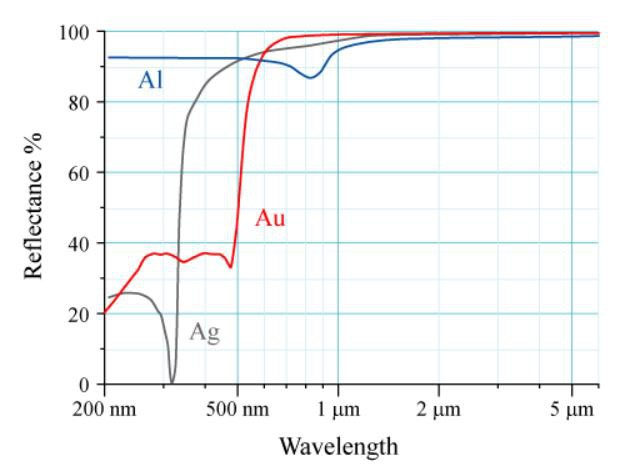
Copper isn't plotted but it would look a lot like gold except shifted to the right by ~100 nm. That is, like all good metallic conductors there should be a reflectivity edge, in the case of copper at ~600 nm. Reflectivity peaks at ~700 nm and then trails off slowly at higher frequencies.
This is what I measured:
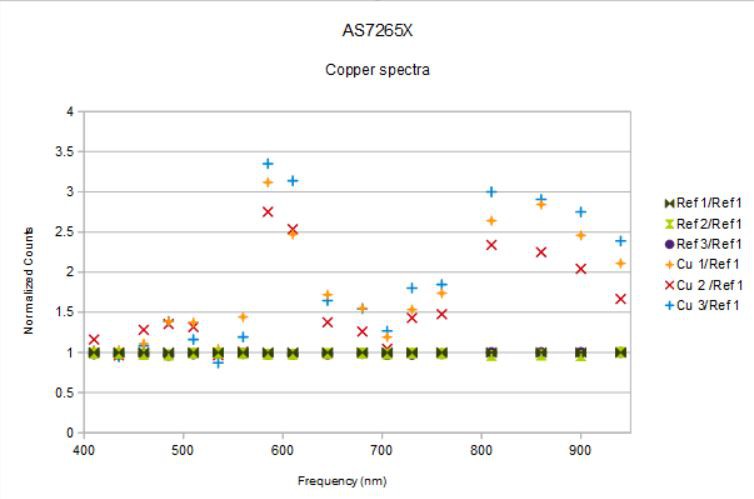
I measured each spectrum, three reference spectra and three spectra from the copper coin, separately and with a pause in between where I removed the protective box, rearranged the coin or slightly moved the breadboard, etc. The idea was to assess reproducibility of the measurements and sensitivity to small perturbations. I arbitrarily chose reference spectrum 1 as my reference and I am plotting the ratios of all six spectra relative to reference spectrum 1 above.
The reference spectra are identical within the width of the symbols used to mark the data. This shows that at least the spectrometer is measuring the same thing from the teflon + aluminum foil reference material each time.
Next, the copper spectra show ratios above one for almost all of the channels because the coin is partially mirrored and should reflect a lot more light at most wavelengths that the diffusely-reflecting teflon sheet. There is relatively low reflectance between 410 and 535 nm as expected, and a strong edge at ~580 nm, also as expected. And the spectrum tails off slowly above 800 nm also as expected.
What is not expected is the broad dip at 700 nm where there should be a broad peak!
Is it possible this is due to a geometric effect of light at these frequencies being unable to get to the photodetectors? This is why I repeated the experiment three times and adjusted the spectrometer/target each time. If there was some subtle alignment issue this would show up as a more wild variation; these three copper spectra are remarkable consistent and reproducible.
This is not pure copper since the surface no doubt is somewhat oxidized; is it possible that the thin oxide layer could produce the absorption at 700 nm? Nope:

The edge shifts a bit to the IR when there is a thin oxide, but the reflectivity above the edge should be monotonic and approach ~100%; there should be no dip.
So what the heck?
Do I have an error in the sketch? Maybe the signal is too high at ~700 nm and I am truncating it? I don't think so. The counts I am seeing for the copper target at 705 nm are just a few hundred and the calibrated data is available as a float. Hard to over-run here...
Maybe I am missing something simple....
Discussions
Become a Hackaday.io Member
Create an account to leave a comment. Already have an account? Log In.