 karpour
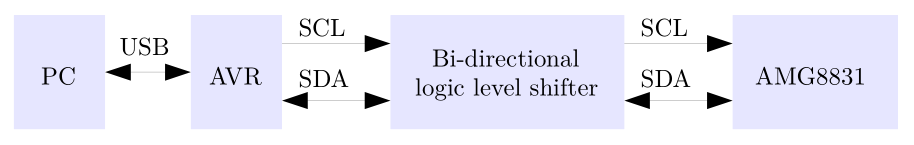
Via an I²C-capable level shifter based on BSS138 FETs, a test setup was built, with the AMG8831 being connected to an ATMega328 AVR microcontroller. The level shifter was used to allow I²C communication between the AVR (with a logic level of 5V) and the AMG8831 (With a logic level of 3.3V). Even though the logic levels are different, the same logic level shifter will be used in the final prototype as it is also capable of enabling communication between 1.8V and 3.3V logic levels.
In the process, an AMG88xx library was created which should be easily portable to other platforms, an excerpt can be seen below. (The full source code can be downloaded here)
/**
 * Writes the temperature values in °C into a float array.
 * @param result Float array of the size 64 used for storing results
 */
void readValues(float result[]){
	byte pixelAddrL = AMG_REGISTER_T01L;
	for (int pixel = 0; pixel < 64; pixel++) {
		delay(1);
		Wire.beginTransmission(amg_addr);
		Wire.write(pixelAddrL);
		Wire.endTransmission();
		Wire.requestFrom(amg_addr, 2);
		byte lowerLevel = Wire.read();
		byte upperLevel = Wire.read();
		int temperature = ((upperLevel << 8) | lowerLevel);
		if (temperature > 2047) {
			temperature = temperature - 4096;
		}
		result[pixel] = temperature * 0.25;
		pixelAddrL +=2;
	}
}
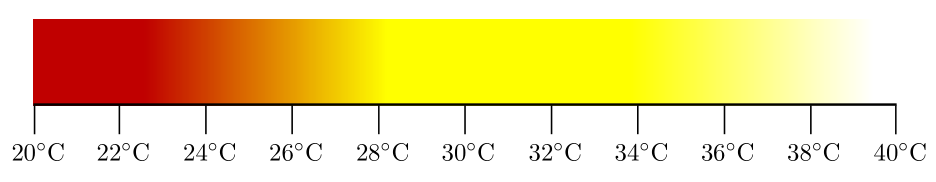
On the PC side, Java programs were developed to store the received data in log files, analyze and visualize it. For all further heatmaps in this chapter, the corresponding gradient seen belowis used
 The first data gathered were readings with the sensor pointing at a wall with a uniform temperature to test the noise level of the sensor. According to the data sheet, temperature readings have an accuracy of
±2.5°C. The connected computer was configured to acquire a reading of all pixel temperatures and the thermistor value every 30 seconds. Out of 380 measurements, the average values for each pixel were calculated.
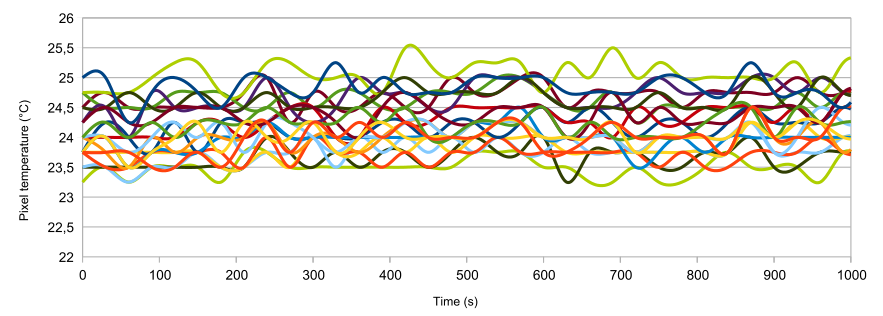
In the above Graph the fluctuations in temperature of 20 pixels can be seen over a duration of 1000 seconds. The fluctuations for each single pixel typically stay within ±0.5°C and the difference between the average temperature readings of the pixels was up to 2.5°C. It has to be noted that these measurements were not taken in a highly controlled environment. From the collected data, a calibration table was generated which was applied to further readings by the professing software.
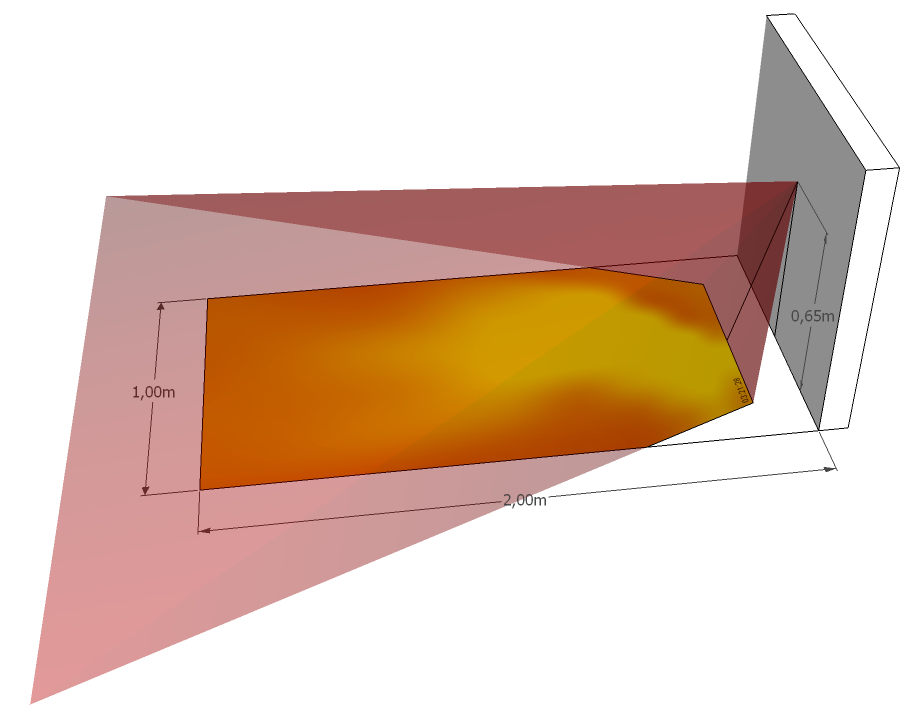
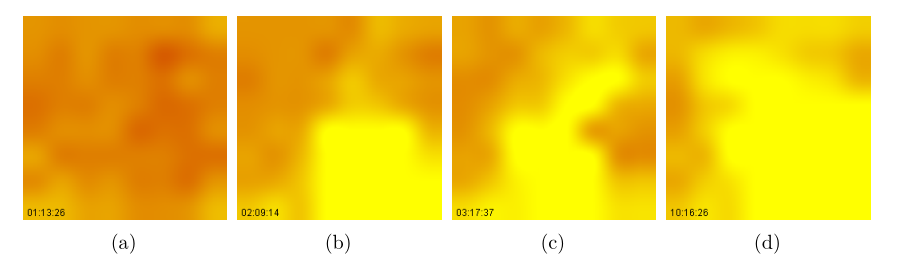
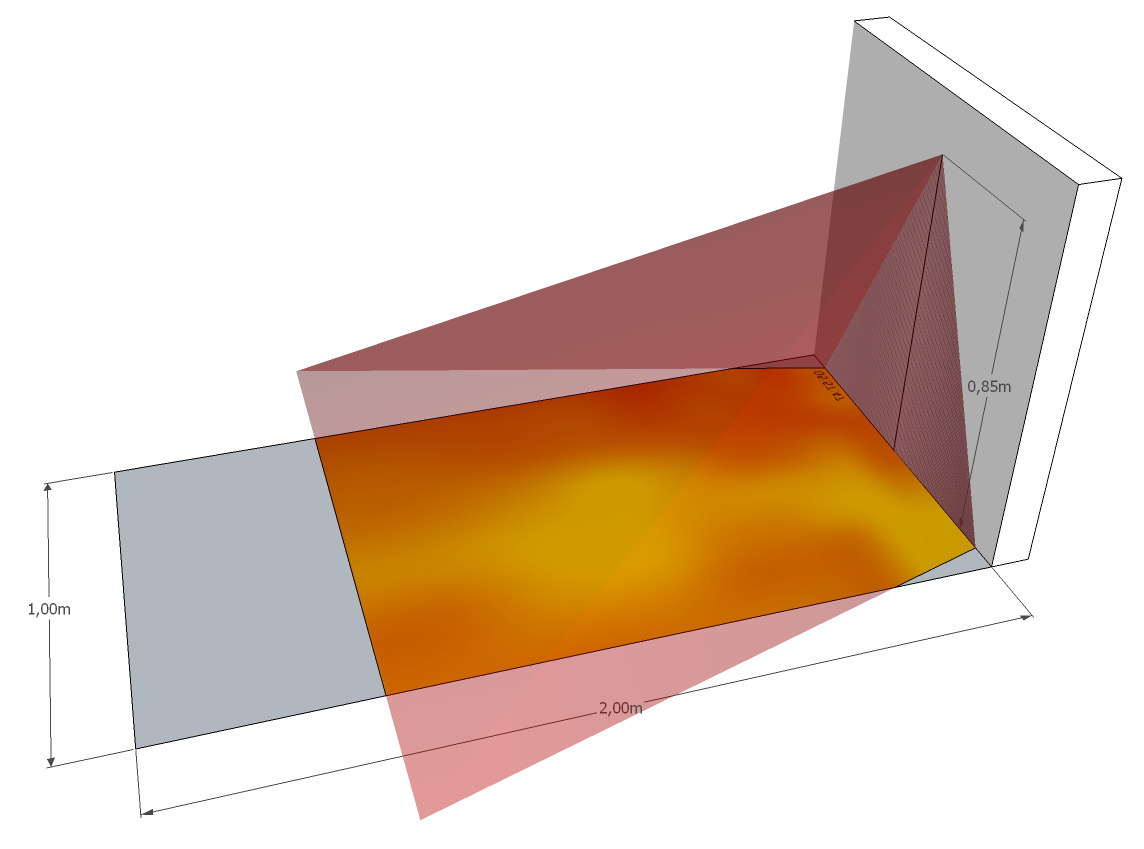
For testing presence detection, the sensor was mounted above a bed with a 2m x 1m mattress at a height of 65cm and an angle of 45°C, as seen in the Figure below. Over the course of a night, readings were acquired every 30 minutes well before going to bed and until a while after getting out of bed.
Examples of the readings can be seen below.
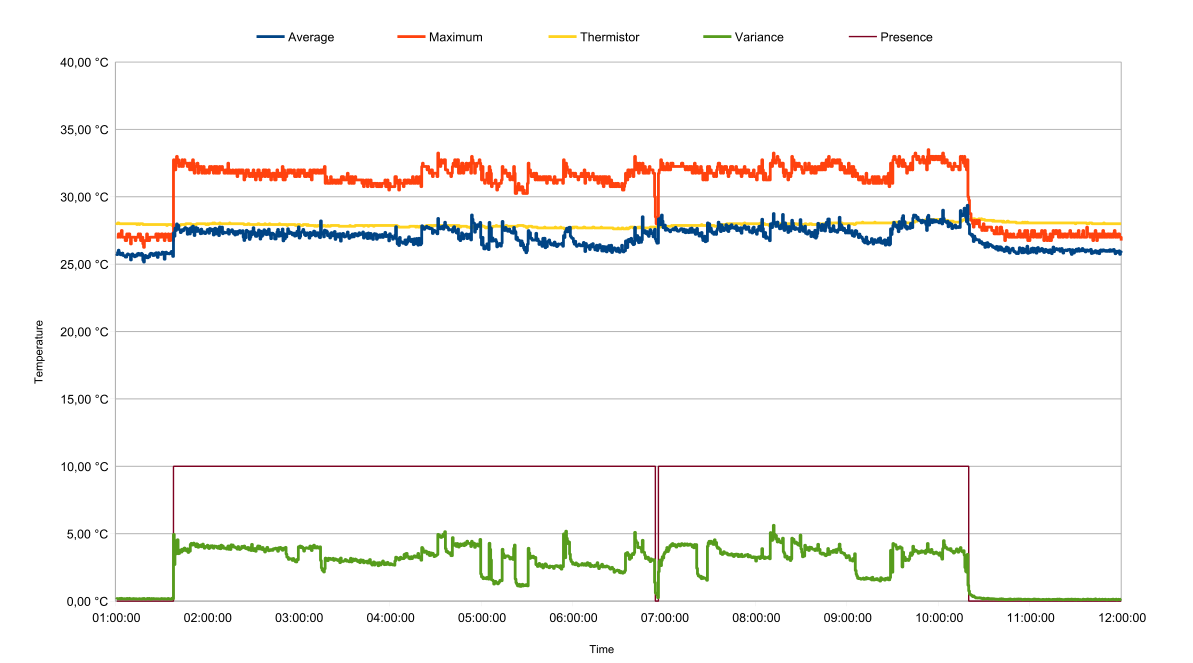
The readings were processed and for each set of 64 temperature values the maximum temperature, the average temperature were calculated. These values, along with the thermistor value were plotted. While it was fairly obvious on the chart which times the bed was occupied, it was difficult to set a threshold value to decide whether the bed was occupied or not. Since large parts of the body are covered when lying in bed leaving possibly only the head partially exposed, simply setting a temperature threshold for the maximum value would not work reliably. The change in average temperature in an occupied bed on the other hand is too small to make a definite decision.
The variance of all values should be very low when the bed is unoccupied as it can be assumed that the unoccupied bed will have a uniform temperature. When the bed is occupied, the variance will be significantly higher as parts of the reading will have a higher temperature, and based on the location of the sensor it can be assumed that the whole sensor area will never be fully covered by a body. Therefore, the variance was chosen to be the best measure to determine whether the bed was occupied and calculated as well for each received sensor reading.
Based on known presence time, a preliminary threshold of 0.8 was set with a variance below 0.8 meaning that the bed was not occupied. The threshold, applied to the variance graph, accurately shows times then the bed is occupied. All data can be seen in the figure below.
Video of one night of gathered data.
Based on the first and further tests, it was concluded that a sensor location would increase coverage of the upper area of the bed where the head is located would lead to better readings, as this is the area where the body would most likely not be covered with a blanket. The sensor was mounted at a height of 85cm with the optical axis pointing down at a 60° angle. The threshold value for the occupancy detection based on the variance of the measured values was lowered to 0.7 which provided accurate results in further tests.
Revised test setup with the sensor positioned higher and at a 60° angle
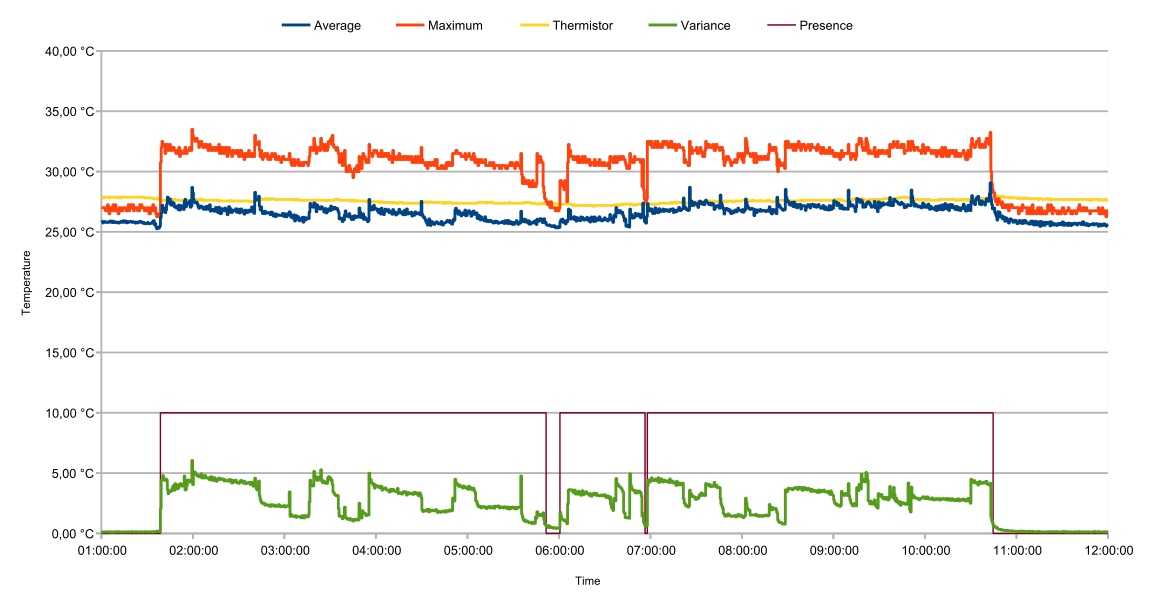
When a person occupies a previously unoccupied bed, the next reading will instantly detect the presence. However, when a person exits an occupied bed, the currently implemented presence detection will still wrongly assume that the person is present for up to 90 seconds. This is due to the heat imprint left on the bed by a person, after they lie in the same pose for a while. The Figure below shows a situation where the person left the bed. The actual time of leaving and the detected time are 90 seconds (3 readings) apart. In this case, it can be seen that it takes about 6 minutes for the bed to return to ambient temperature.
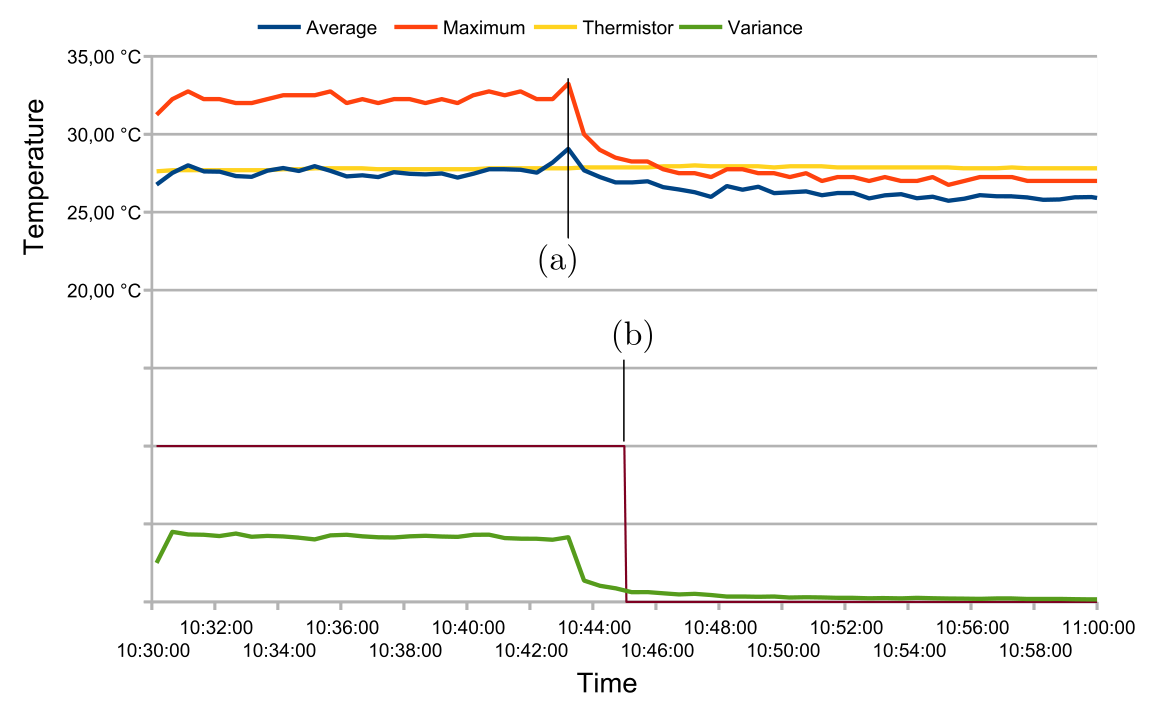
Graph showing: time when the person leaves the bed (a), time when the system stops detecting presence (b)
While additional measures could be taken to improve the speed of detection of a person leaving the bed, doing so would increase the chance of false positive detection. It is possible to retroactively correct the system by looking for a sharp drop in the maximum temperature shortly before the system stops detecting a presence and assuming it as the time when the person left the bed. Since a delay in detection of 90 seconds is tolerable, it is, while worth noting, not seen as a problem in this context.
Discussions
Become a Hackaday.io Member
Create an account to leave a comment. Already have an account? Log In.