 karpour
As part of a complete monitoring system, it is important to consider the usage of specific devices in a household, specifically devices that could pose a risk of harming the user if incorrectly used or malfunctioning. This includes mostly devices that draw a large current when used, such as toasters, water boilers and blow-dryers. Being able to measure the time and duration these devices are turned on is useful for two reasons: If devices are not used for a long time, it can be an indicator that something is wrong. On the other hand, if devices are turned on for too long are a possible safety hazard, for example a water cooker that is turned on for over 10 minutes.
The following criteria should be met by the sensor node:
• Being able to tell whether a device connected on a power line is turned on or off with good accuracy
• Non-invasive current detection
• Attachable to any power cable
• No required alterations to the existing setup
The method for non-invasive inductive current detection presented in this section works by filtering and amplifying the tiny currents created in an inductor placed near a 2-wire or 3-wire power cable carrying alternating current. Measuring the currents is challenging as the electric fields of the phase and neutral wires almost completely cancel each other out, an issue that does not exist when measuring on a single conductor. However, with large enough amplification of the much weaker current the inductor provides when measuring on a 2-wire or 2-wire power cable, it is still possible to detect the electric field which corresponds to the amount of current in the conductors.
All further tests are performed with power cables carrying 230V AC.
Circuit design
The initial circuit design is roughly based on the circuit in the Extech DA30 non-contact AC current detector. It was determined that the detection circuit consisted of an inductor with a connected operational amplifier and low-pass filter.
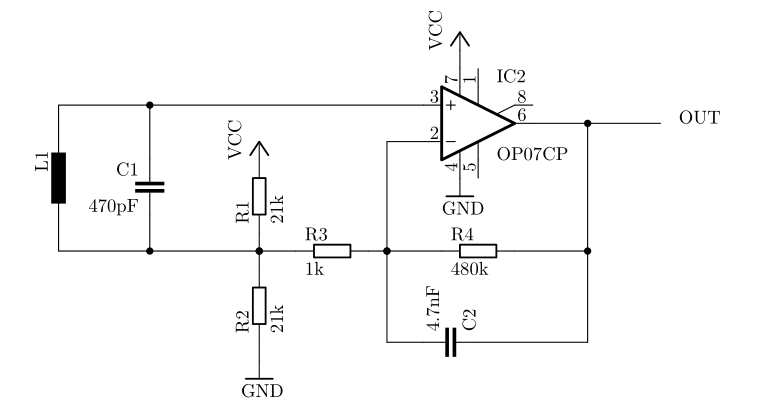
Circuit Design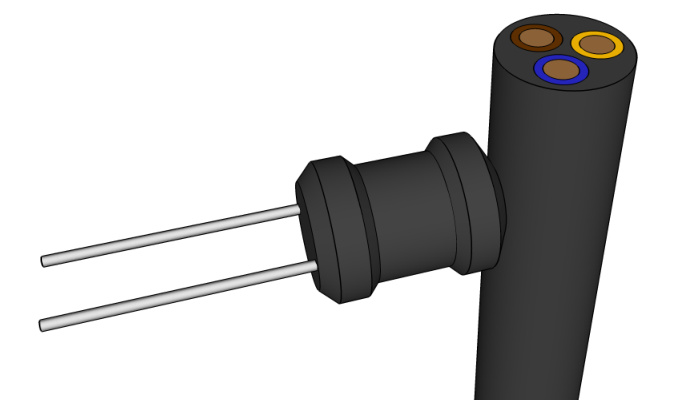 Placement of inductor in relation to power cable
Experiments
Goal of the following experiments is to find out ideal configuration of the circuit for an ideal measurement of the load using the 10-bit ADC of an ATMEGA328.
The first test was performed with the following values:
• VCC = 3.3V
• L1 = 100µH
• R3 = 1kΩ
• R4 = 470kΩ
• Load = 1000W
The gain Aᵥ of the initial configuration is therefore:
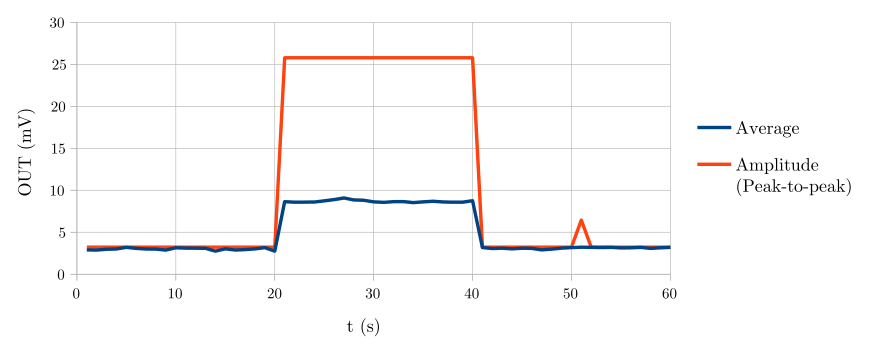
For a load of 1000W, the results were clear but very weak with a Vₚₚ of about 25mV. The Figure above shows the measurements of a 1000W load being turned on for 20 seconds with a reading once per second. To increase the accuracy of the measurements, the gain was increased to Aᵥ=1424.24 by changing R3 to a 330Ω resistor.
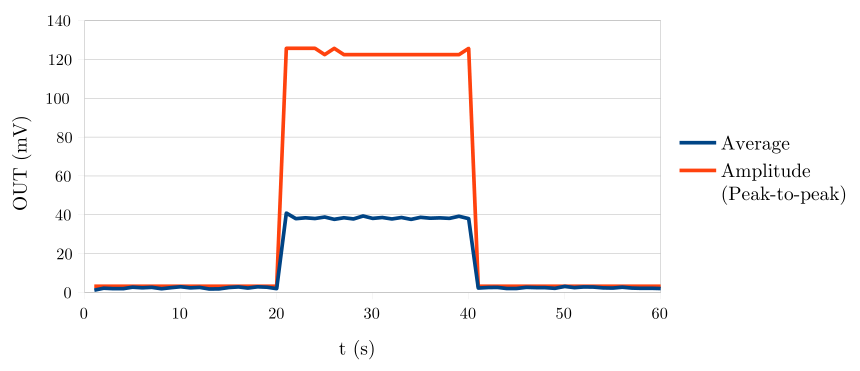 Results of the second test with a 1000W load. (Aᵥ=1424.24, L=100µH).The Load is turned on for 20 seconds again.
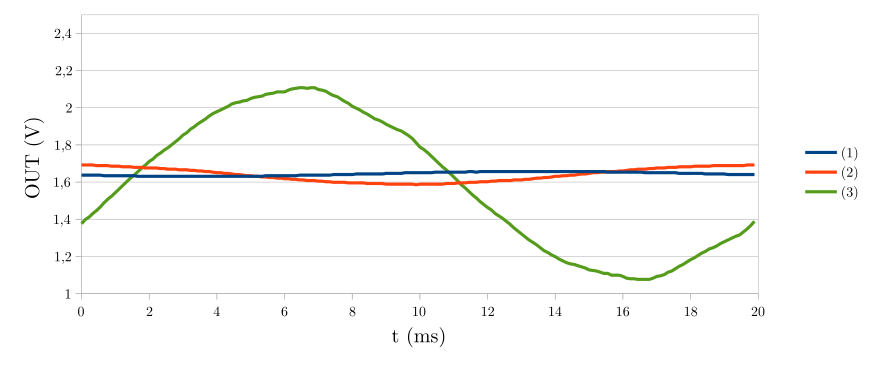 Measurements with a load of 1000W: (1) Aᵥ=470, L=100µH, (2) Aᵥ=1424.24, L=100µH, (3) Aᵥ=1424.24, L=10mH
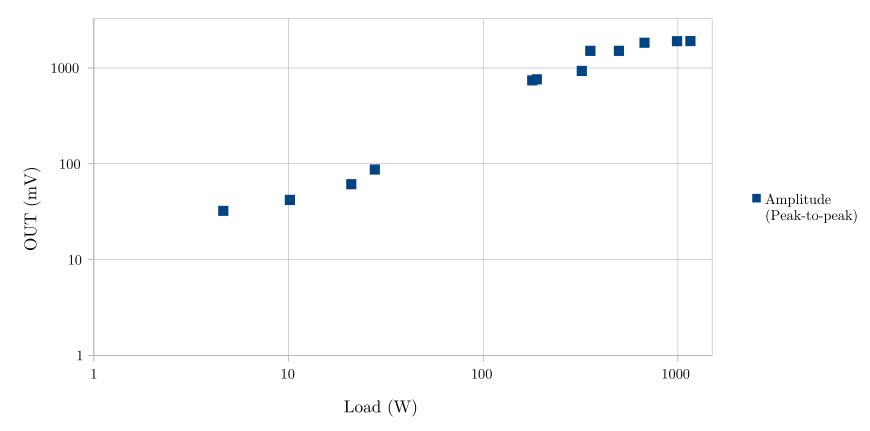
With optimal placement, the circuit is able to detect loads of 15W and up accurately by setting a simple threshold. For each device, the threshold has to be set separately as the output value is largely influenced by the location of the sensor and the type of power cable. Once the sensor is mounted in a fixed position, readings are consistent. The amount of load corresponding to the sensor output has been determined to be non-linear. This has been tested by placing the sensor on the cable of a power distributor and connecting loads between 4W and 1160W. A graph of the results can be seen in the Figure below.
Influence of sensor location
In previous tests, it was obvious that the location of the sensor relative to the power cable has greatly influences the output of the circuit. this is due to the different positions of the phase and neutral wires in relation to the inductor, depending on the angle the inductor is placed on the power cable. In a first measurement, it was confirmed that the two positions with the maximum output values are 180° apart and the two least ideal positions are 90° from each of the ideal positions. In a simple setup with (1000W load, Aᵥ=1424.24, L1 = 100µH), 10 measurements were taken at each 45° of power cable rotation. The power cable was 8mm thick with phase, neutral and ground wires. The results can be seen below.

It was determined that more accurate measurements to determine the effect of the inductor location on the sensor output were necessary. A test setup was created to measure the output signal with the inductor rotated an 5° increments around the power cable between each successive measurement. This was done for a 3-wire power cable as well as a 2-wire power cable. While with the round 3-wire power cable the placement of the inductor was unproblematic, the oval shape of the 2-wire power cable made it difficult to perfectly align the inductor to the center of the cable. This partially explains the distortions in the readings compared to the more smooth results with the 3-wire cable. Furthermore, the load connected to the 2-wire cable was just 20W, compared to the 1000W load connected to the 3-wire power cable.
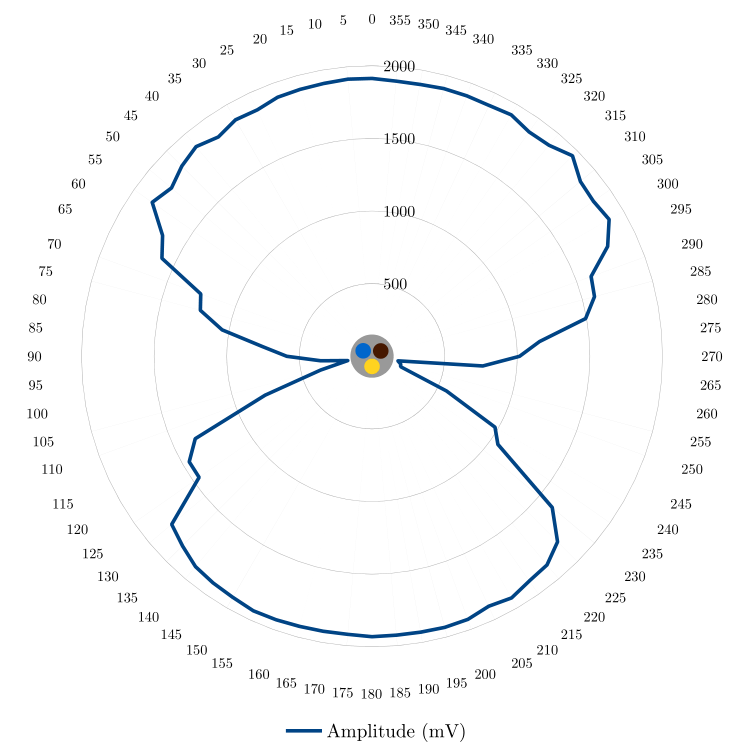
Output of the current detection circuit with the inductor placed in 5° steps around a 3-wire power cable with a 1000W load.
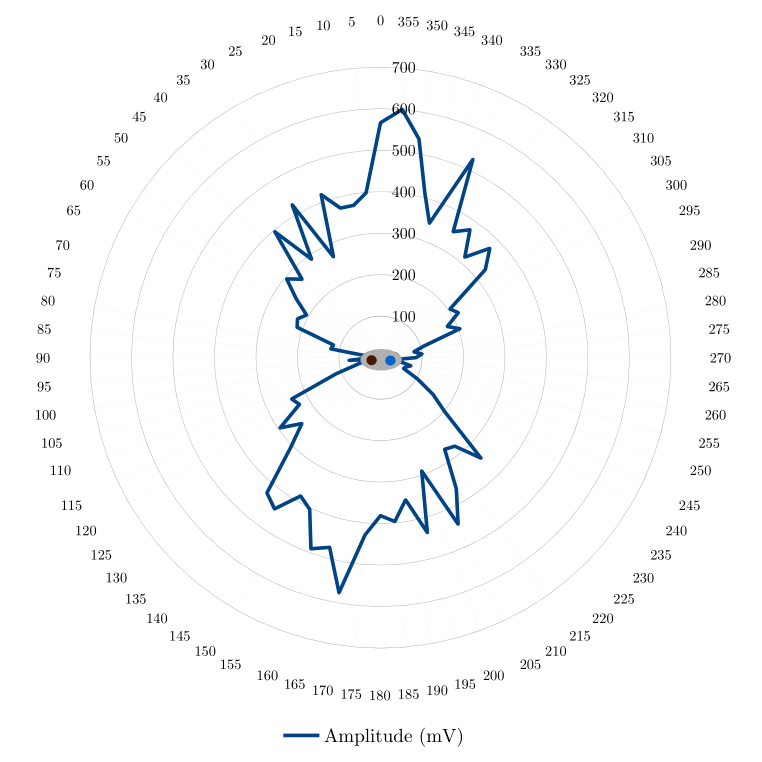
Output of the current detection circuit with the inductor placed in 5° steps around a 2-wire power cable with a 20W load.
Tests with specific devices
The sensor circuit was tested with different appliances. The circuit was able to detect loads of 20W and higher accurately. In addition to the 1000W water boiler seen in the graphs above, the circuit was also tested with a 200W flat-screen LCD TV, the results can be seen below. The results are very satisfying as it is very clear when the TV is on and off. Note that with this TV it takes a few seconds for the backlight to turn on, which can be clearly seen on the graphs.
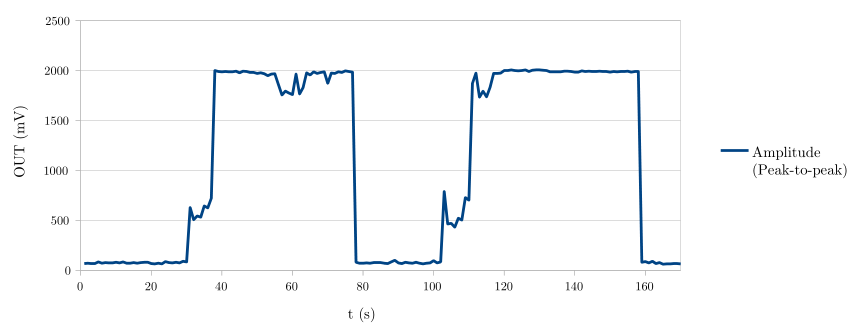
Sensor output when connected to the power cable of an LCD TV. The TV was turned on and off two times.
Discussions
Become a Hackaday.io Member
Create an account to leave a comment. Already have an account? Log In.
What sensor did you end up using for L1, would you mind providing a link? And was the output of this circuit useful for ATMEGA, 0-5V? I'd like to do something similar using the ATtiny84 chip. Cheers, Tyler
Are you sure? yes | no
Fantastic write up! Where have you been all my life. I've been trying to find information on this subject for months. Thank you, thank you!
Are you sure? yes | no