 Tomislav Mamić
ECG shield
The first thing to note about this shield is that it provides 1 measurement channel over its differential amplifier. The shield unfortunately contains a bandpass filter with cutoffs at 0.16Hz and 40Hz. It is stackable, but stacked shields seem to require their own electrodes which sounds like it would get very messy very fast.
Method of measurement
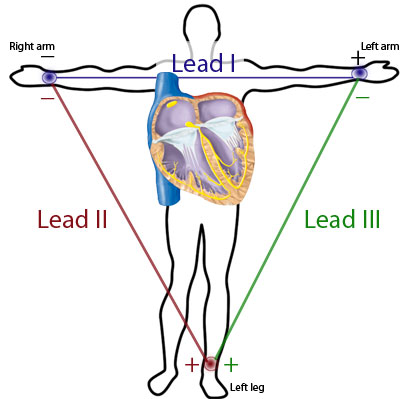 Image above shows the standard electrode setup. Leads 2 and 3 are inputs to the differential amplifier which then outputs the potential across lead 1.
A standard heartbeat

The image above shows a standard heartbeat as recorded on 1 channel ECG. The heartbeat contains 5 notable features marked P, Q, R, S and T. Ideally, we want to reconstruct all 5, but that is not an easy task with the ECG shield we're using. Read on to find out why. Still, even if we don't succeed in getting a clear image of all the features, extracting even just the QRS Complex would make this device a useful tool.
Modern ECG standard (as seen from this document)
Regarding the useful information in ECG frequency spectrum, it is ideal to have the lower cutoff as low as 0.05Hz, but this requirement can be relaxed up to 0.67Hz for some applications. It is worth noting that increasing the lower cutoff frequency causes considerable deformation of the ST segment. The deformation we get wouldn't really fit into the "considerable" category, but is is certainly there. When it comes to the upper limit, for adults, 100Hz is recommended while in babies up to 250Hz is required. This is where the Olimex ECG shield falls flat with its lazy 40Hz cutoff. The designers are not entirely to blame, as (really) old hospital ECGs used to run at the same frequency range, but nowadays we would like more measurements per second. One pretty obvious reason to cut off at 40Hz is the 50/60Hz power noise. Creating a multi-stage filter which deals with that separately while still preserving the higher frequencies was probably impractical so they went with the simple band pass.
What we do with the signal
Since our signal is already filtered in hardware, there is no need for (or use of) further filtering in the frequency range of the filter itself. When looking at the unfiltered signal, I noticed that, while it probably has some effect on the amplitude of the 50Hz interference, the hardware filter doesn't completely remove it. It does however get rid of anything higher pretty effectively. For this reason I had no qualms applying a low pass 4th order Butterworth filter which cuts off at 45Hz to do away with the power noise once and for all. This also has an added benefit of removing much of the high frequency ADC noise.
To test the effects of our filter, I pushed an idealized version of PQRST through it as seen in the image below:
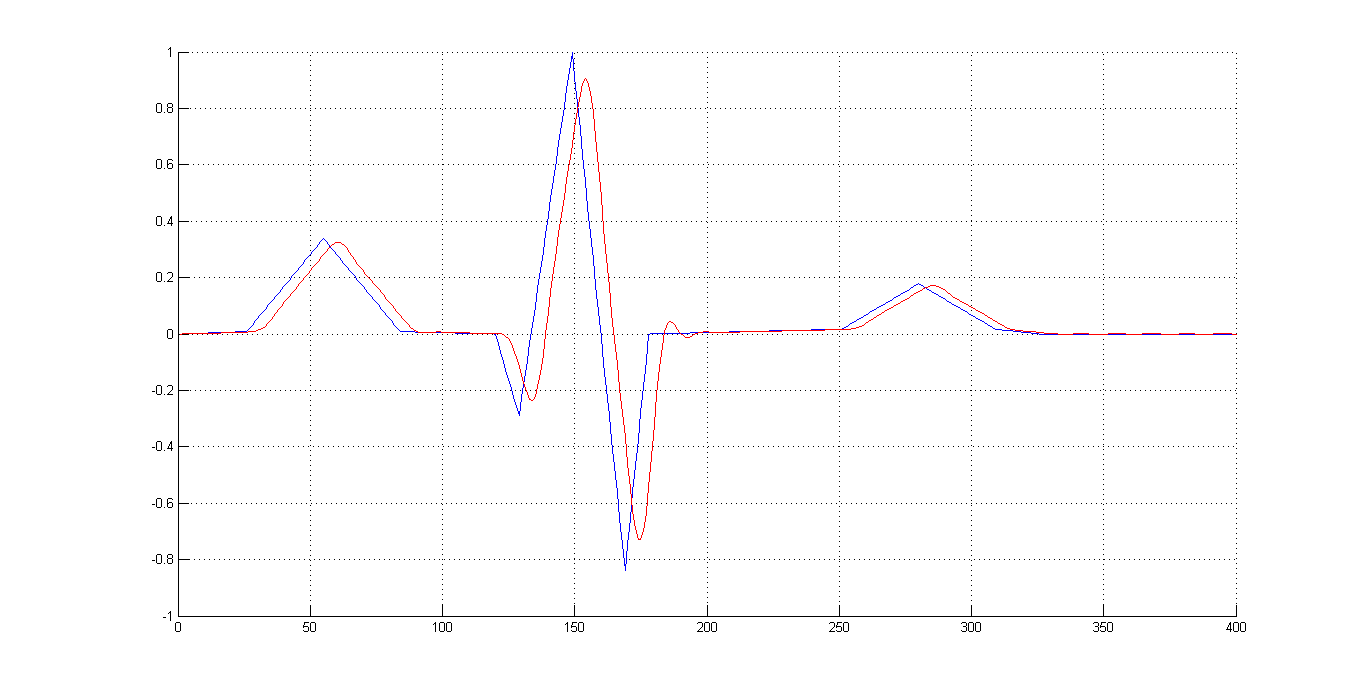
This gives us a good idea of the kinds of deformations we can expect - varying delays among features will distort our idea of the timings - the fastest QRS complex sees the highest delay so it is slightly pushed towards T. Also, since P is slightly faster than T, its delay is higher so the overall duration of the complex is slightly shortened. Looking at amplitudes, there is slight damping, again most prominent at the QRS due to it having the highest amount of high-frequency content. Another thing to notice is slight ringing after the QRS.
Overall, it seems like a small price to pay for getting rid of most of the high frequency trash introduced by the measurement hardware, especially considering that the useful high frequency content is already destroyed by the shield's hardware filter anyway.
There is one effect that requires special attention when measuring ECG - the baseline drift. This is an extremely low frequency noise signal which effectively moves your ECG up and down very slowly. A possibly somewhat unusual, but very effective way of dealing with it is running a very slow low-pass filter which effectively calculates the average value of its input, and subtracting its output from the overall signal. Generally, this may not keep the zero where it's supposed to be but it almost guarantees that no damage will be done to the shape of any individual PQRST, and makes sure they're all level with each other.
How it looks in action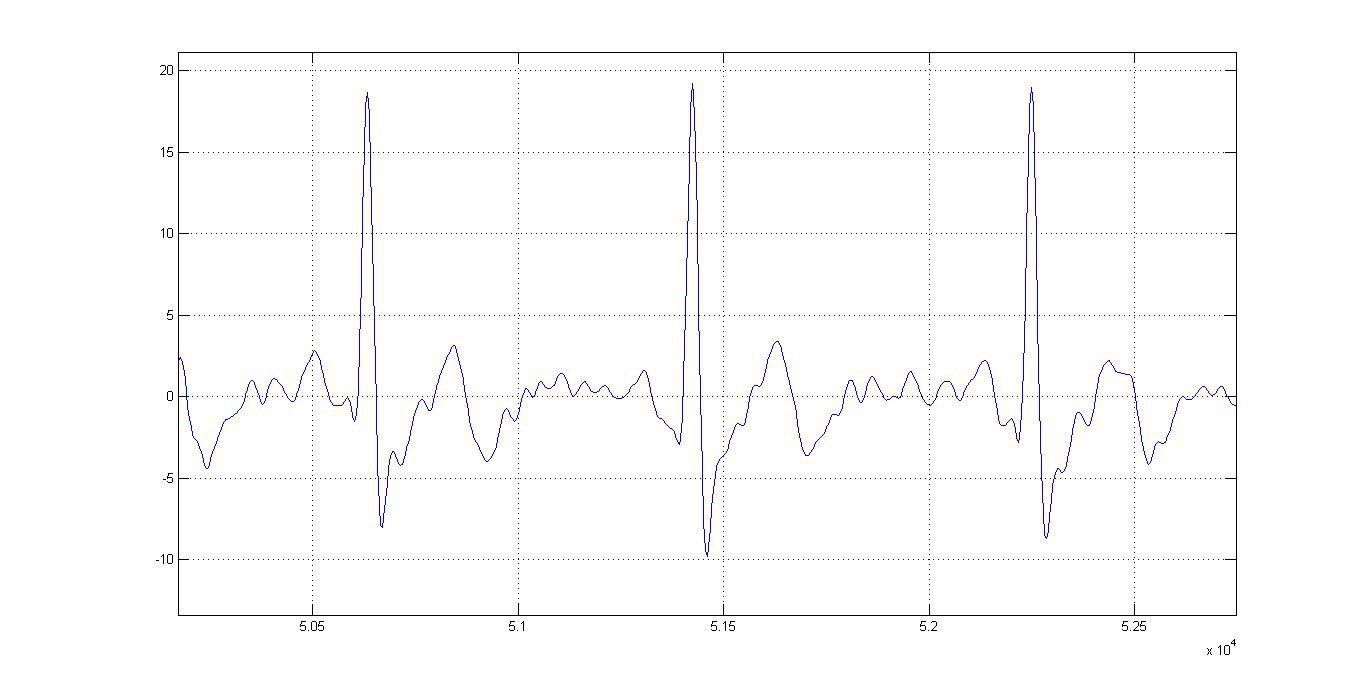
This is what the device puts out over serial. Some high frequency wobble is visible - this is because further stepping onto the higher frequencies would hurt the form of QRS too much, so I let them live - for now.
A rather fun thing to notice is how amplitude and frequency (though frequency drift may not be readily visible from the image below) correlate with breathing. Don't make fun of yoga classes! :)
Obviously, it is hard to say anything exact about the P and T forms when it comes to diagnostics, but QRS is not too bad. To make things better, while measuring timings between two different features is a bit dodgy, measuring the frequency is actually very accurate because two same features are generally delayed and deformed by the same amount. This makes the device a useful tool in tracking arrythmias. Also, any less subtle deviation from the standard PQRST will be noticeable in real time.
Pulse detection
We do pulse detection by looking for a QRS complex. This is done by raising different flags and deciding whether what the device is looking at really is a QRS or not. Flags can differ - from the naive amplitude check (amplitude > threshold -> QRS) to a bit sneakier rise rate check (derivation > threshold -> QRS) to a bit more elaborate ones (it's only QRS if more than Xms has passed since the last one detected) and so on. We use a combination of amplitude, 1st and 3rd derivation treshold flags.
Offline signal processing
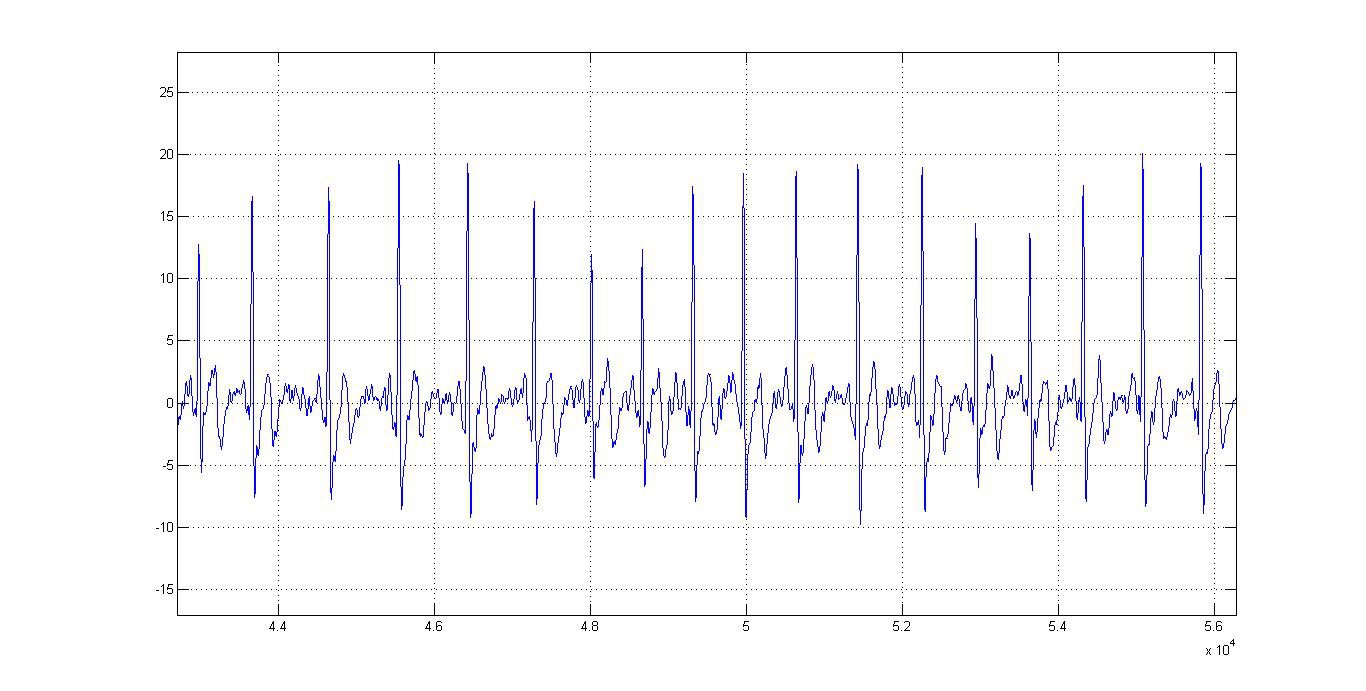
If further precision is needed, we resort to a sneaky offline technique which combines our ability to accurately detect the position of QRS with a bunch of captured measurements into a powerful noise suppresion tool - overlap&average. Here's what it does in practice:
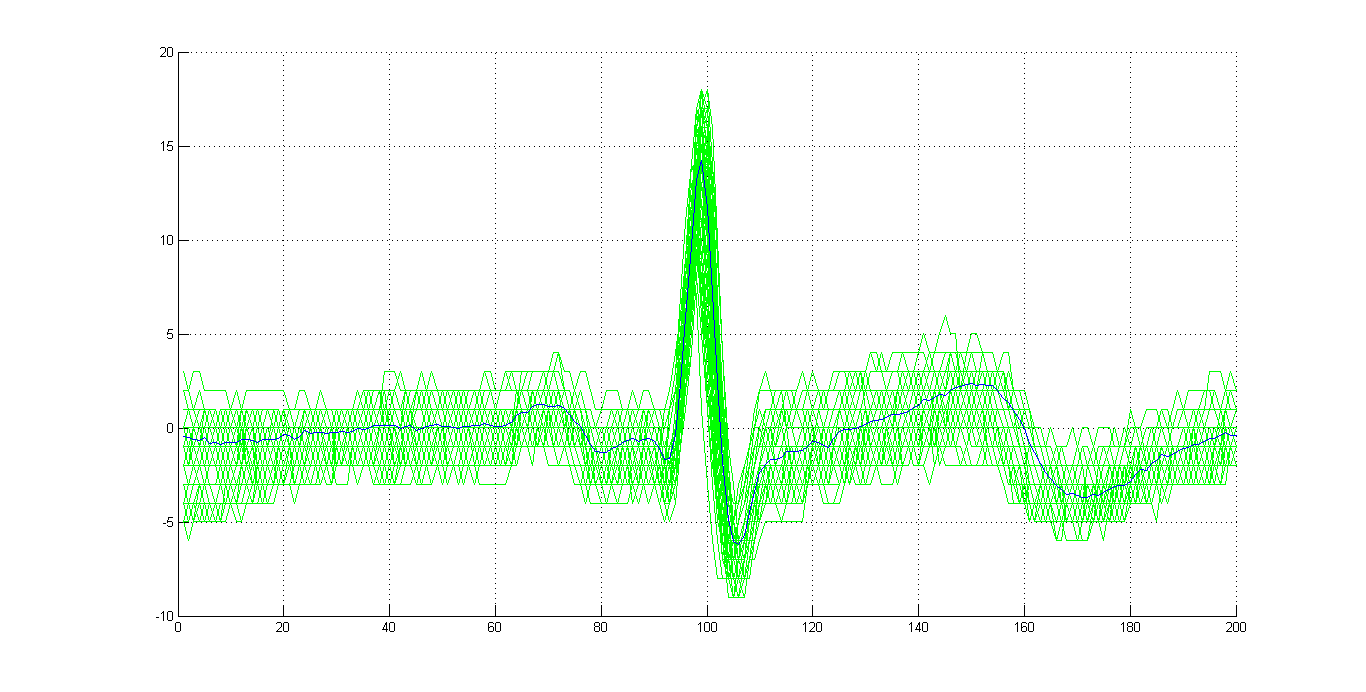
Pretty neat eh?
Discussions
Become a Hackaday.io Member
Create an account to leave a comment. Already have an account? Log In.