 Ben Hencke
Look at this spectrogram. Just look at it.
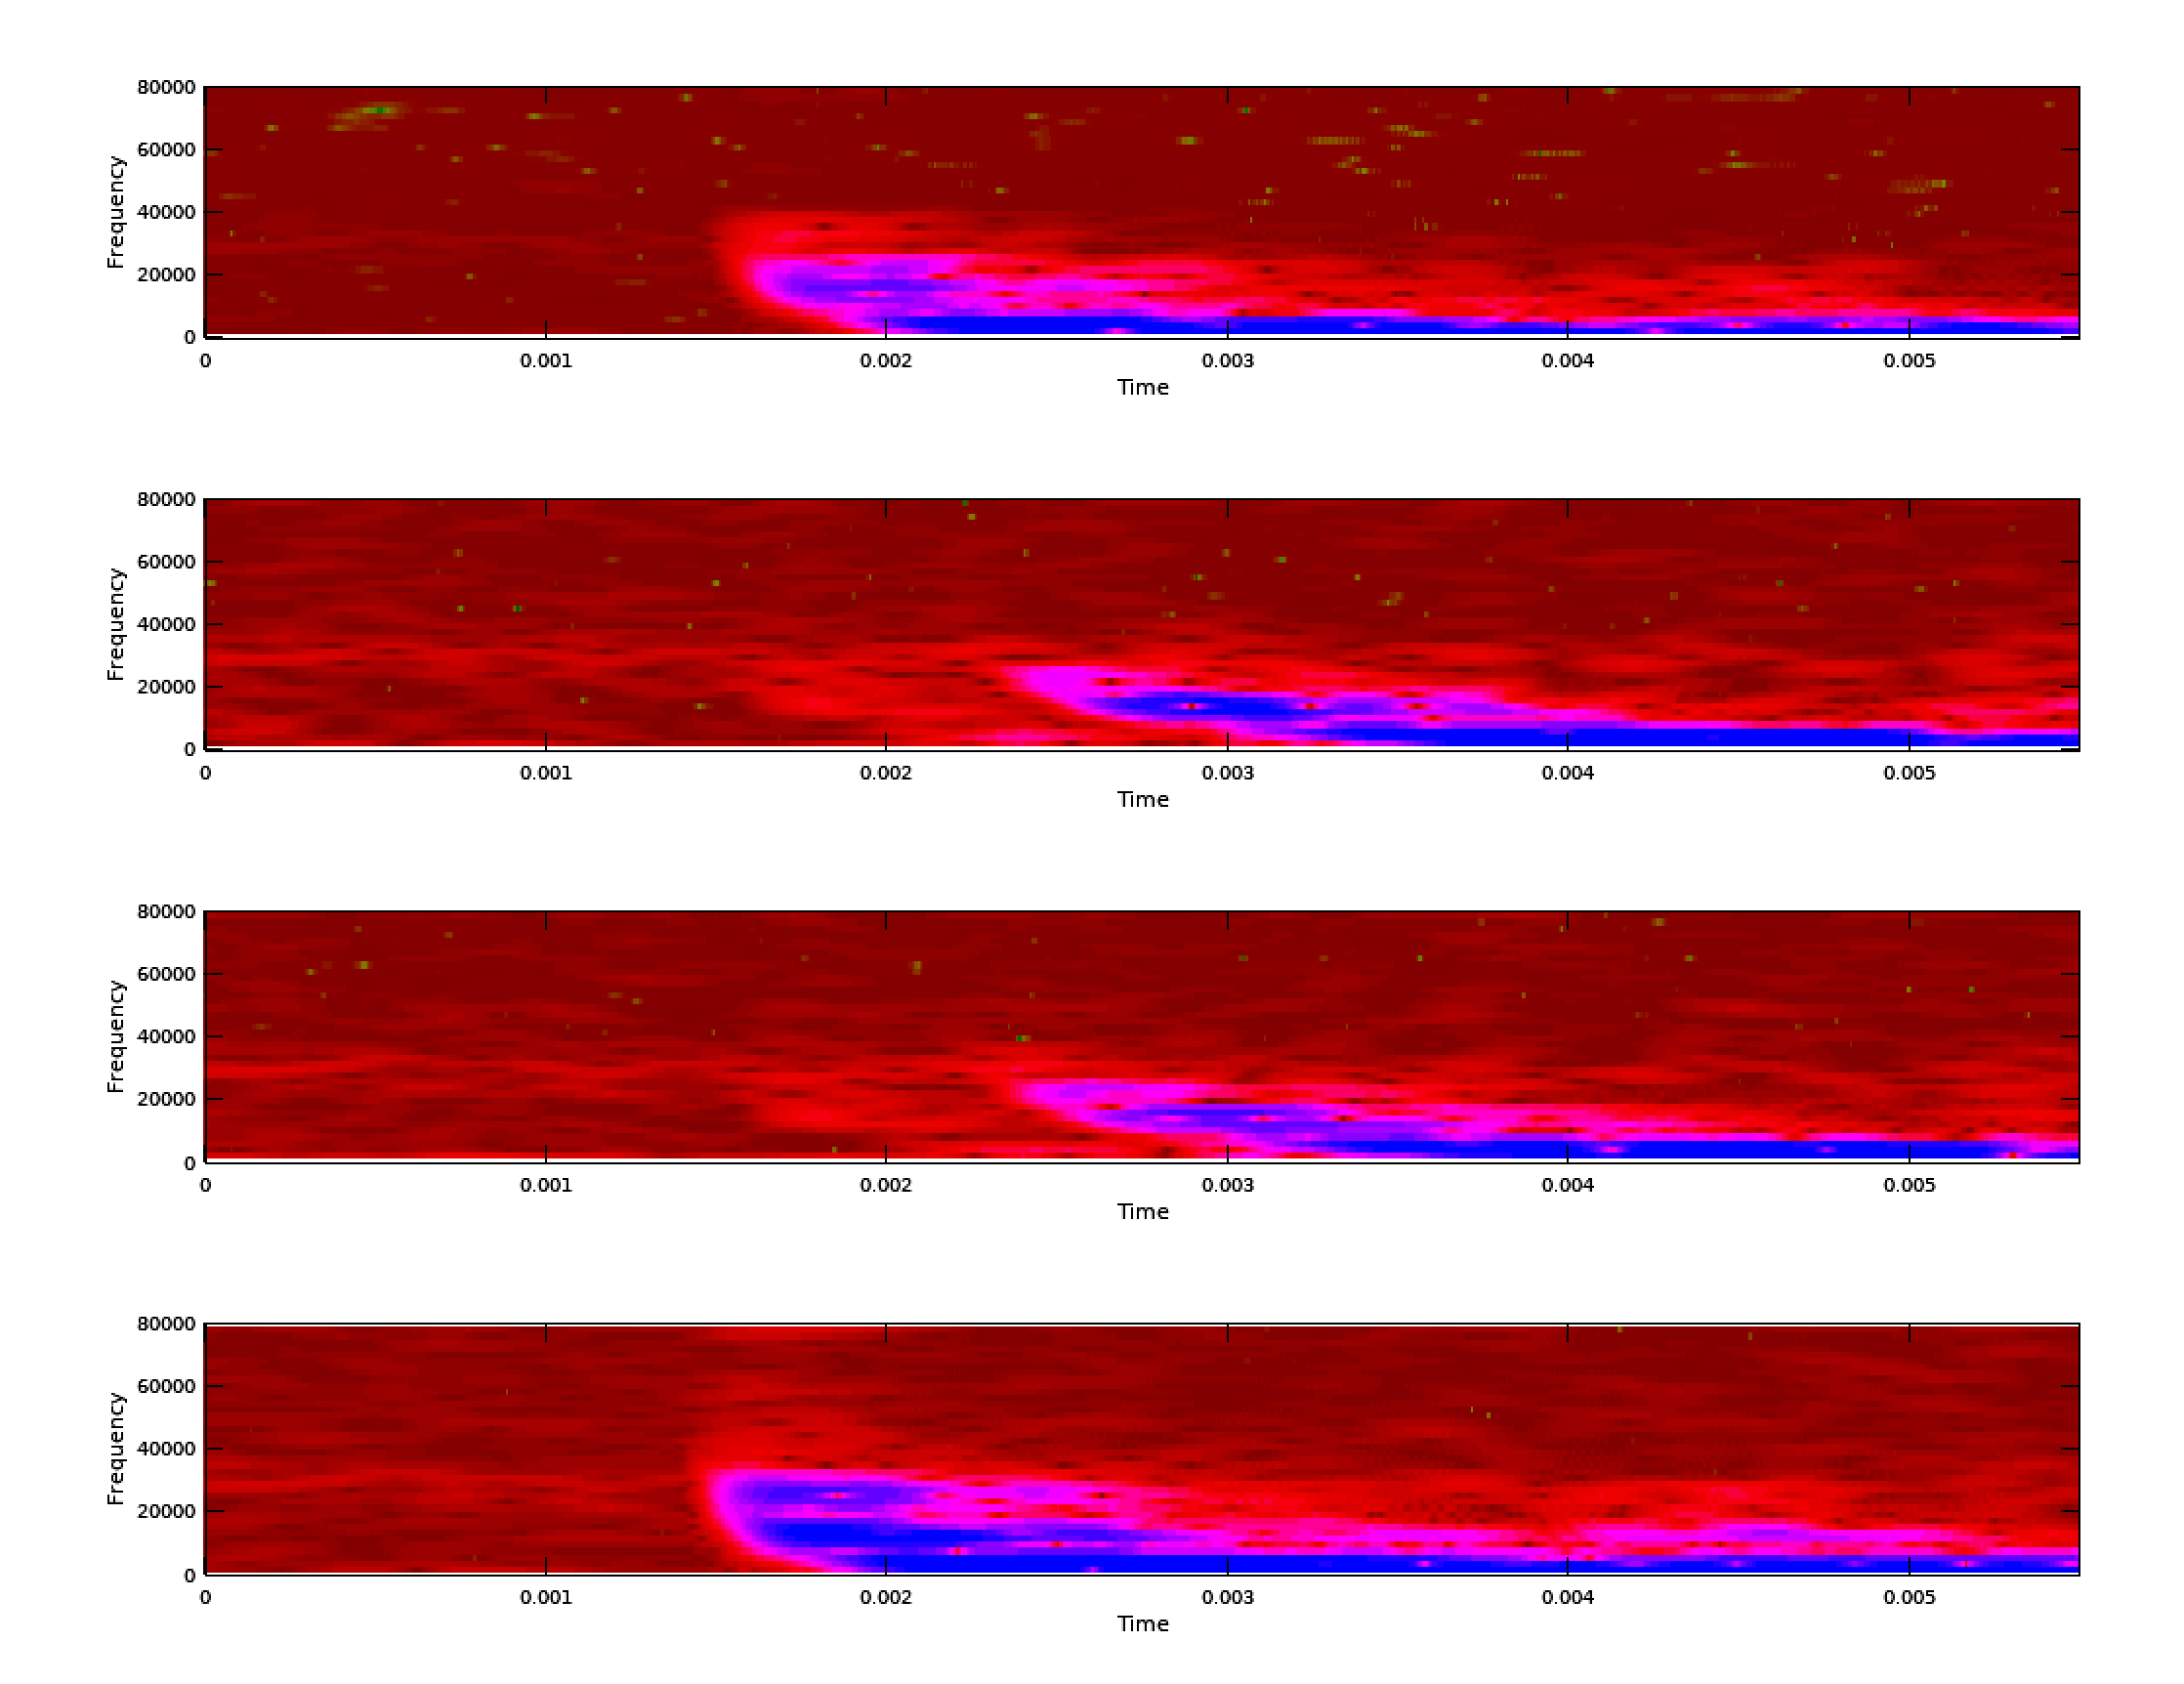
I never thought background noise could look so beautiful. Also blue fireballs of signal!
It looks like there are two things going on here. There seems to be a bit of acoustic dispersion - the higher frequencies arrive earlier, and the low frequencies shift in time a bit. There seems to be a jump in the shift at the very low end through, and I still think those are possibly transverse vs longitudinal waves.
But if anything is certain, I need to filter to a smaller vertical slice to get a consistent time delta.
Previous alignments were for equidistant sensors, so things aligned more easily. The various frequency bands hadn't phase-shifted apart.
So I tuned the FIR filter a bit, and I'm grabbing stuff right around 20Khz.
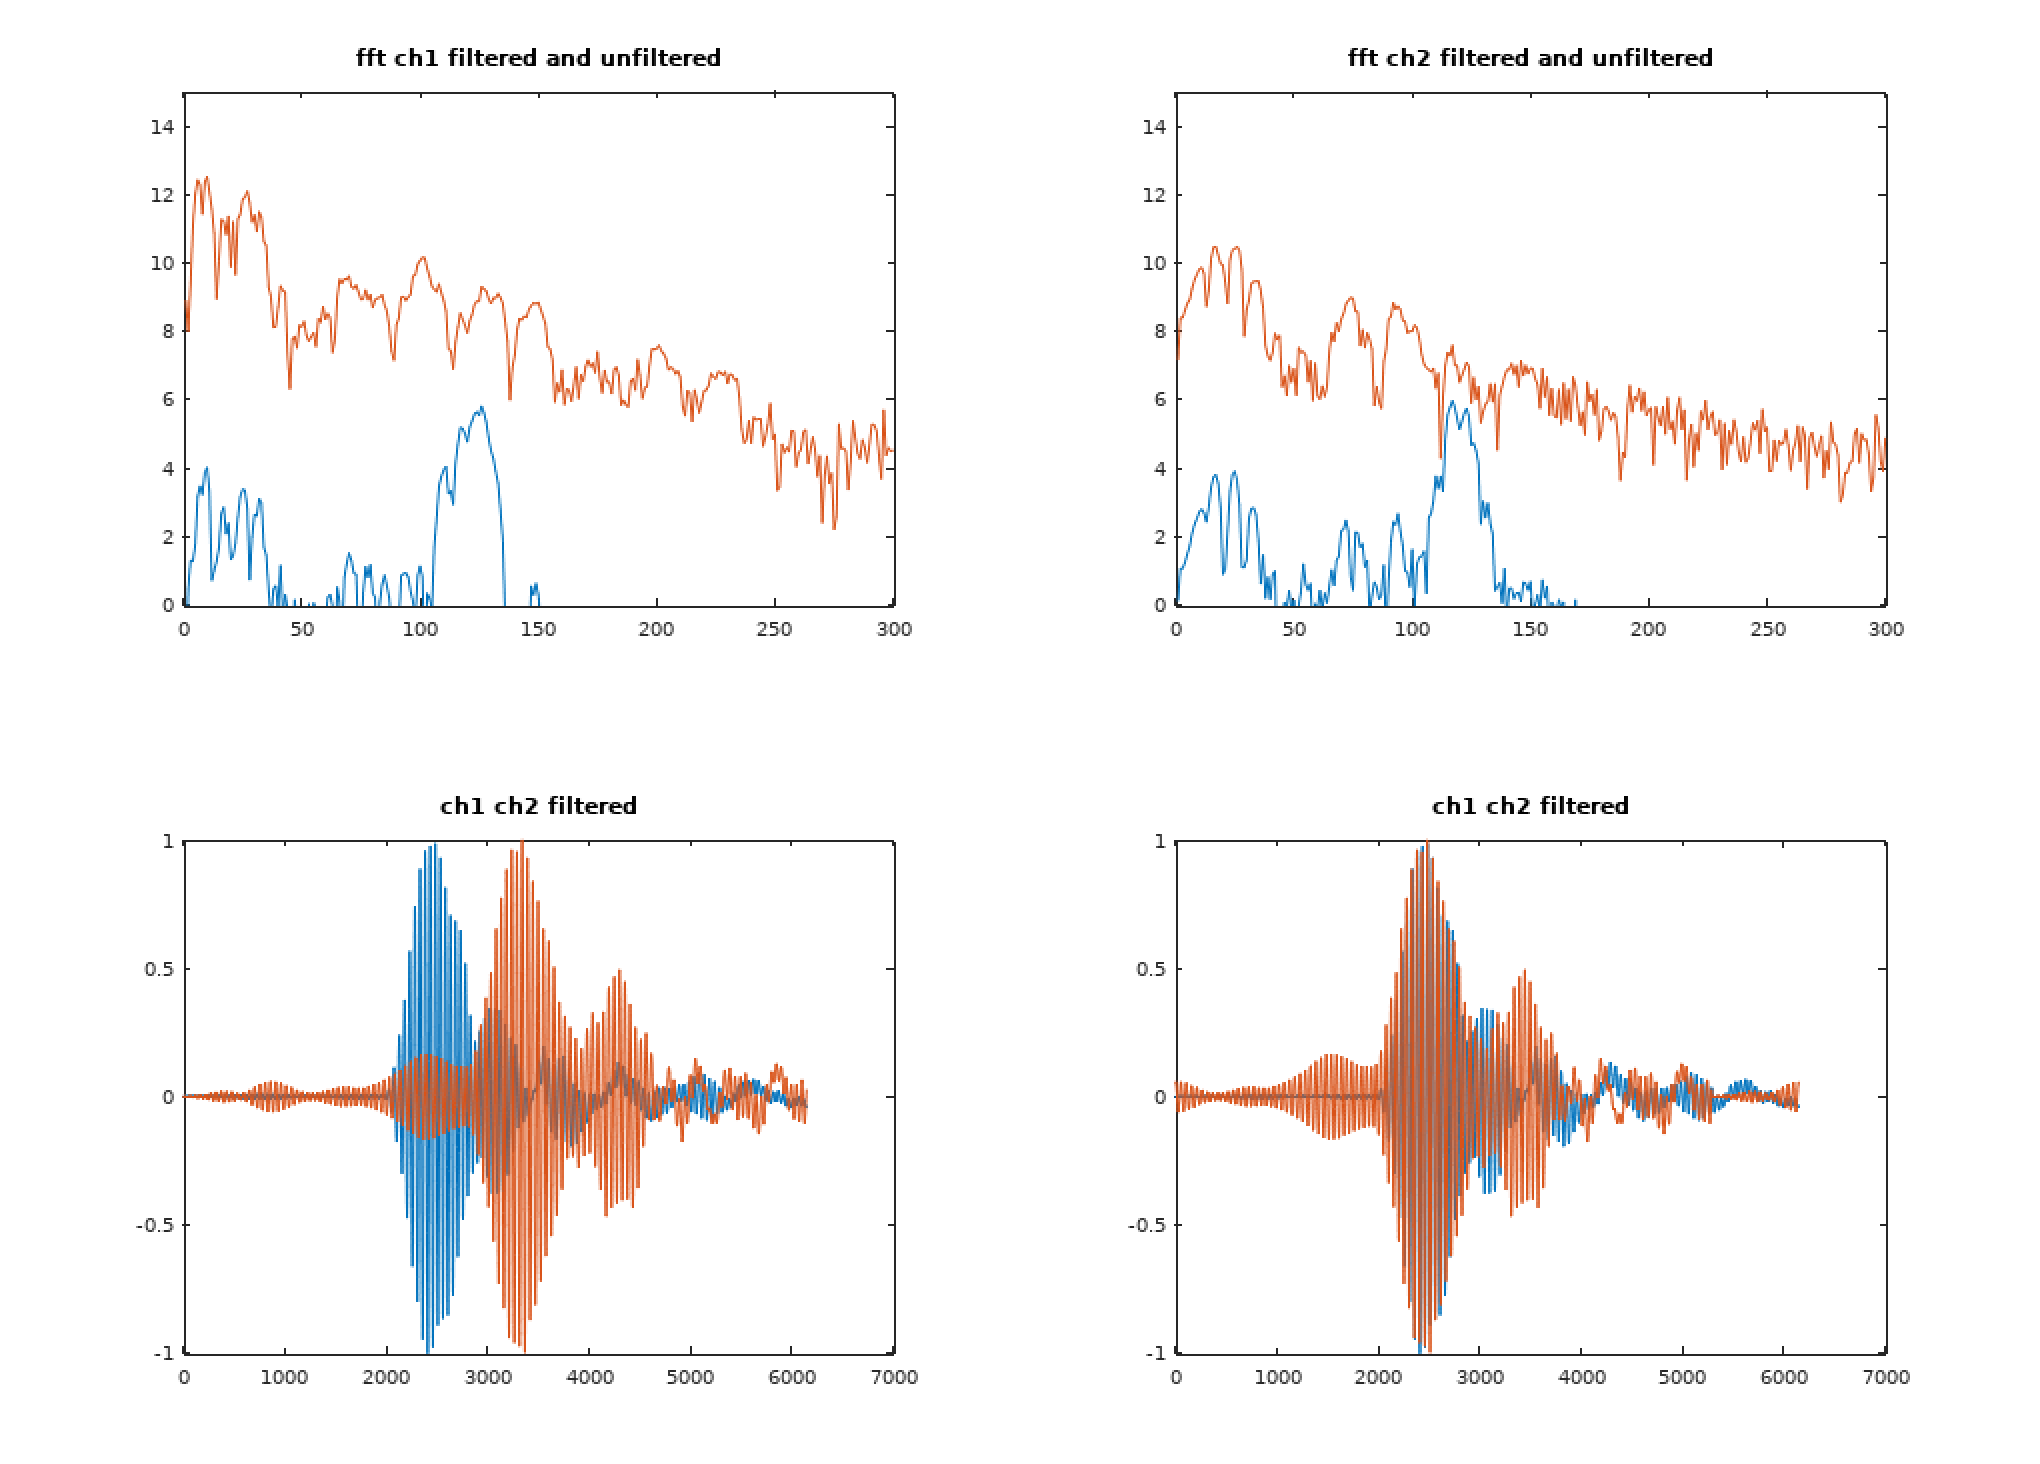
The top graphs are FFT of a before and after. The bottom are the waveforms before and after cross correlation alignment.
As I move from GNU Octave to the STM32 where resources are tighter, this is lot to crunch across a huge sample. I'd like to keep the number crunching to a minimum, and I don't need/want any alignment of the echoes and other things that happen after the leading pulse.
Using peak detection works remarkably well on the filtered signal, but not perfect. Getting a smaller window around the peak and cross correlating that seems to work well.
I tried filtering the full-wave version of the signal through a low-pass, but peak detection on just one half seemed to have similar results, and I plan to use cross correlation anyway as it is going to phase align the waveform phase better than anything else will.
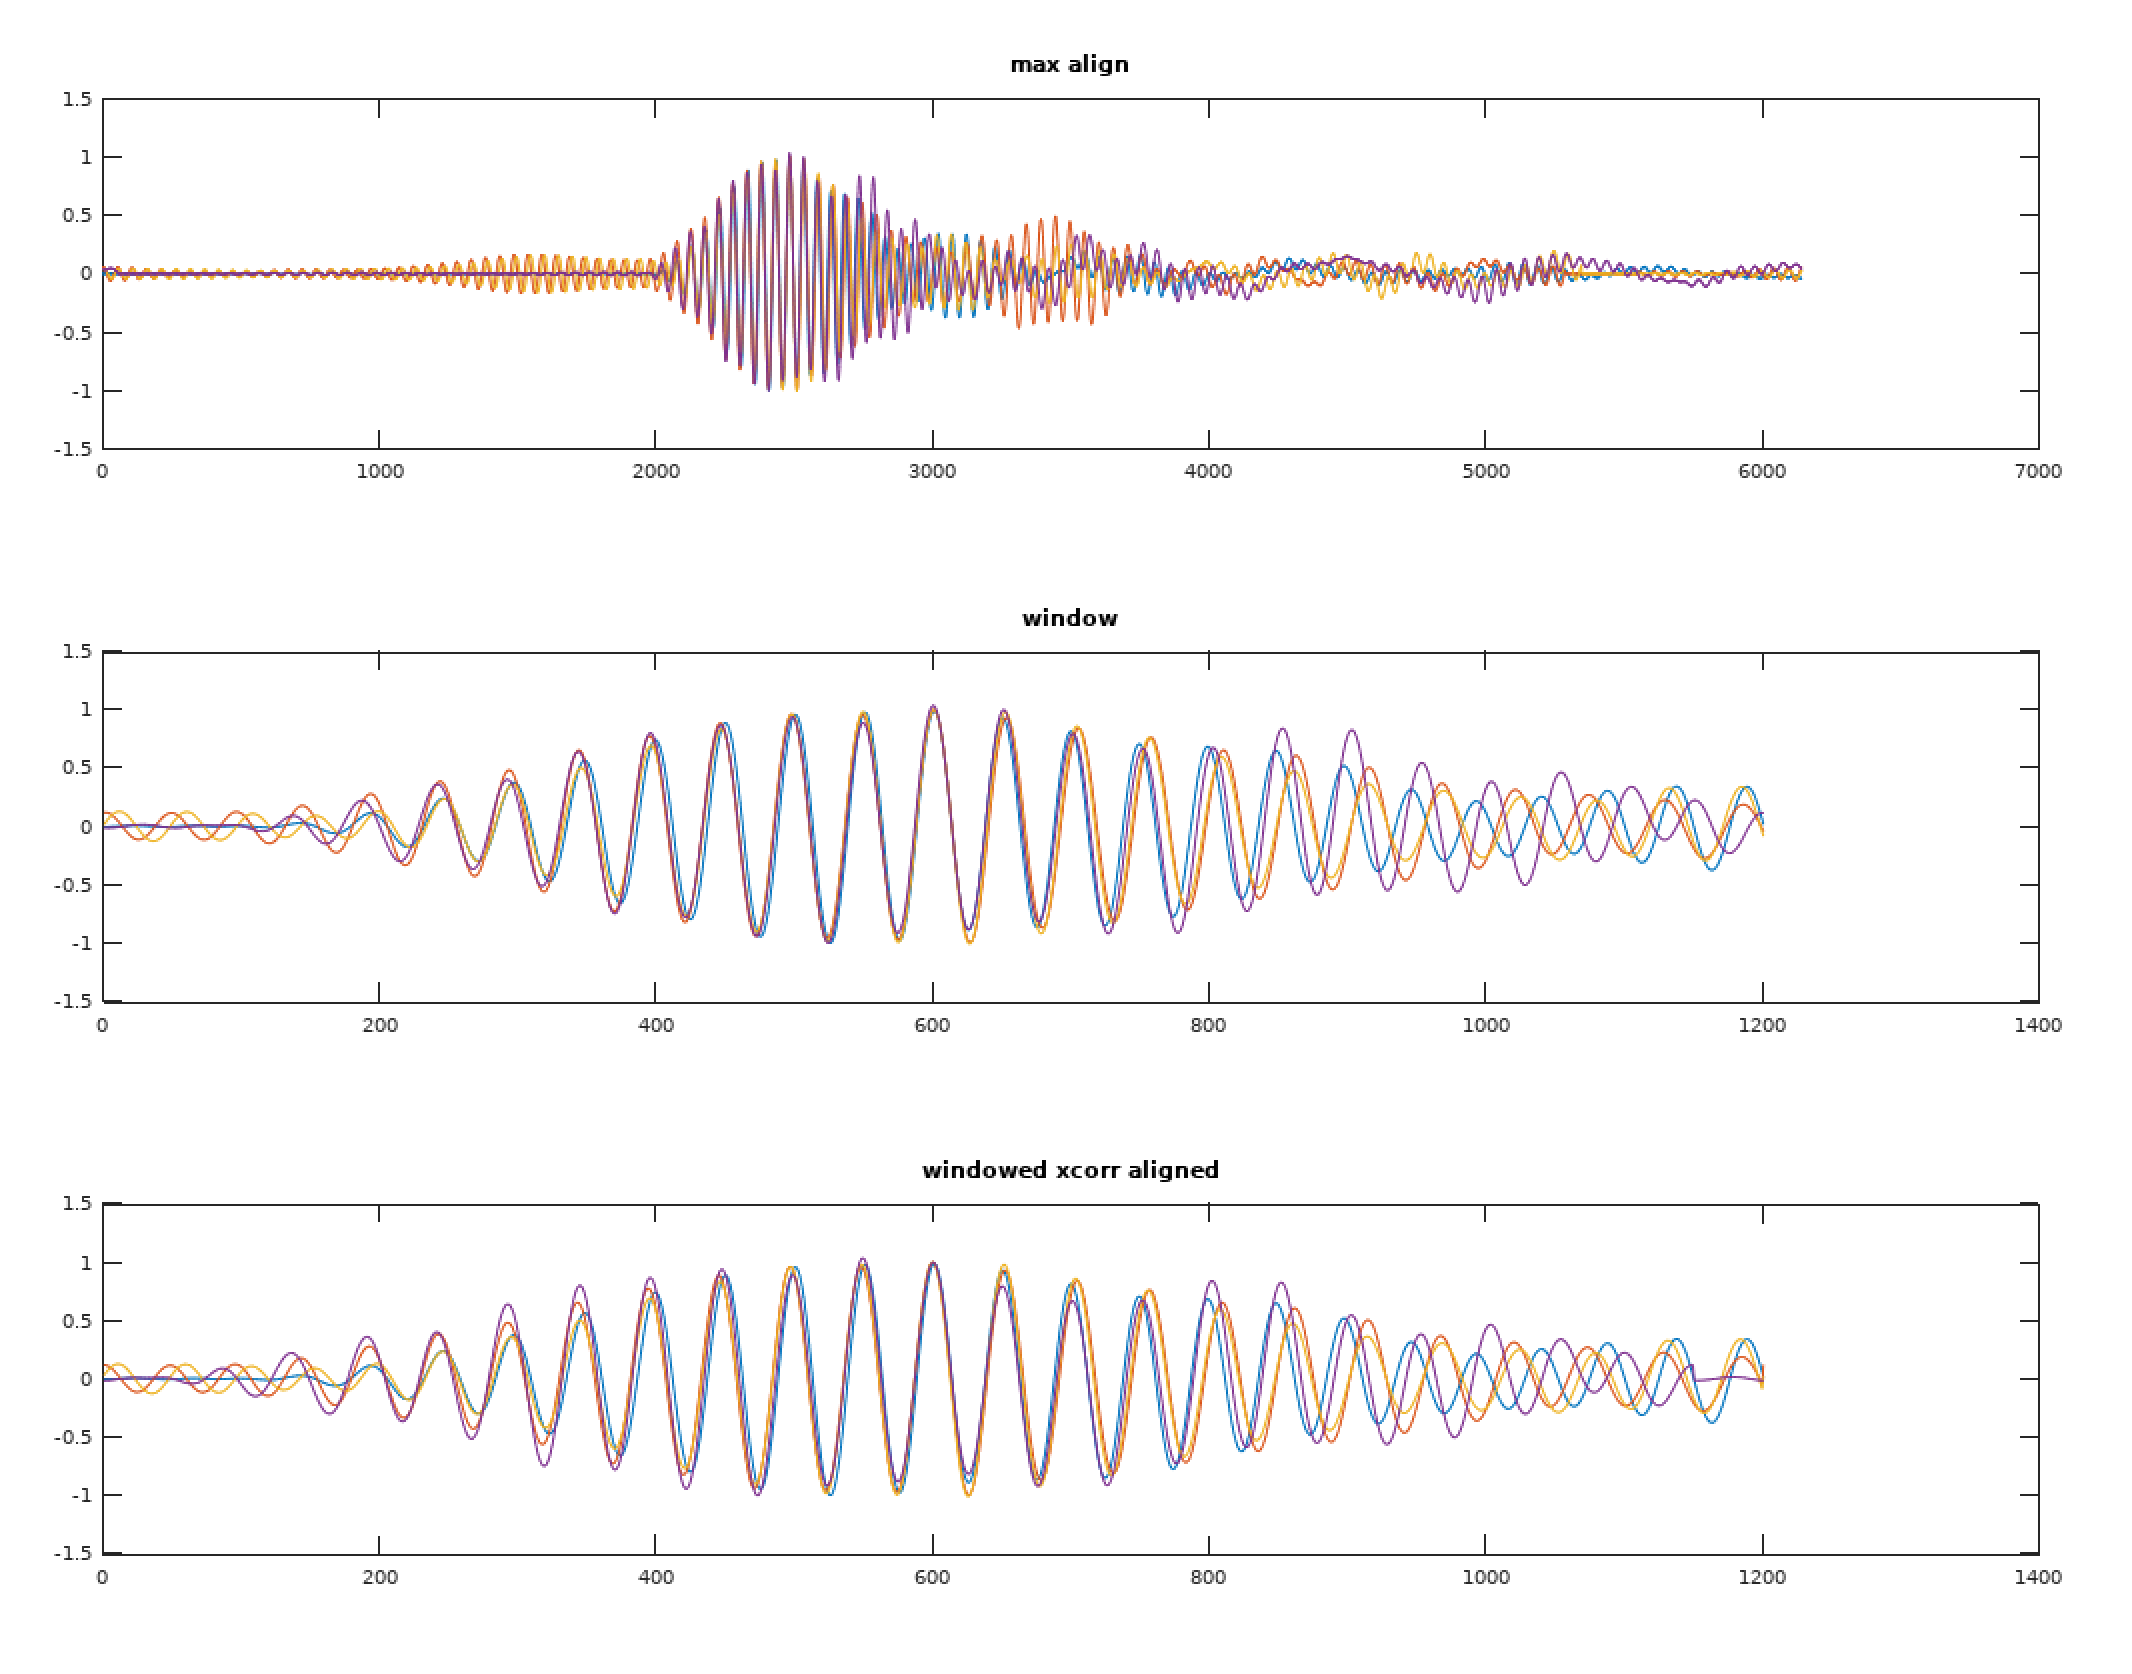
In most cases the peak-based alignment had the phase within 1 sample of what cross correlation found. You can see it fixed channel 4 (purple) above that was 1 period off.
The mind blowing part is when you go back and look at the original signal (normalized, but otherwise unfiltered) and compare.
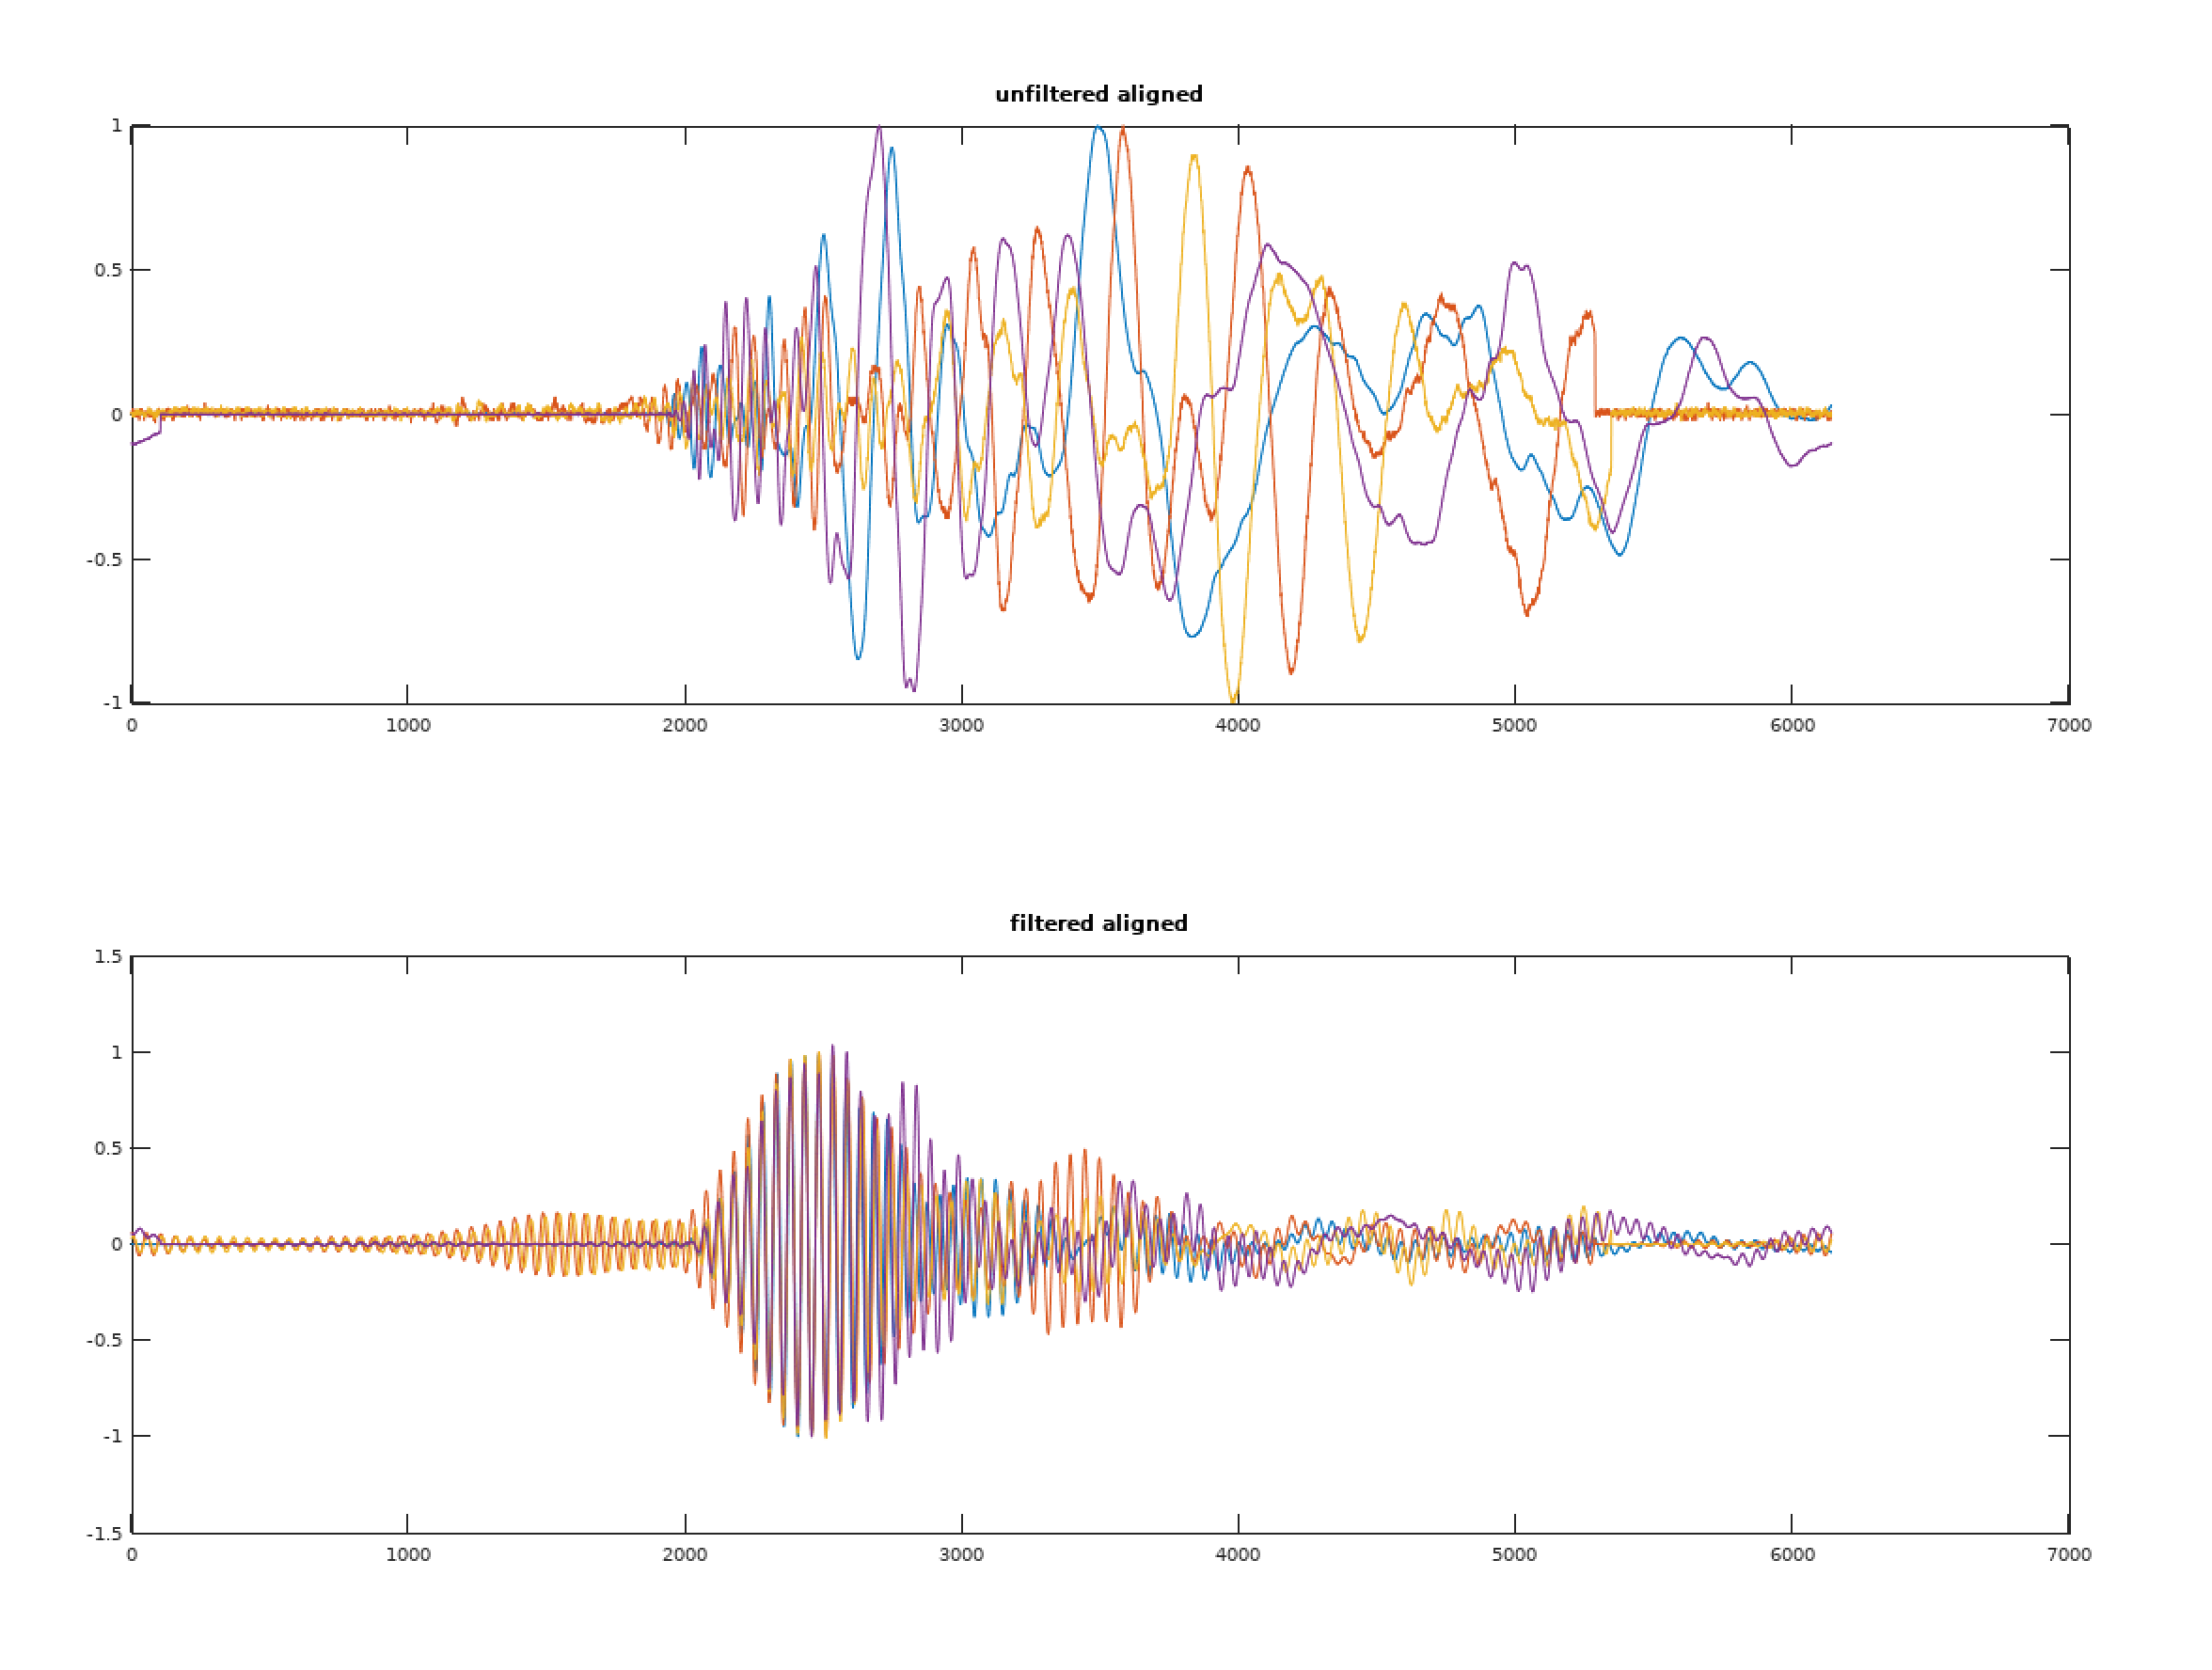
When looking at the above, keep in mind that the FIR filter has shifted things on the bottom graph by about 400 samples.
Now to port this into C using the ARM math libraries...
Discussions
Become a Hackaday.io Member
Create an account to leave a comment. Already have an account? Log In.