 George Gardner
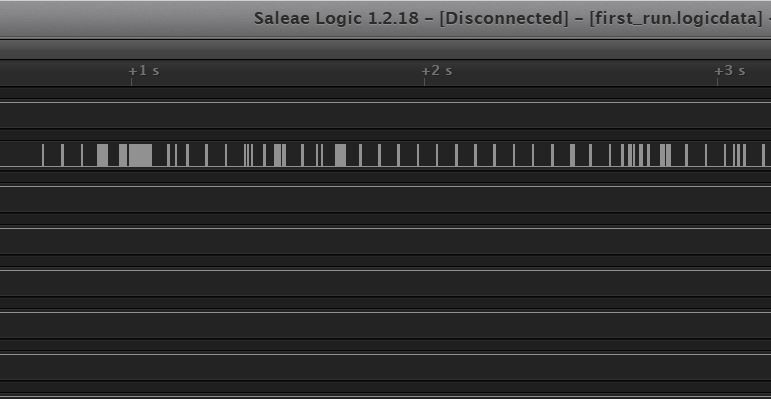
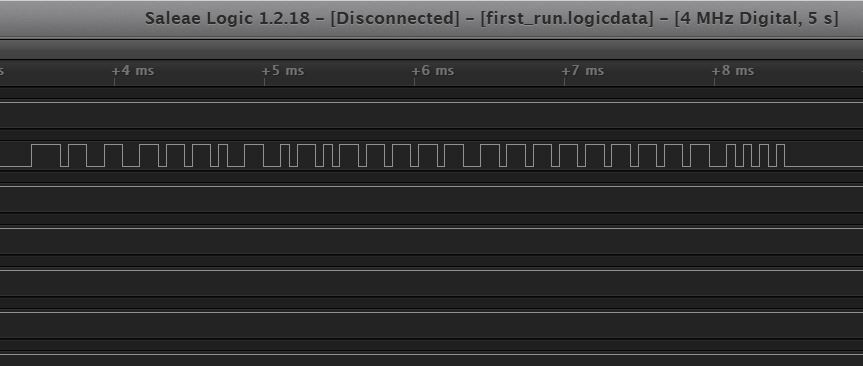
Rather than writing code to read the data bus in arduino and then porting the code to Atmel Studio for use on another microprocessor, I've managed to capture the J1850 VPW data and decode it using my Saleae Logic Analyzer and Microsoft Excel. As a test, I captured 5 seconds of data using my logic analyzer shown below.
To interface the 5v logic analyzer with a signal from the data bus that had a high of 7v, I used an emitter follower, and took advantage of the fact that the output on the emitter follower would be a diode drop lower than the input on the base of the transistor. I used the below schematic to read the bus using the logic analyzer.
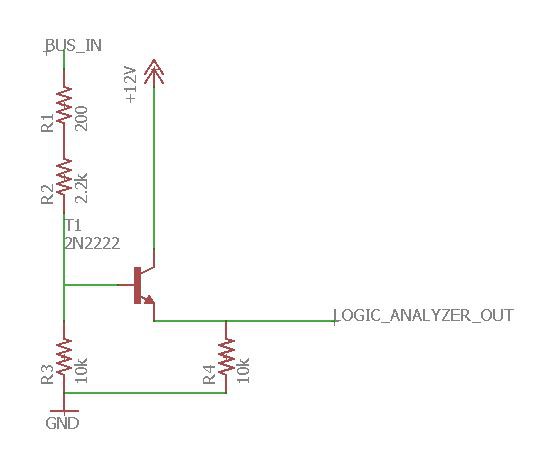
The +12v was connected to the motorcycle's +12 on the J1850 connector. The grounds between the motorcycle and the logic analyzer were connected together.
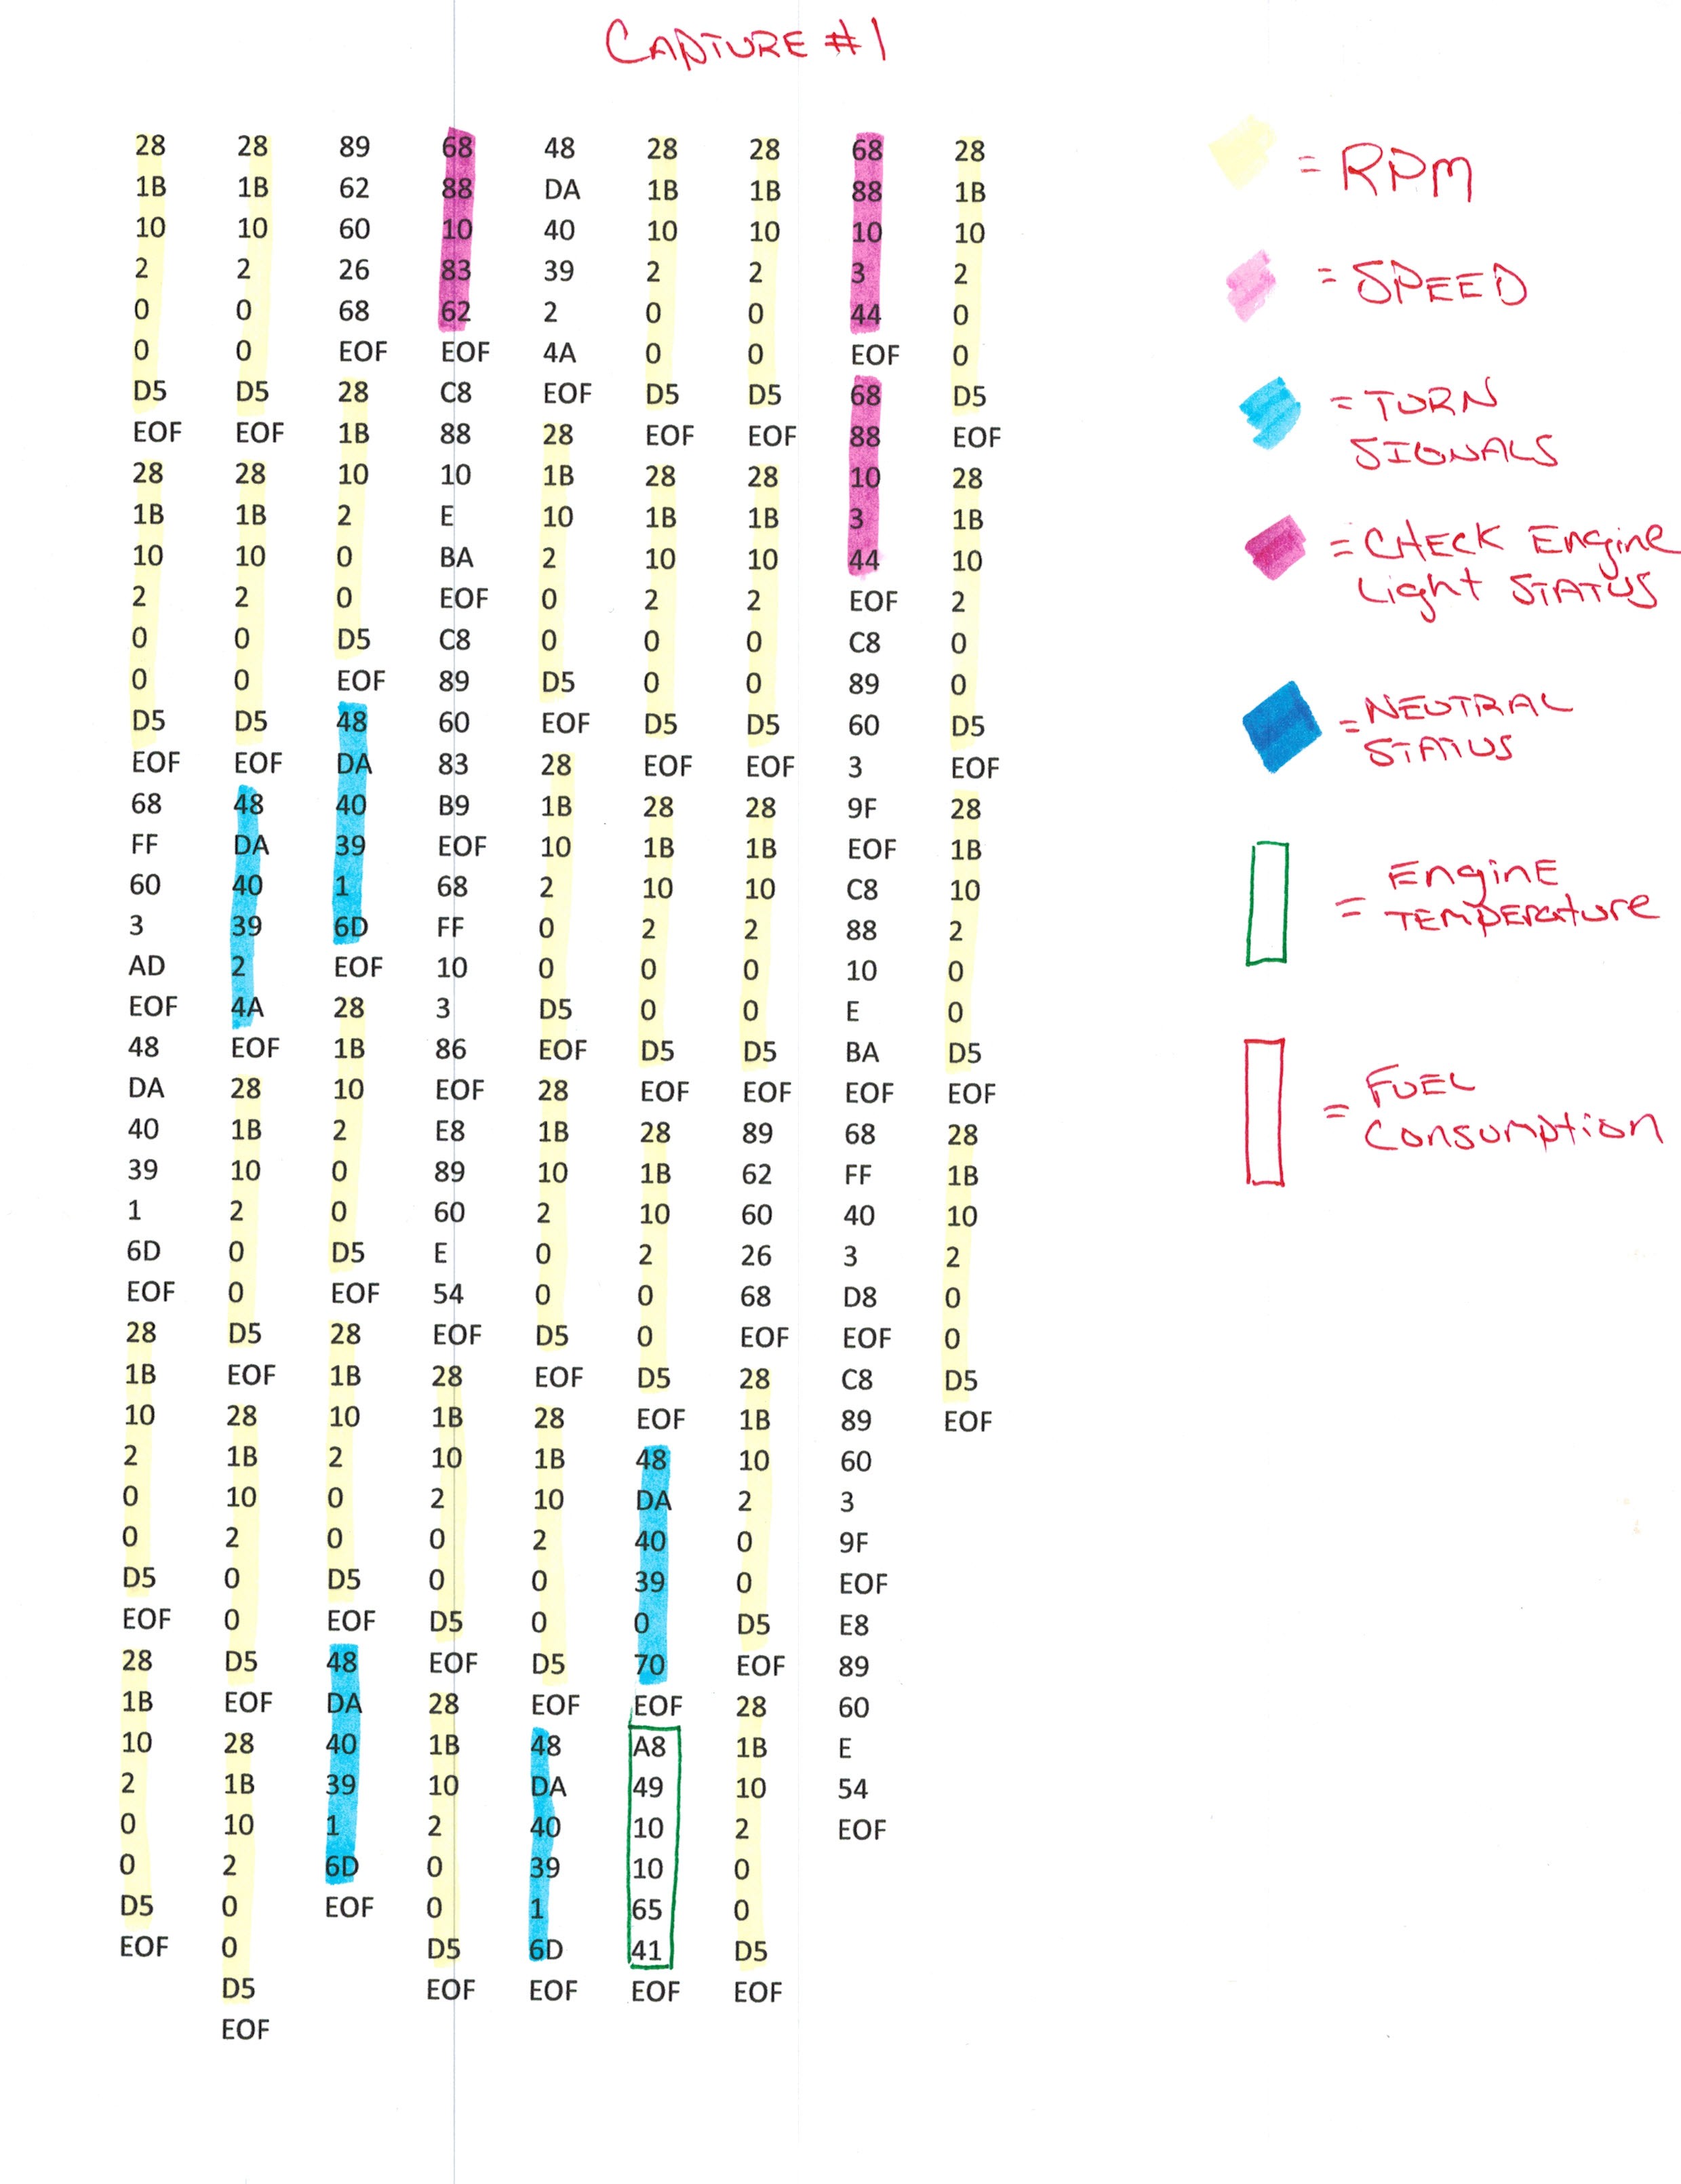
After I captured the data on my $10 logic analyzer, I exported to CSV, selecting "between the specified times" in the "samples to export" dialogue box. This way it only exported the change in state and timings rather than every sample that was collected.
I opened the csv and created formulas within excel that would take the timings, determine if they were active or passive 1's or 0's, then combine every 8 bits within a frame, and finally convert the binary to hex.
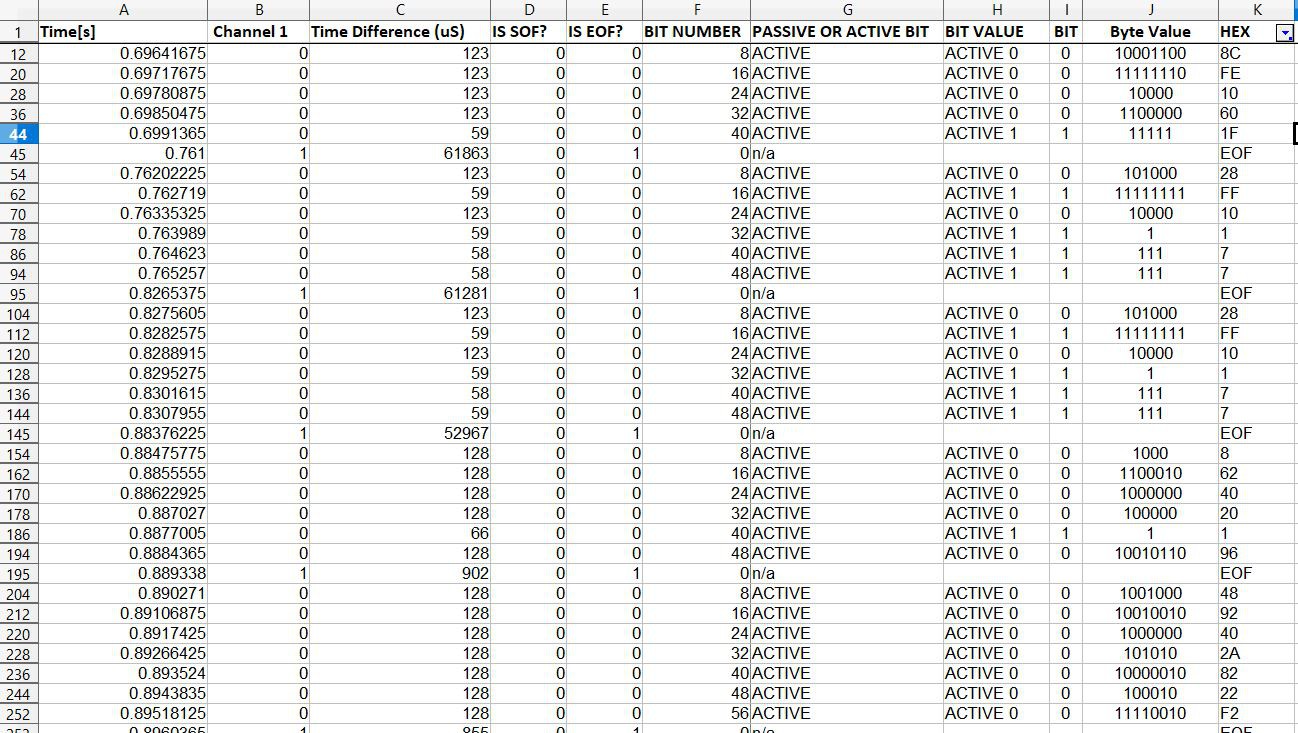 SOF and EOF are Start of Frame and End of Frame, respectively. I've begun to decode some of the data, but there is extremely little documentation, and no official documentation on what the codes stand for and mean. This could take a while...
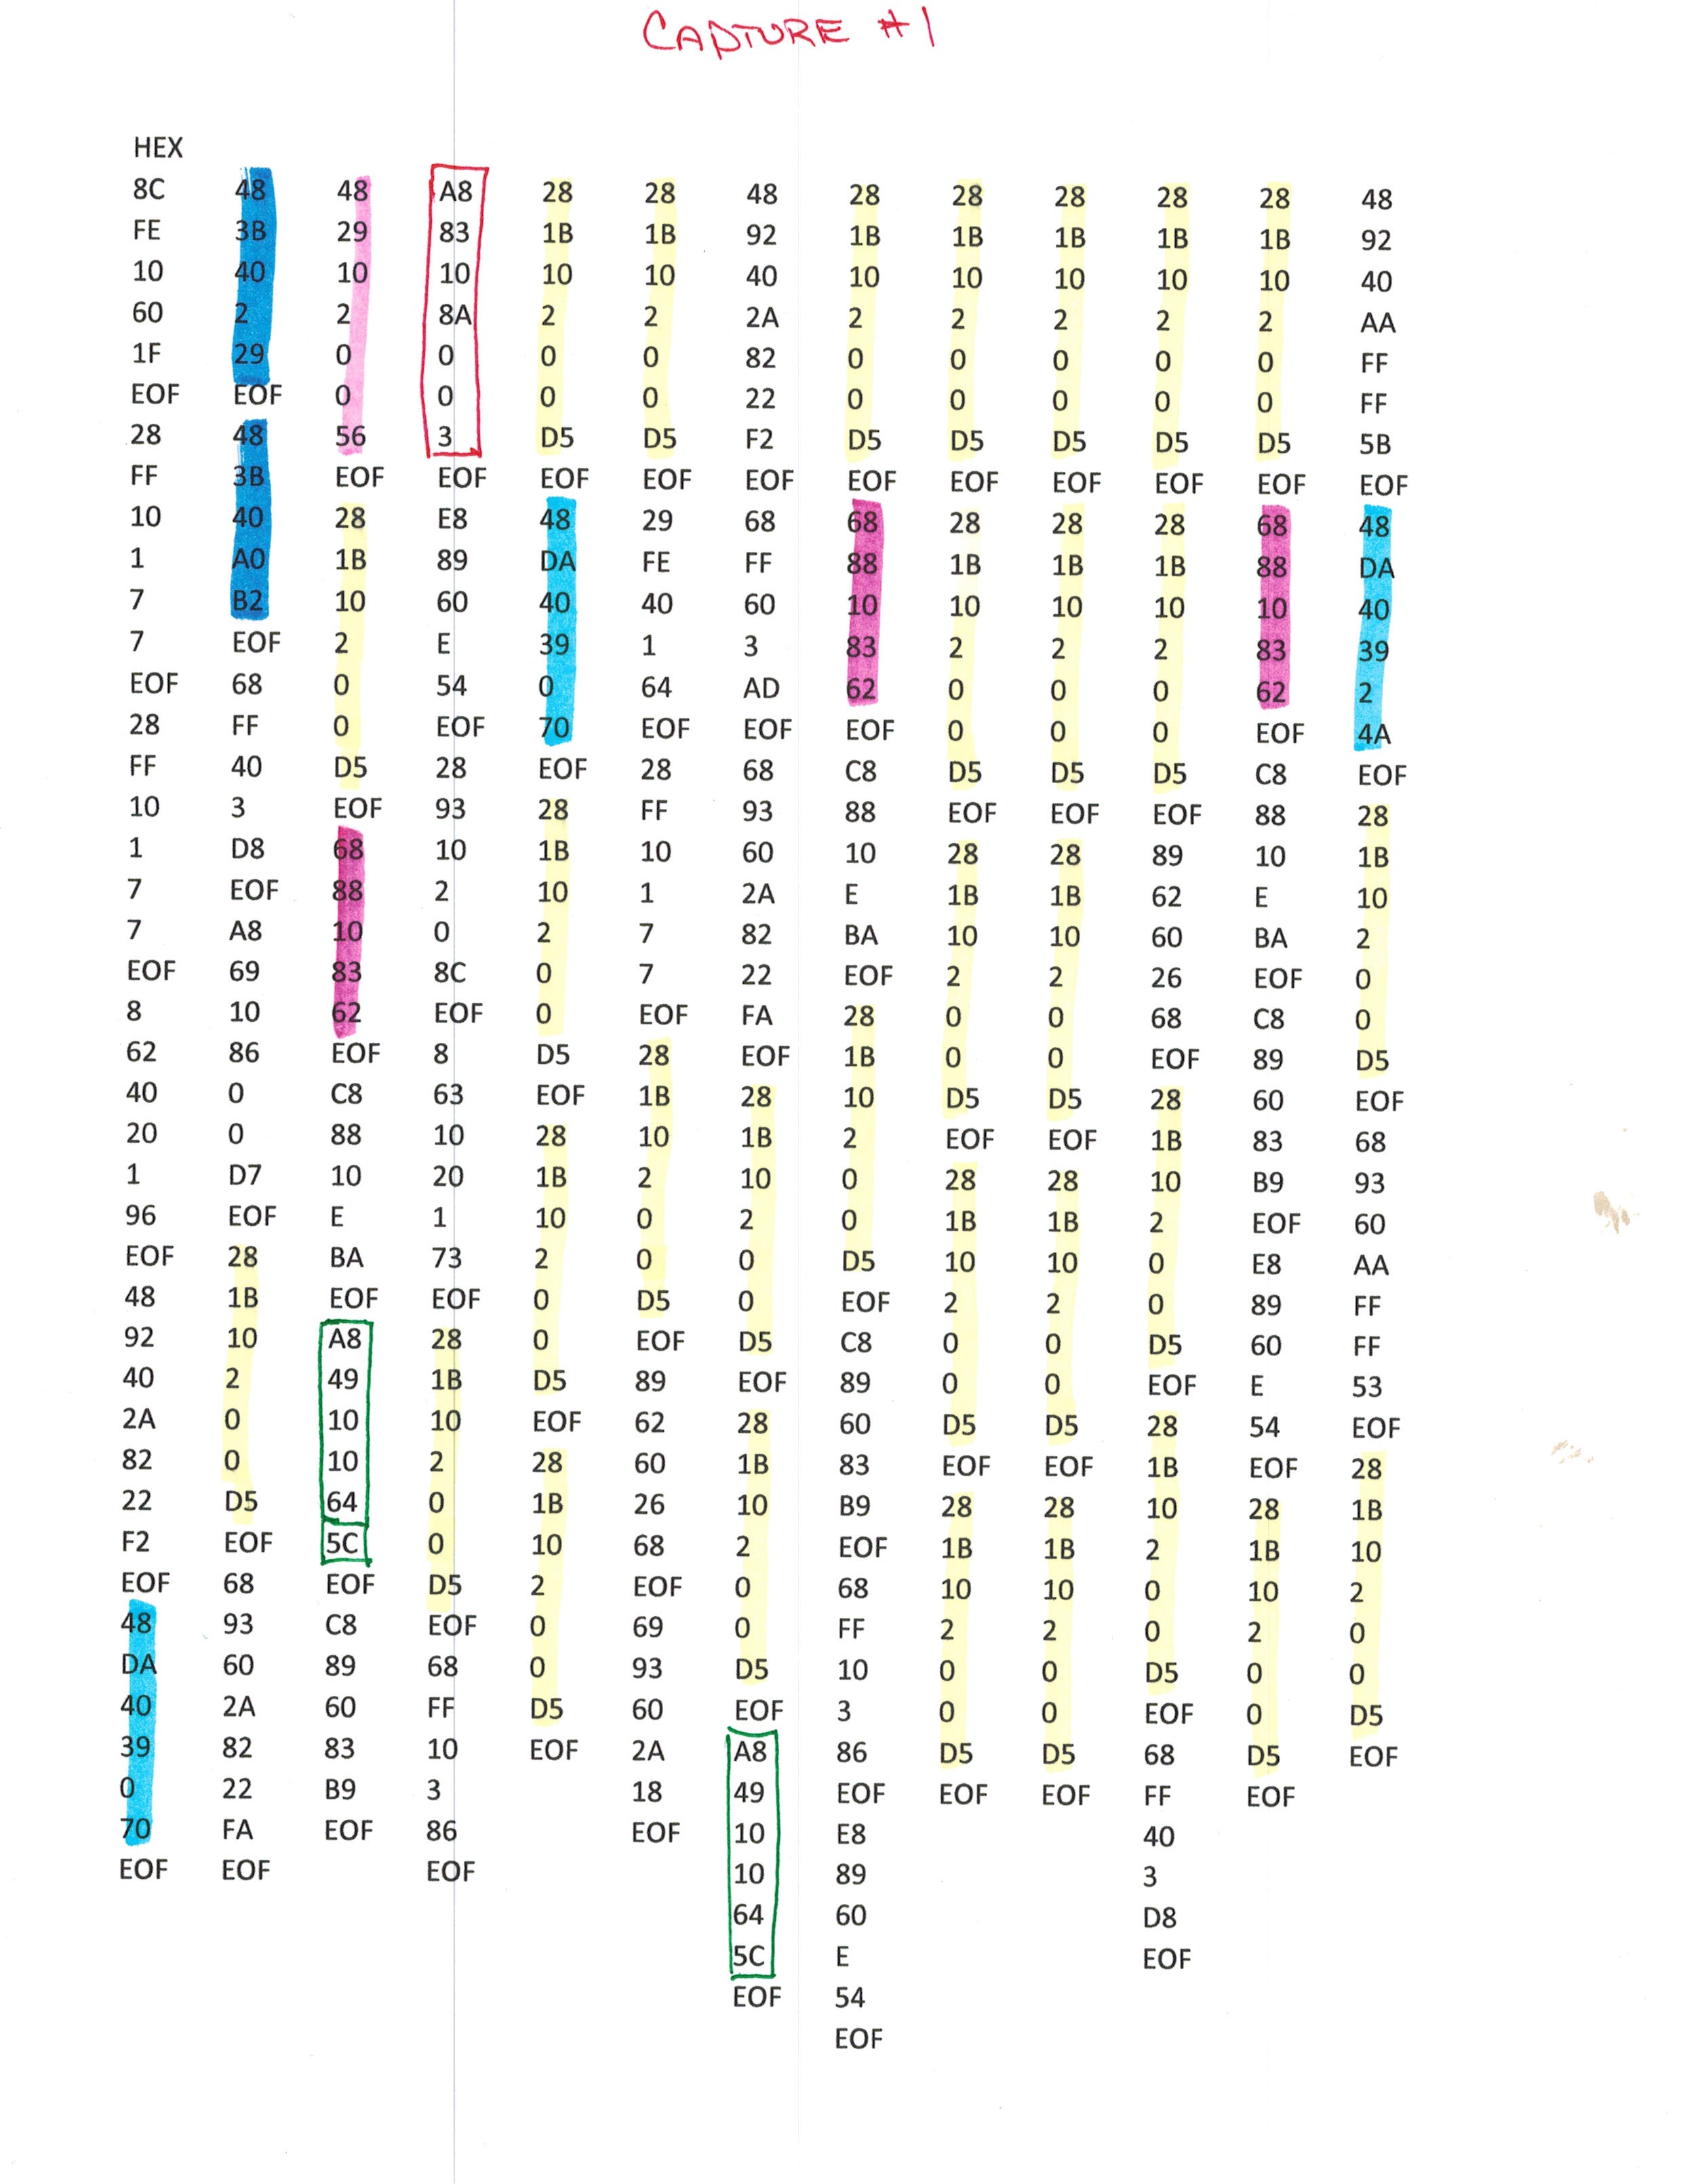
Discussions
Become a Hackaday.io Member
Create an account to leave a comment. Already have an account? Log In.