 Matthias Koch
Which colours are LEDs sensitive to ?
LEDs are nice for illumination, and sometimes, LEDs are used as a colour sensor. But I wished to use a handful of LEDs as a spectral sensor with more channels than just red, green blue...
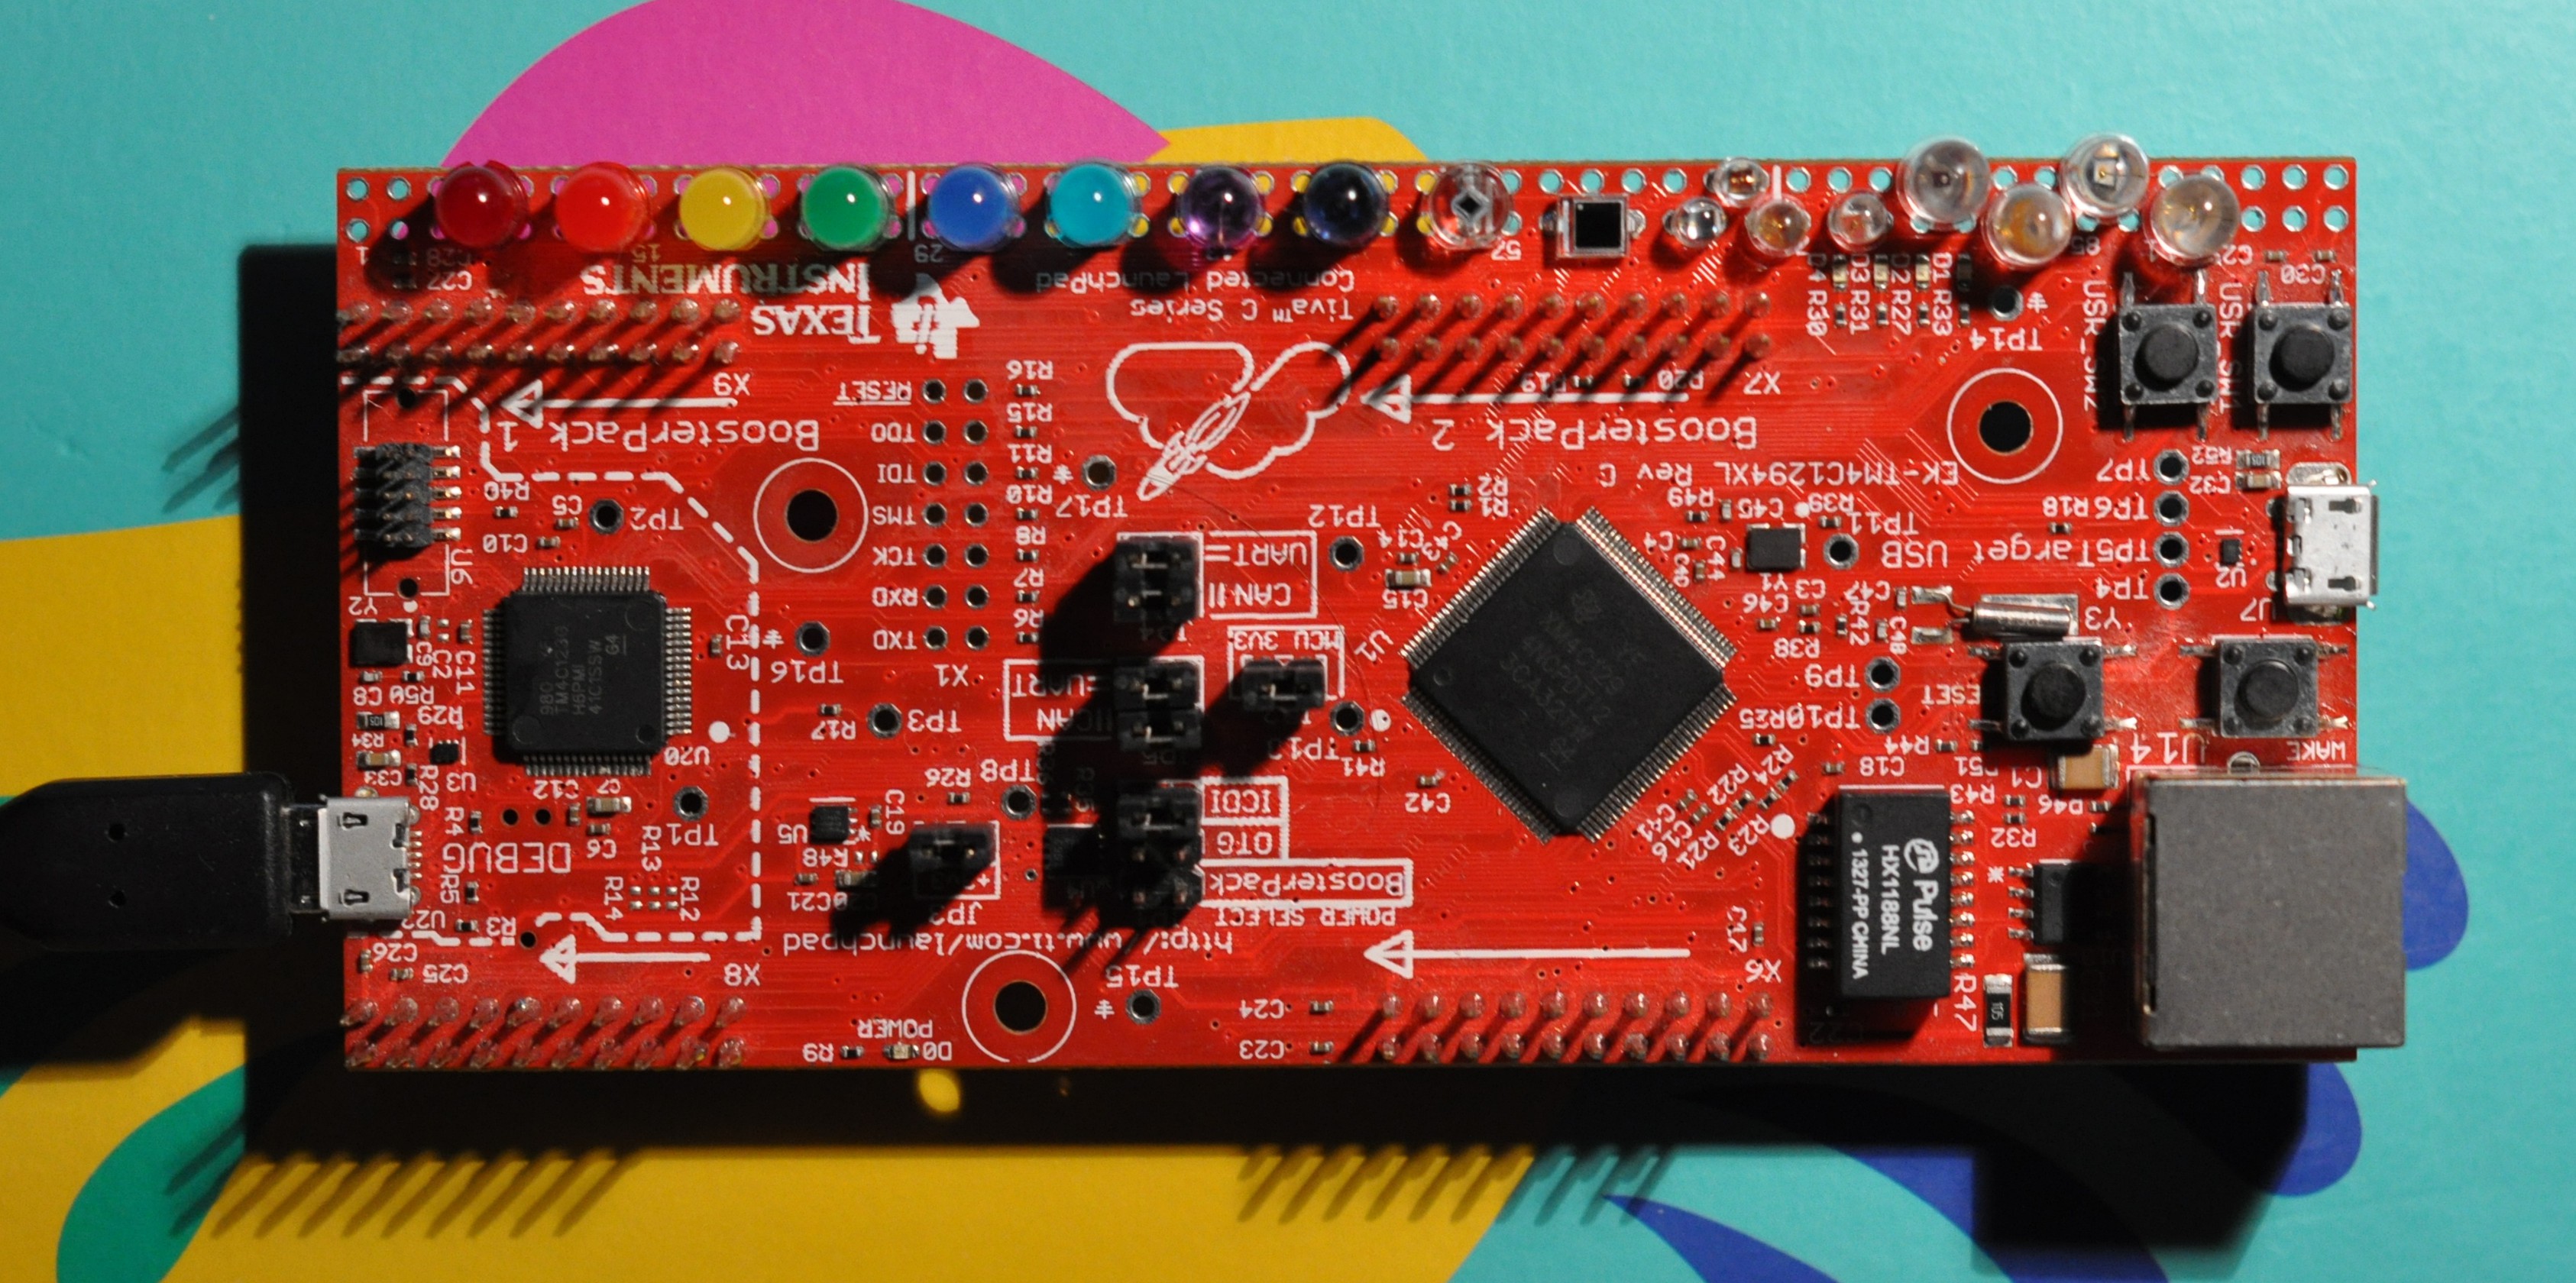
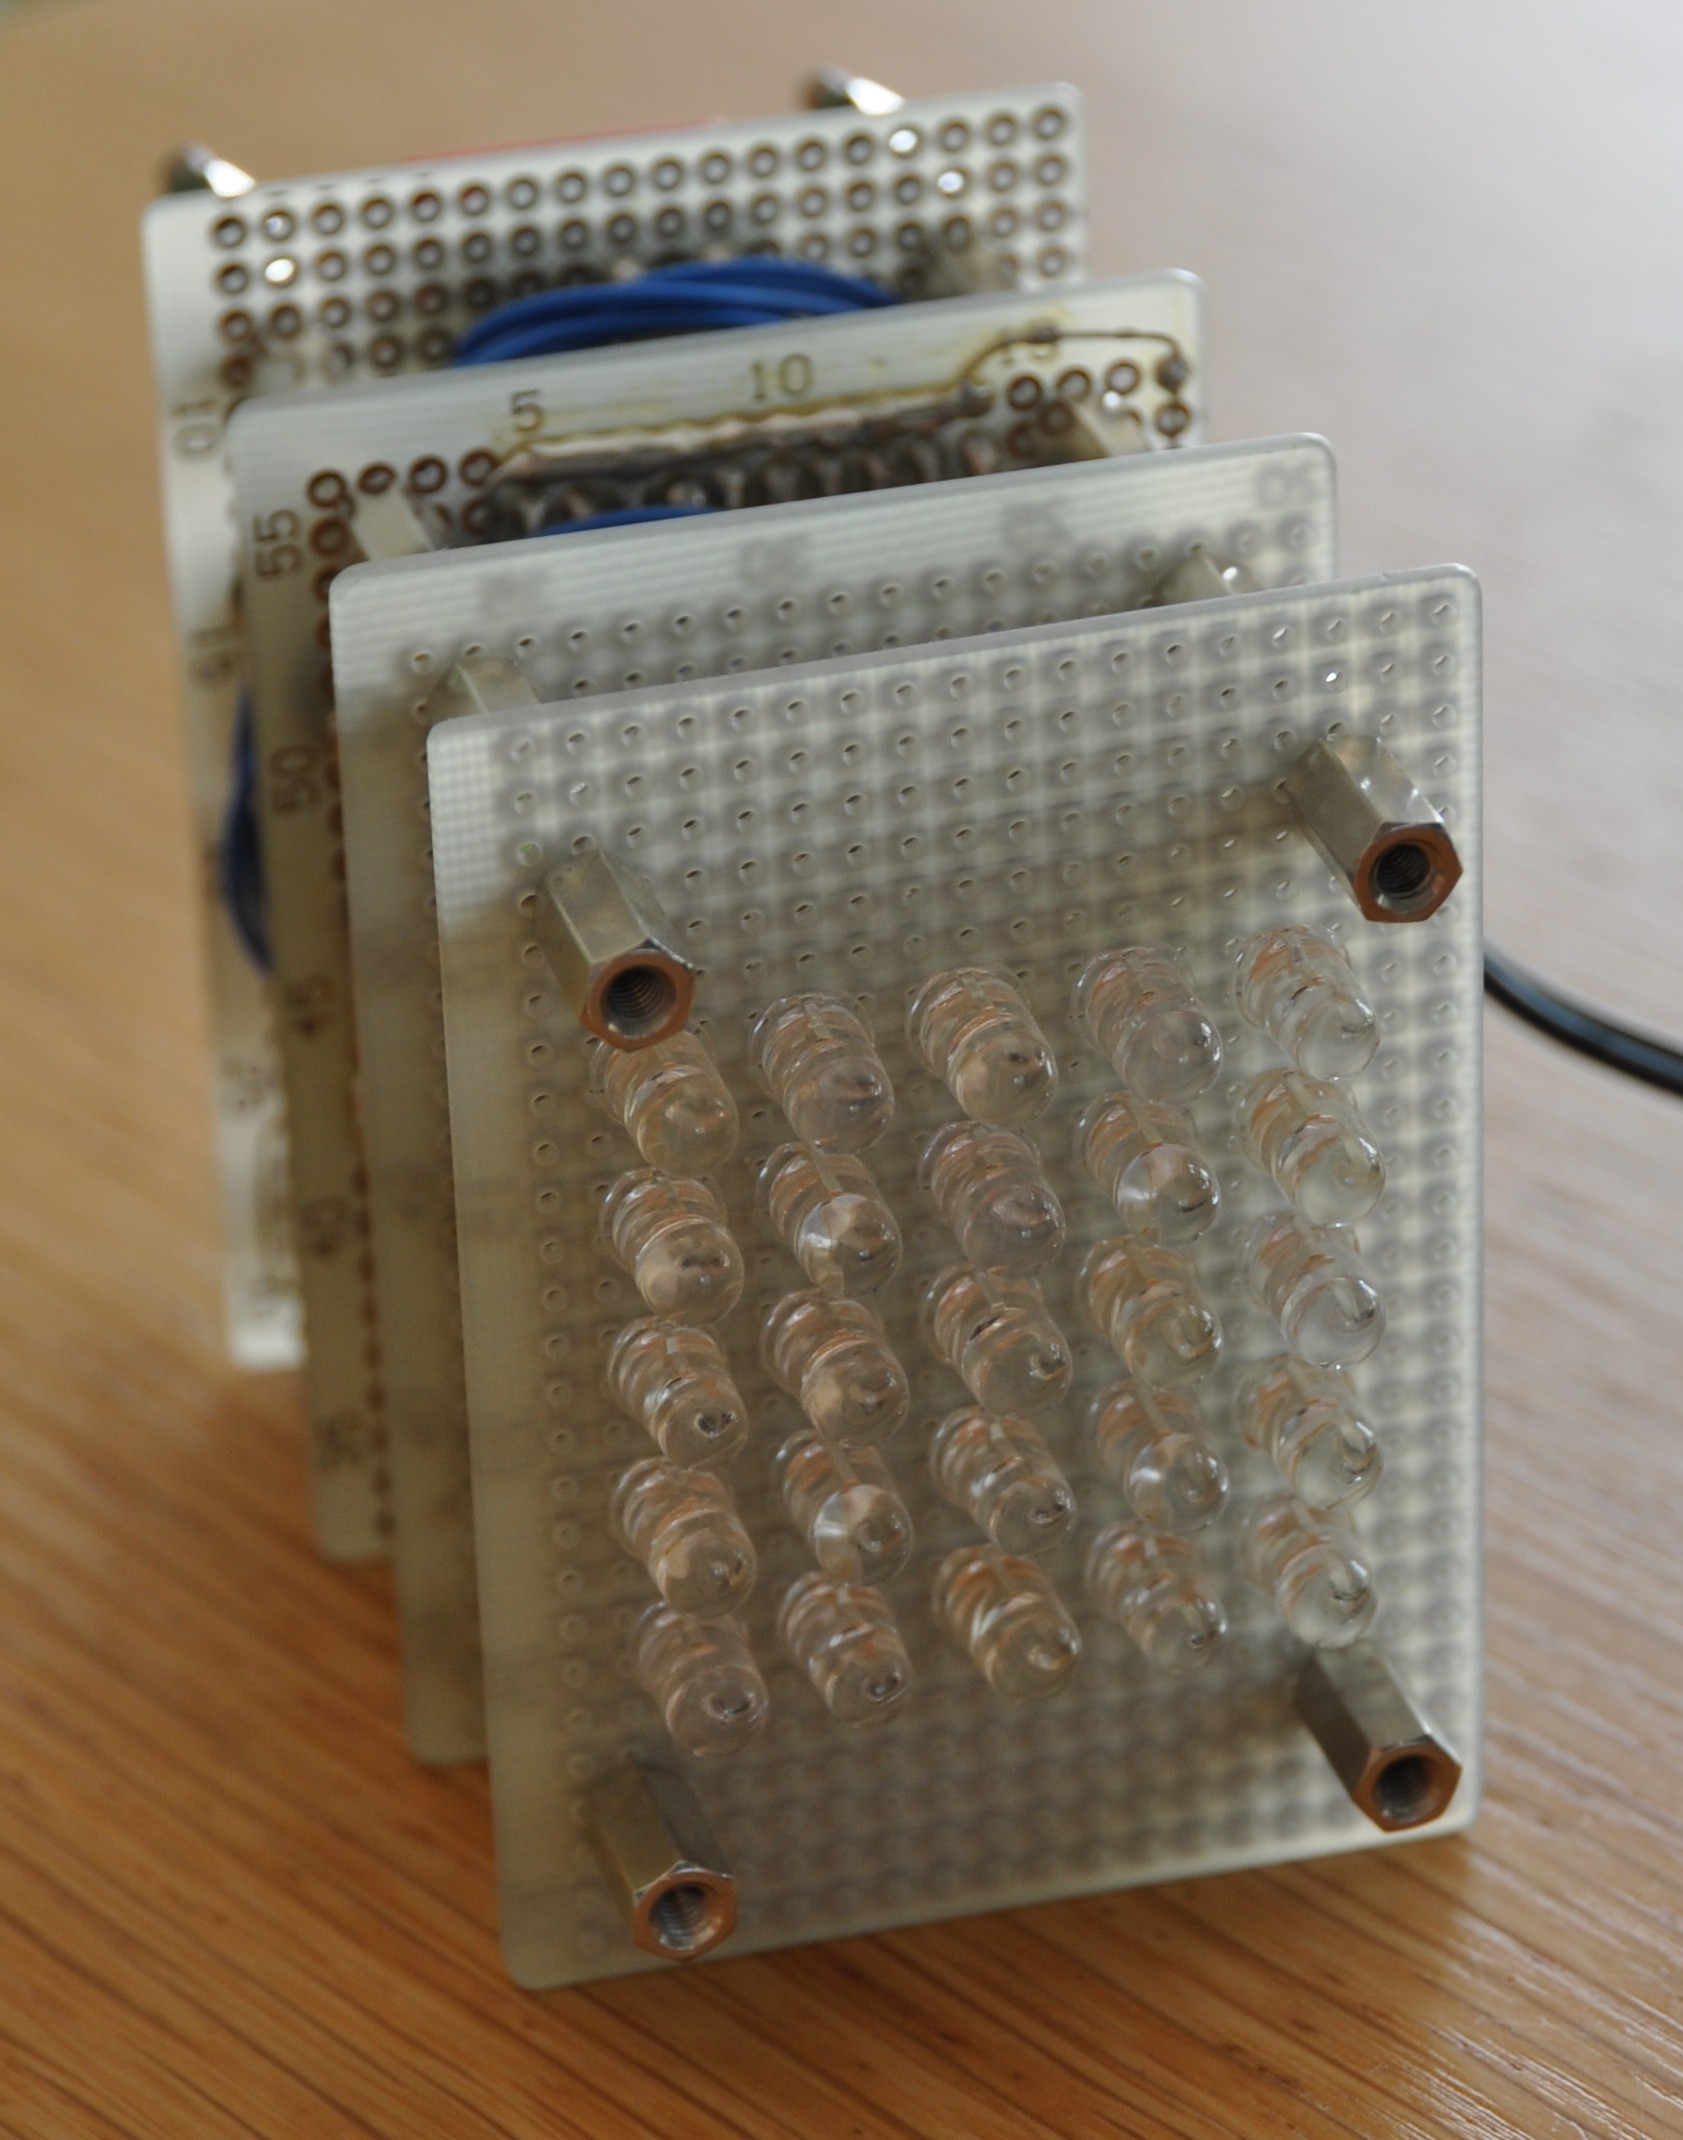
So I soldered 14 different visible LEDs, two infrared LEDs and two photodiodes to a microcontroller board, using the same measurement principle as in https://hackaday.io/project/19244-leds-as-photodiodes-for-1-kb-challenge
Basically, every LED is connected with both anode and cathode to GPIO pins, anode is set low, cathode is set high, and then cathode is switched to input. Photo current discharges the junction (and wire) capacitance, and the time until the cathode input pin toggles is measured.
Channel list (1 to 6 are normal brightness tinted LEDs, 11 to 18 clear high brightness LEDs):
01 Red
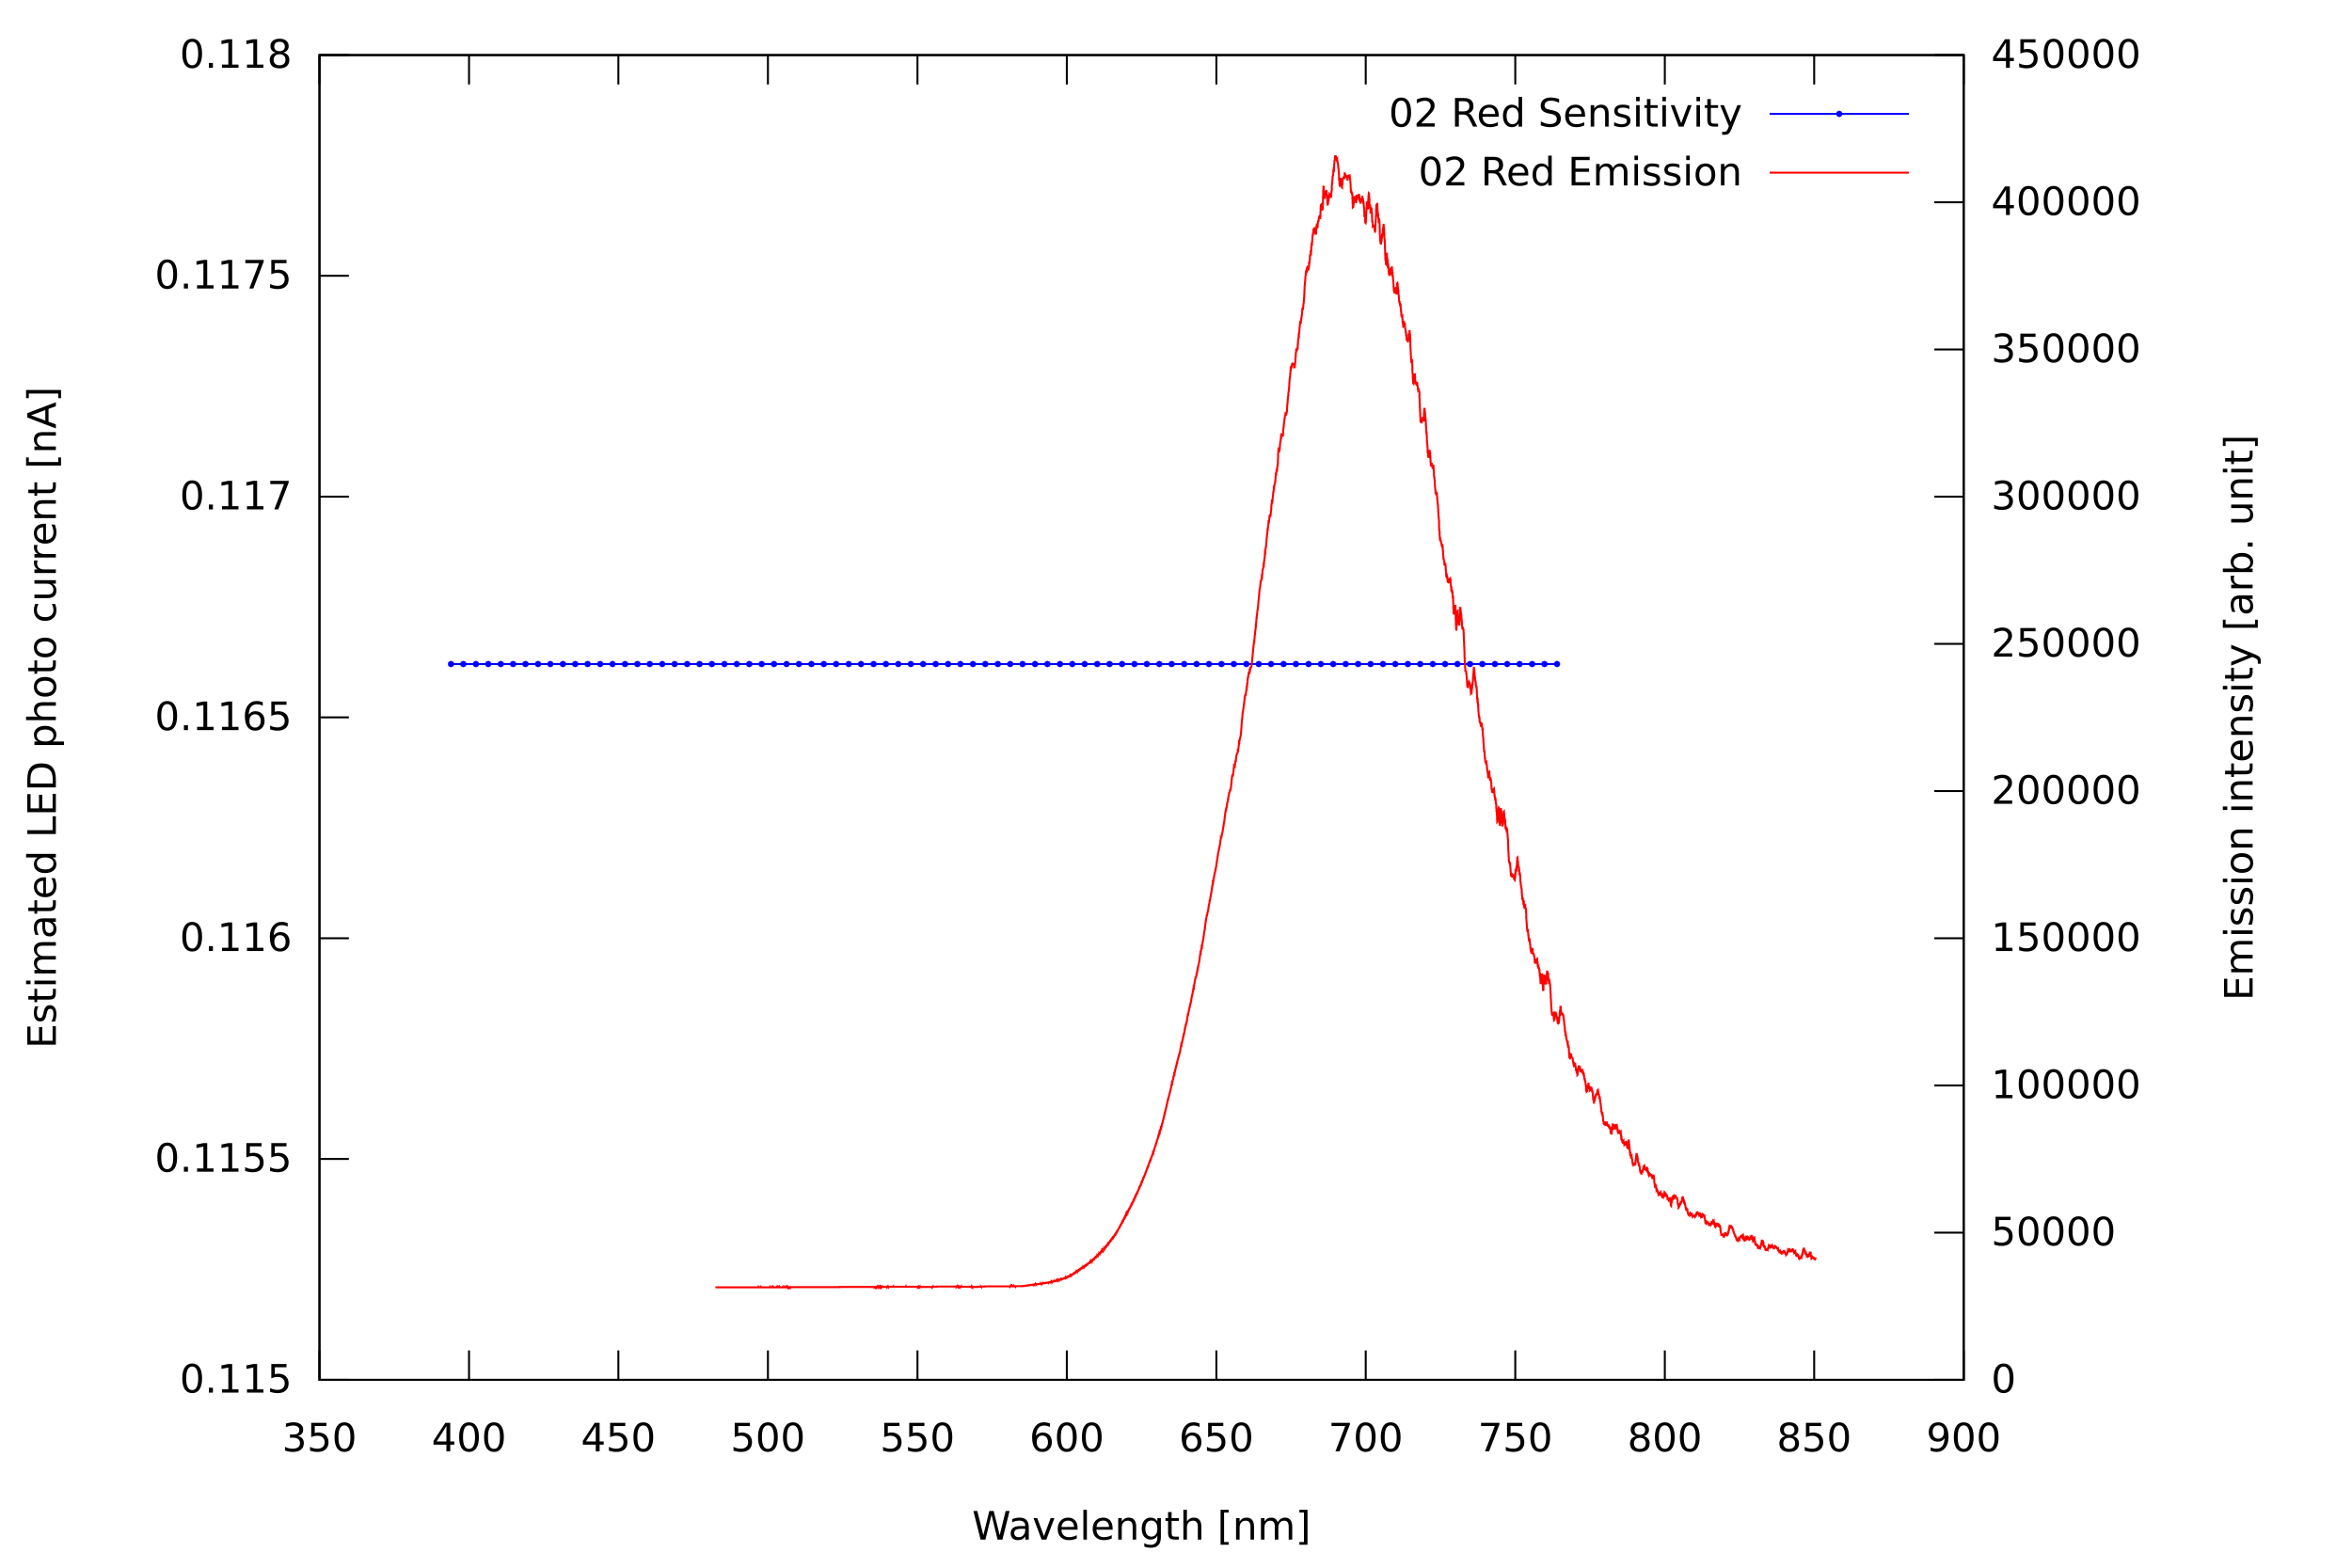
02 Red
03 Yellow
04 Green
05 Blue
06 Blue
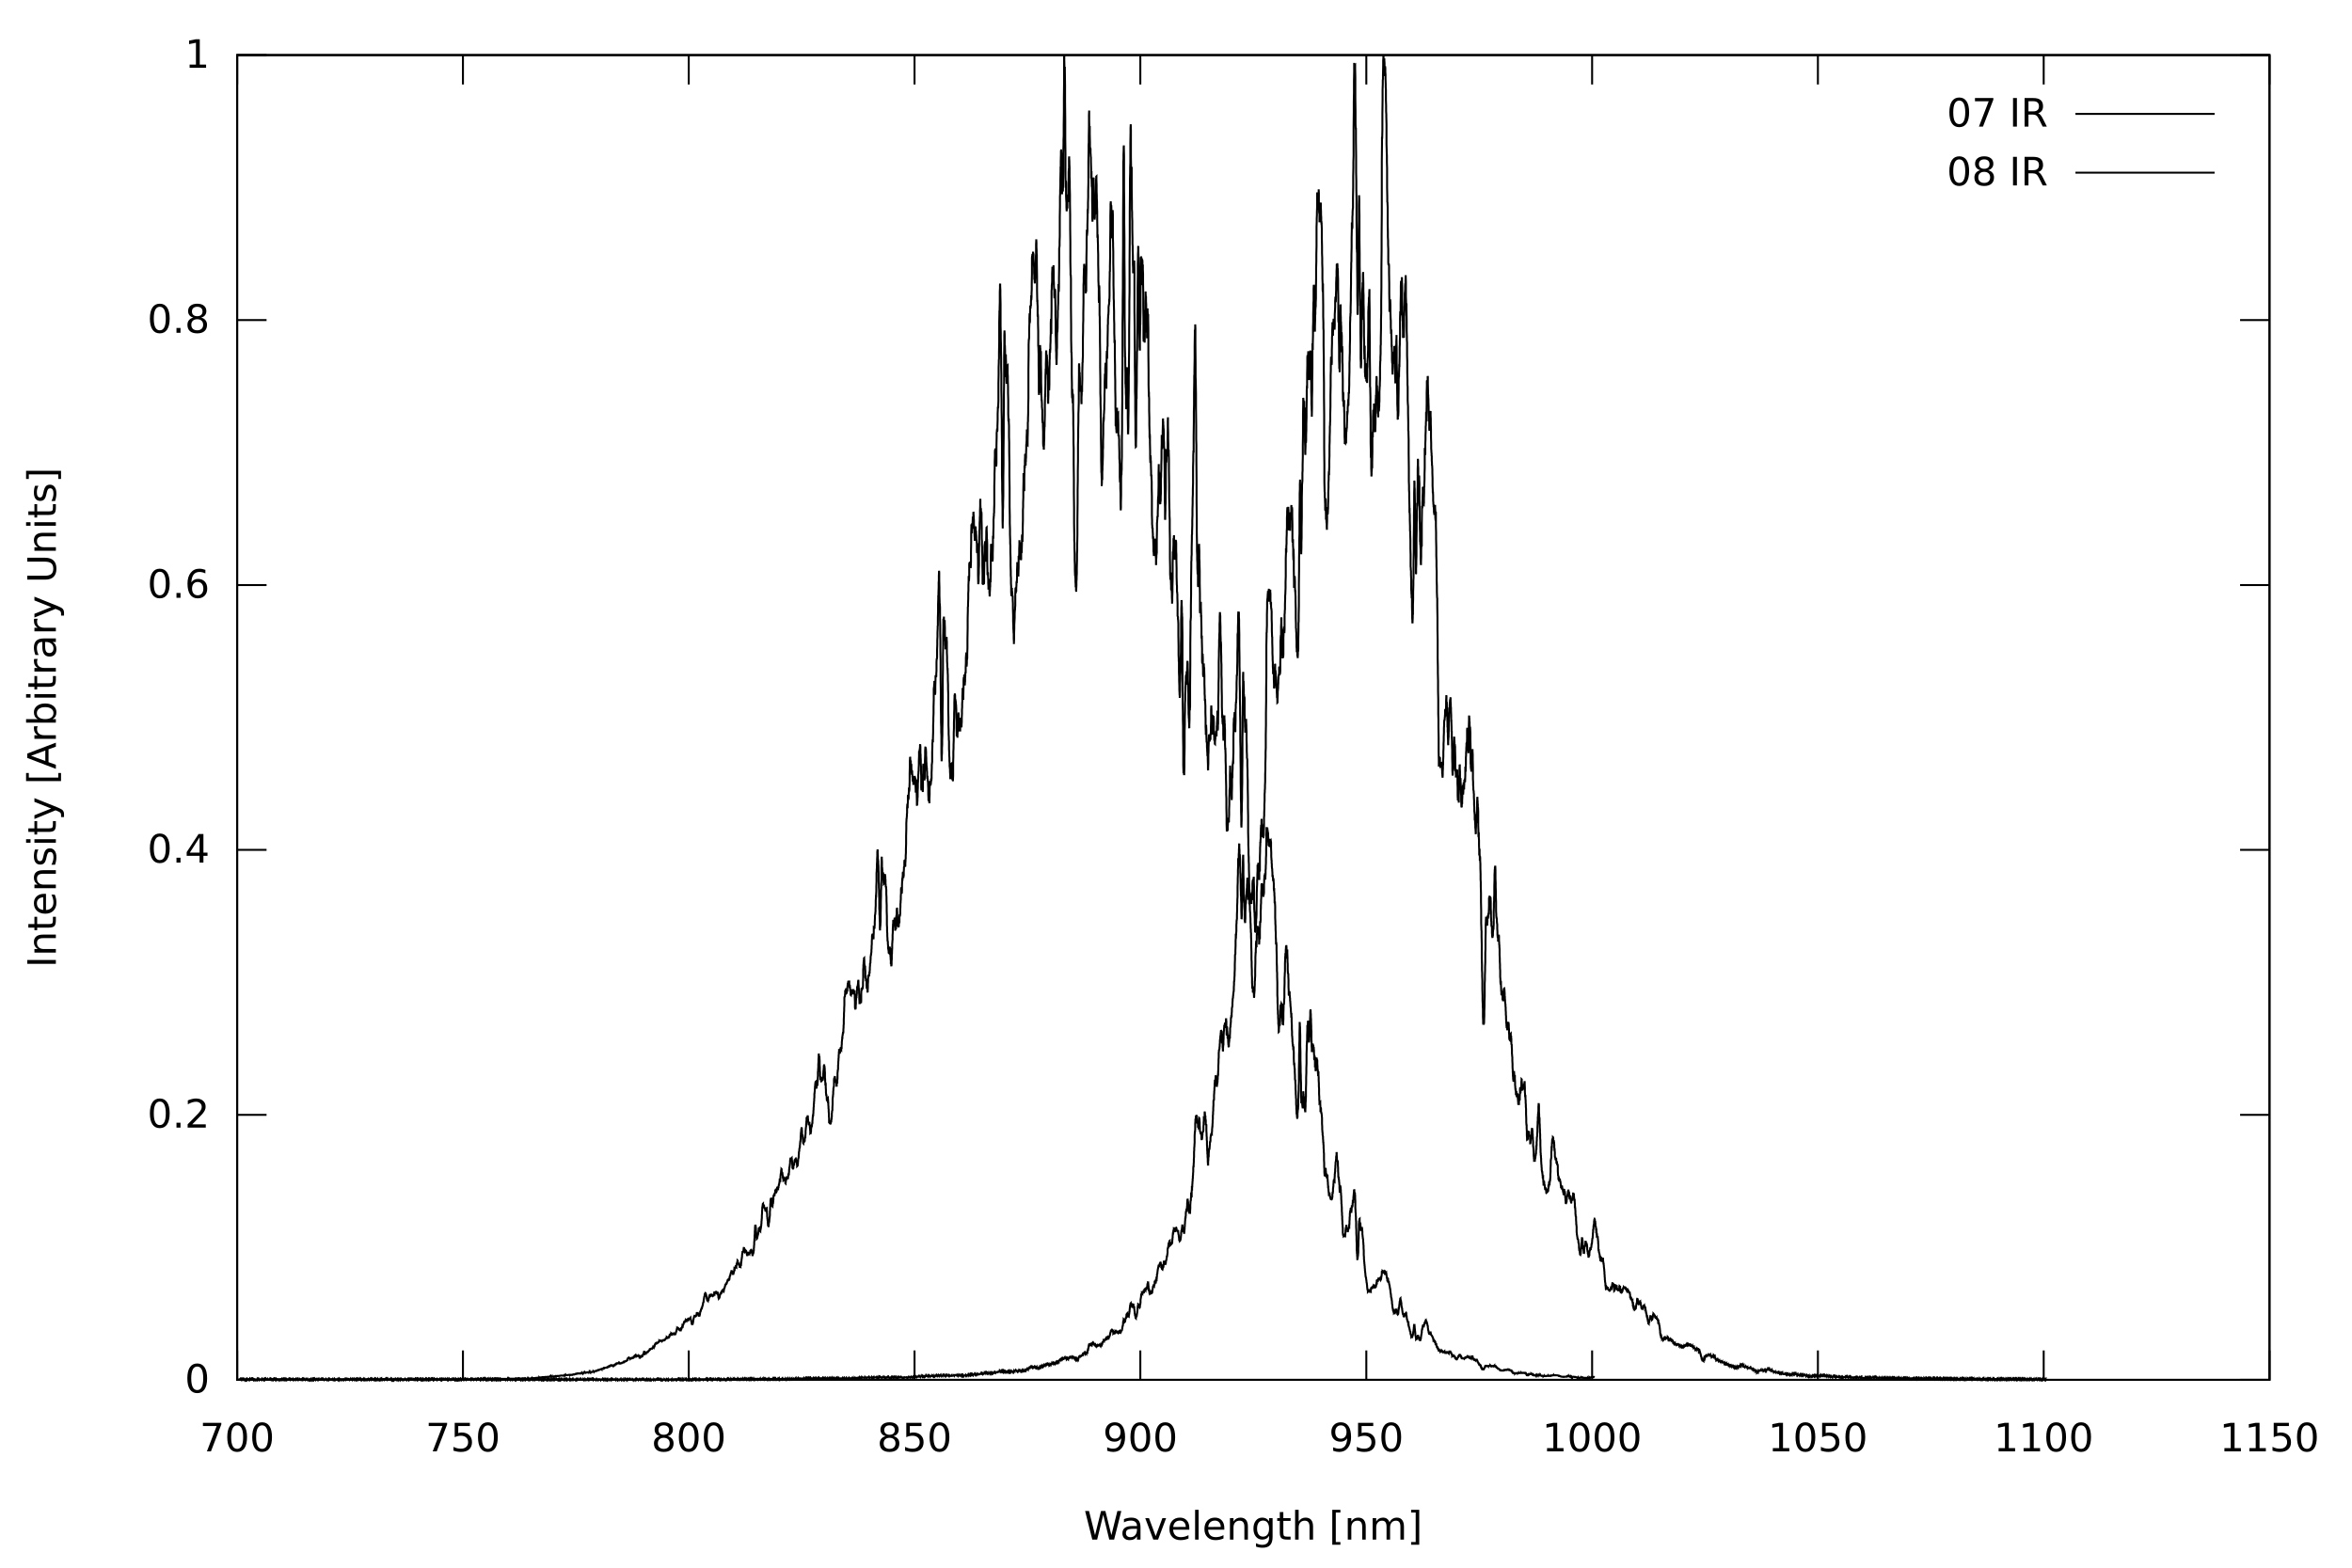
07 IR 880 nm SFH485
08 IR 940 nm
09 Photodiode
10 Photodiode BPW34
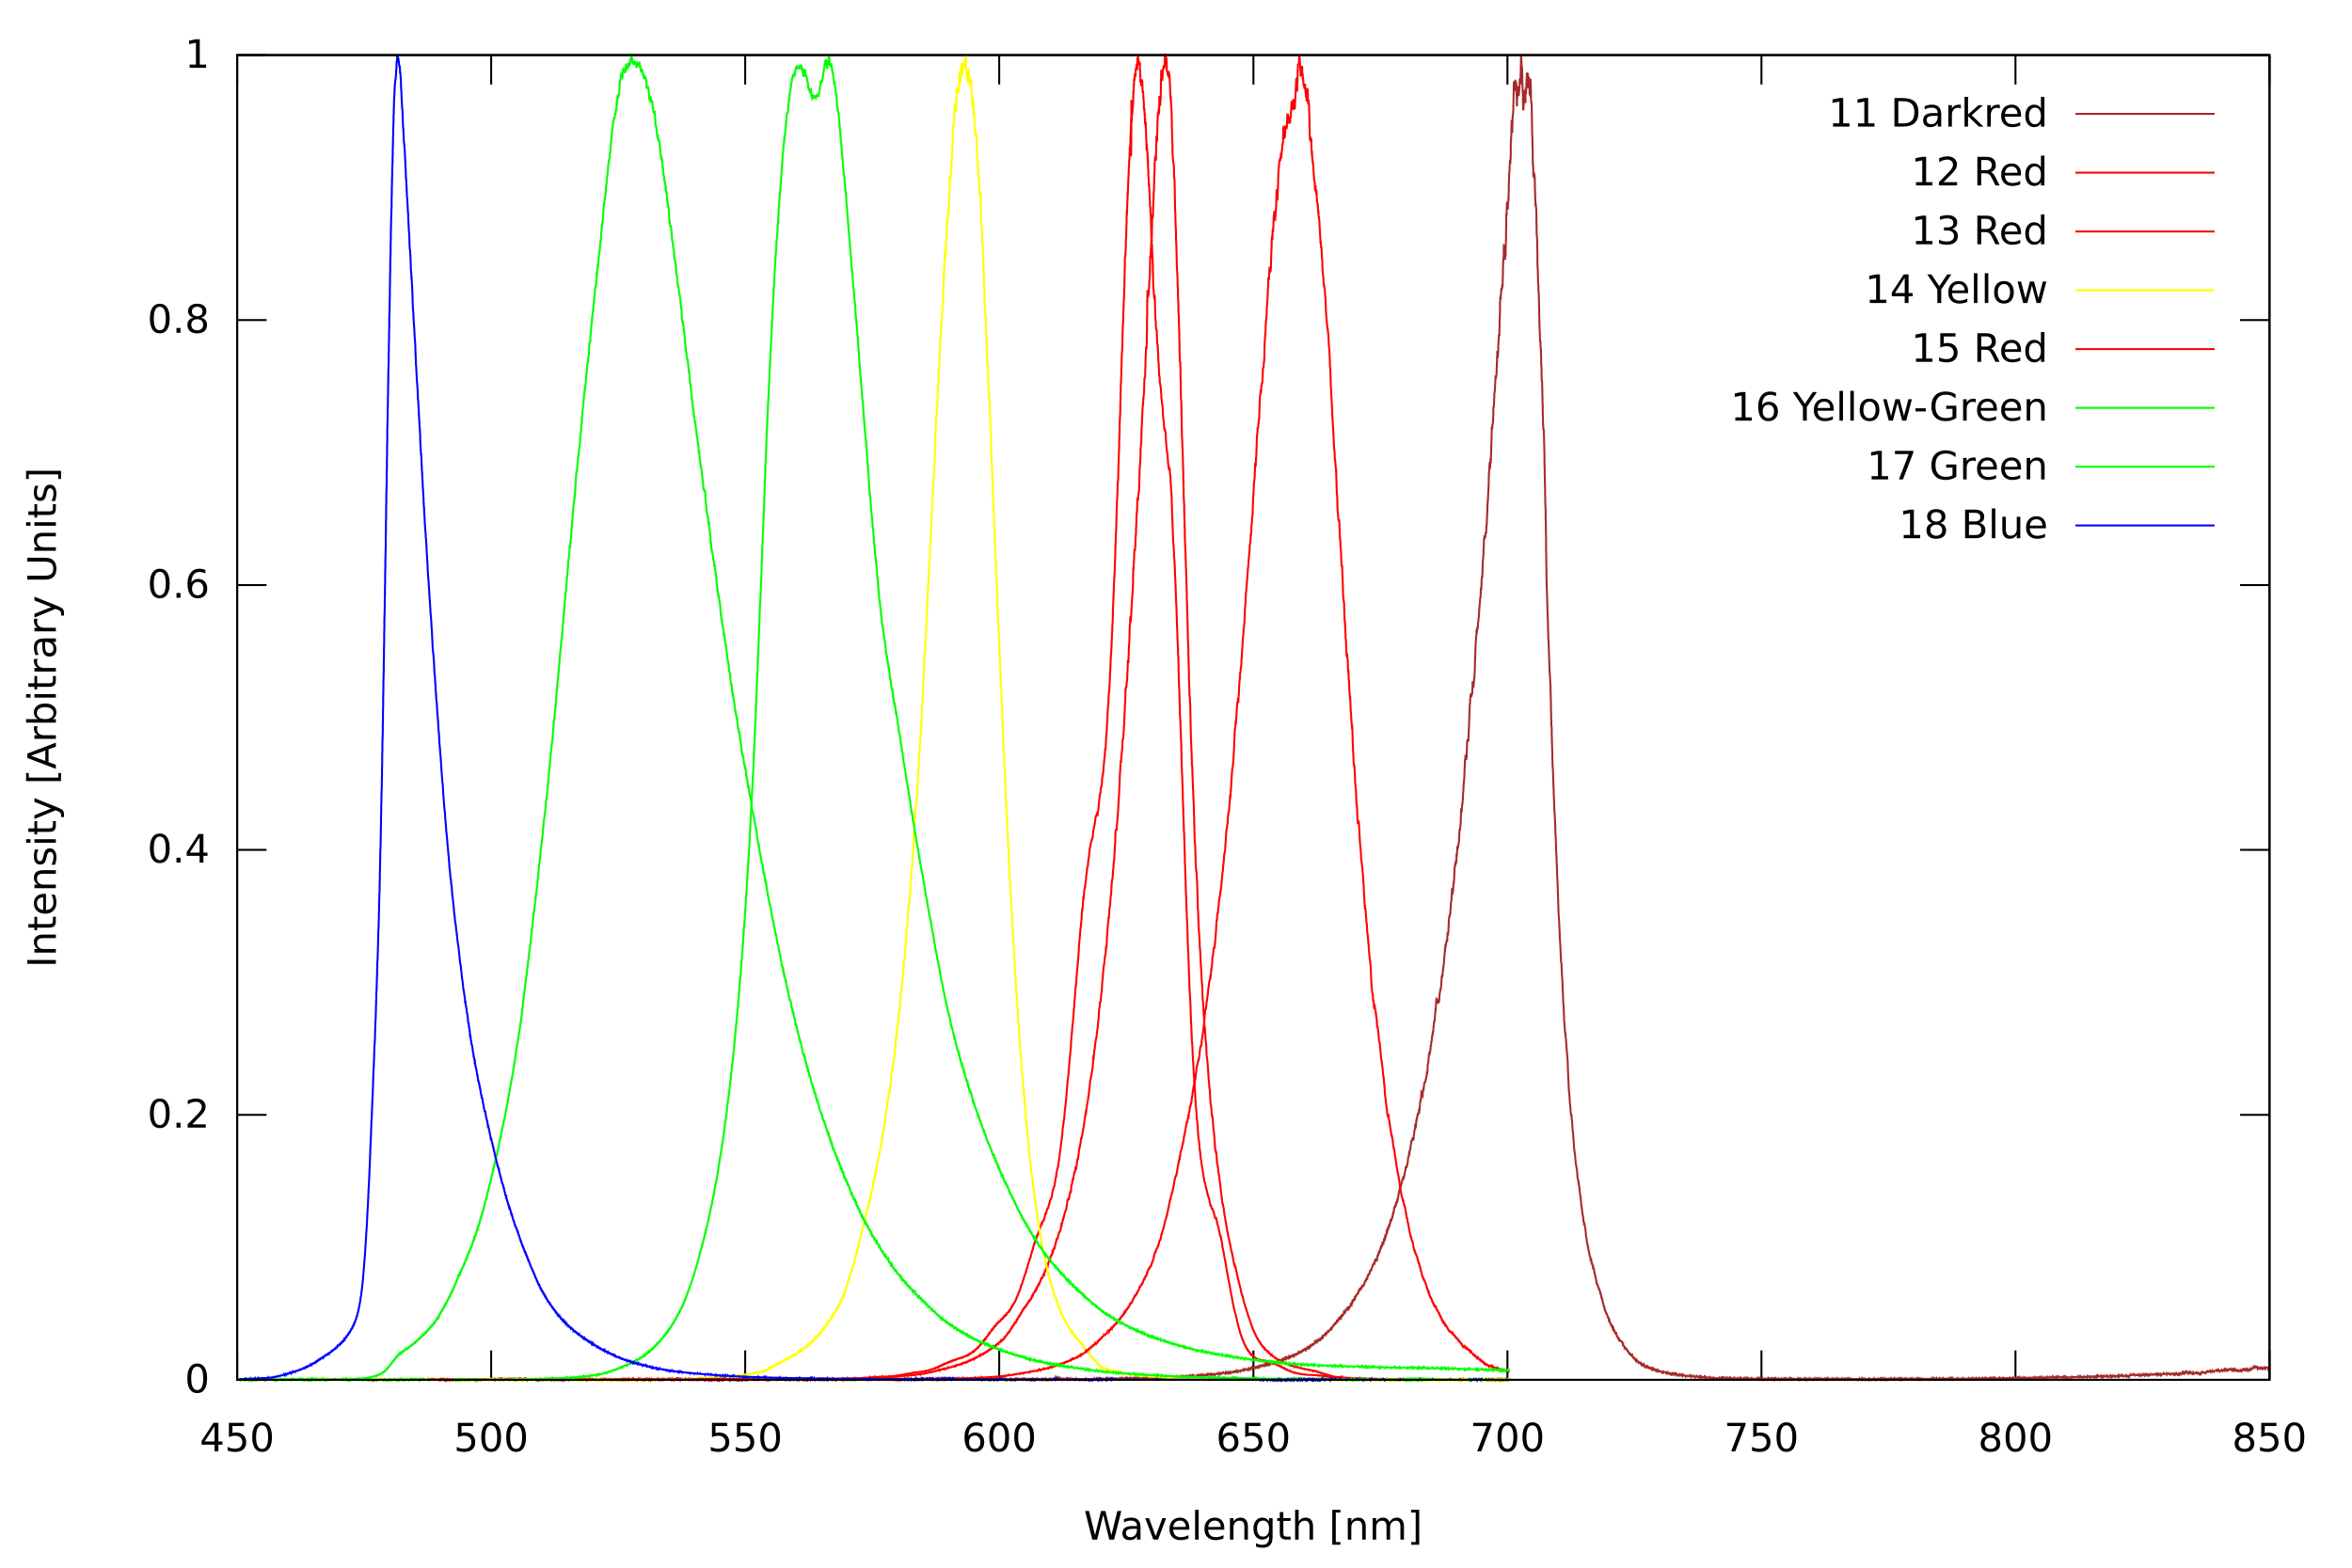
11 Darkred EPD-660-3-0.9
12 Red EPD-630-394
13 Red
14 Yellow
15 Red
16 Yellow-Green
17 Green
18 Blue
Here are their forward voltages, measured with a constant current of 4.2 mA, sorted for ascending voltage:
(10) 0.63 V Infrared Si photodiode BPW34
(09) 0.65 V Infrared Si photodiode
(08) 1.08 V Infrared from an old TV remote control
(07) 1.22 V Infrared SFH485
(11) 1.55 V Barely visible very dark red EPD-660-3-0.9
(15) 1.68 V Red
(01) 1.72 V Red
(12) 1.75 V Red EPD-630-394
(03) 1.85 V Yellow
(13) 1.87 V Red
(02) 1.89 V Red
(14) 1.90 V Yellow
(16) 1.92 V Yellowish-Green
(04) 1.92 V Green
(18) 2.68 V Blue
(17) 2.70 V Green
(05) 2.76 V Blue
(06) 3.17 V Blue
Error of forward voltage measurement should be in the +- 0.03V range.
My assumption was that the LEDs with direct bandgap semiconductor material would be roughly visible for their own emitted wavelength, and the indirect bandgap ones would be sensitive to wavelengths slightly shorter than their own emission.
With a nice spectrometer available in laser spectroscopy lab at university, I measured the emission spectra:
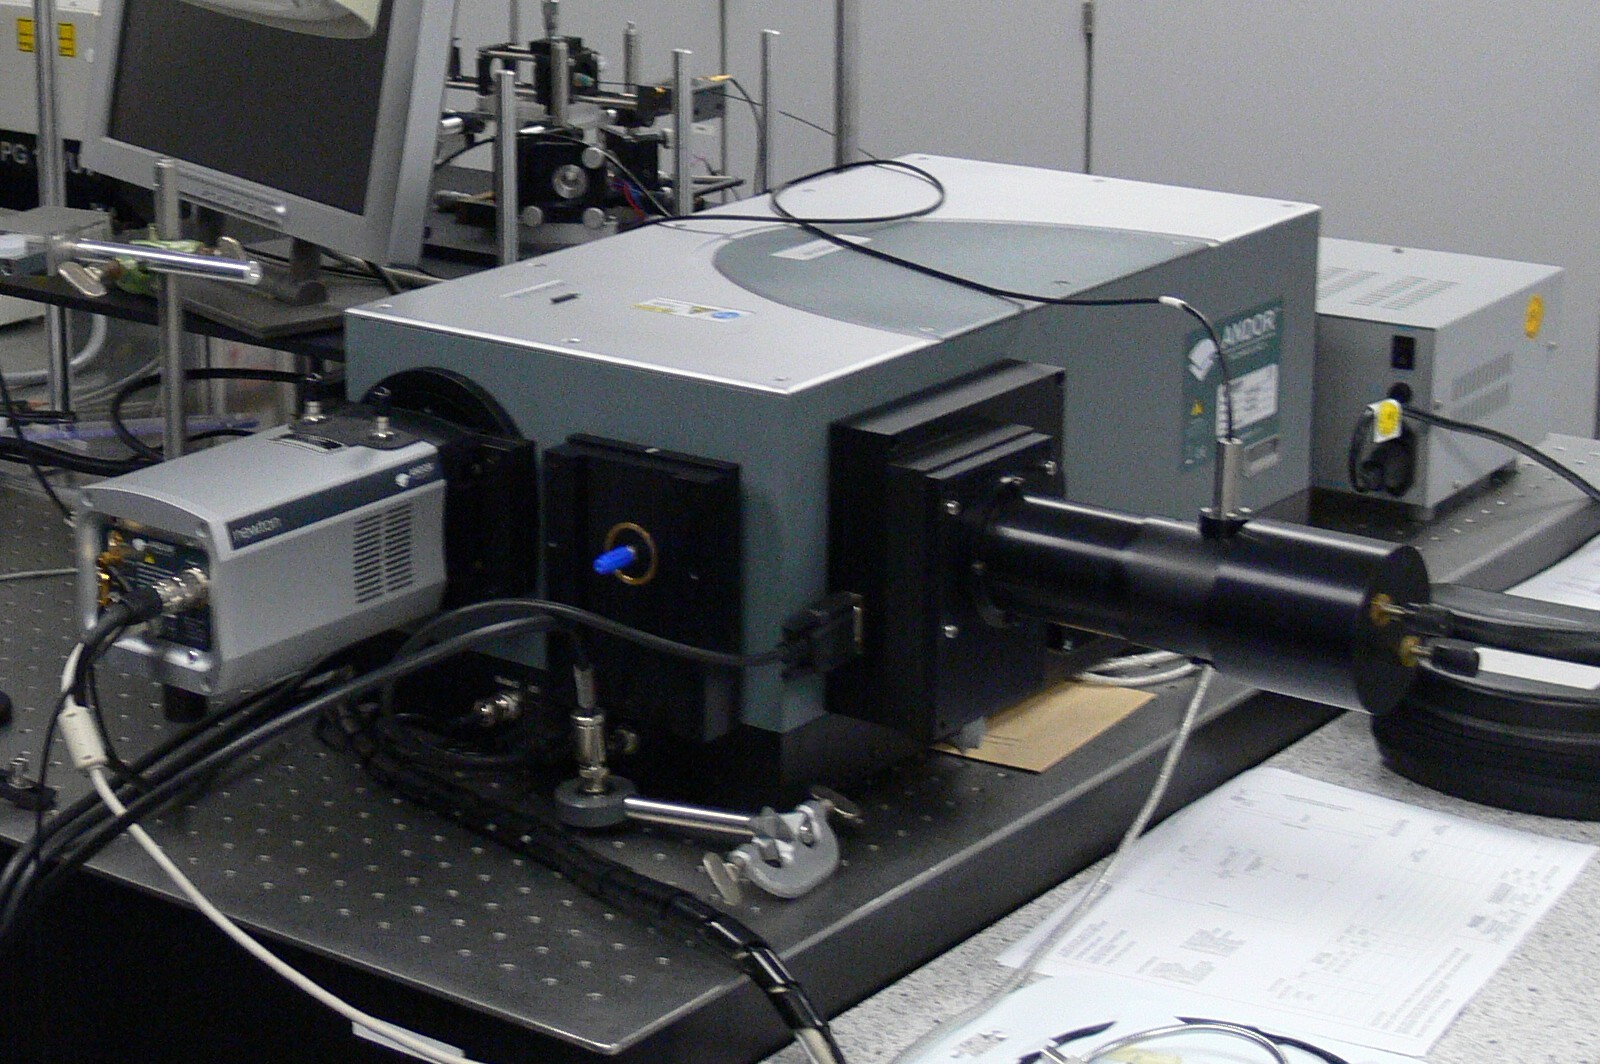
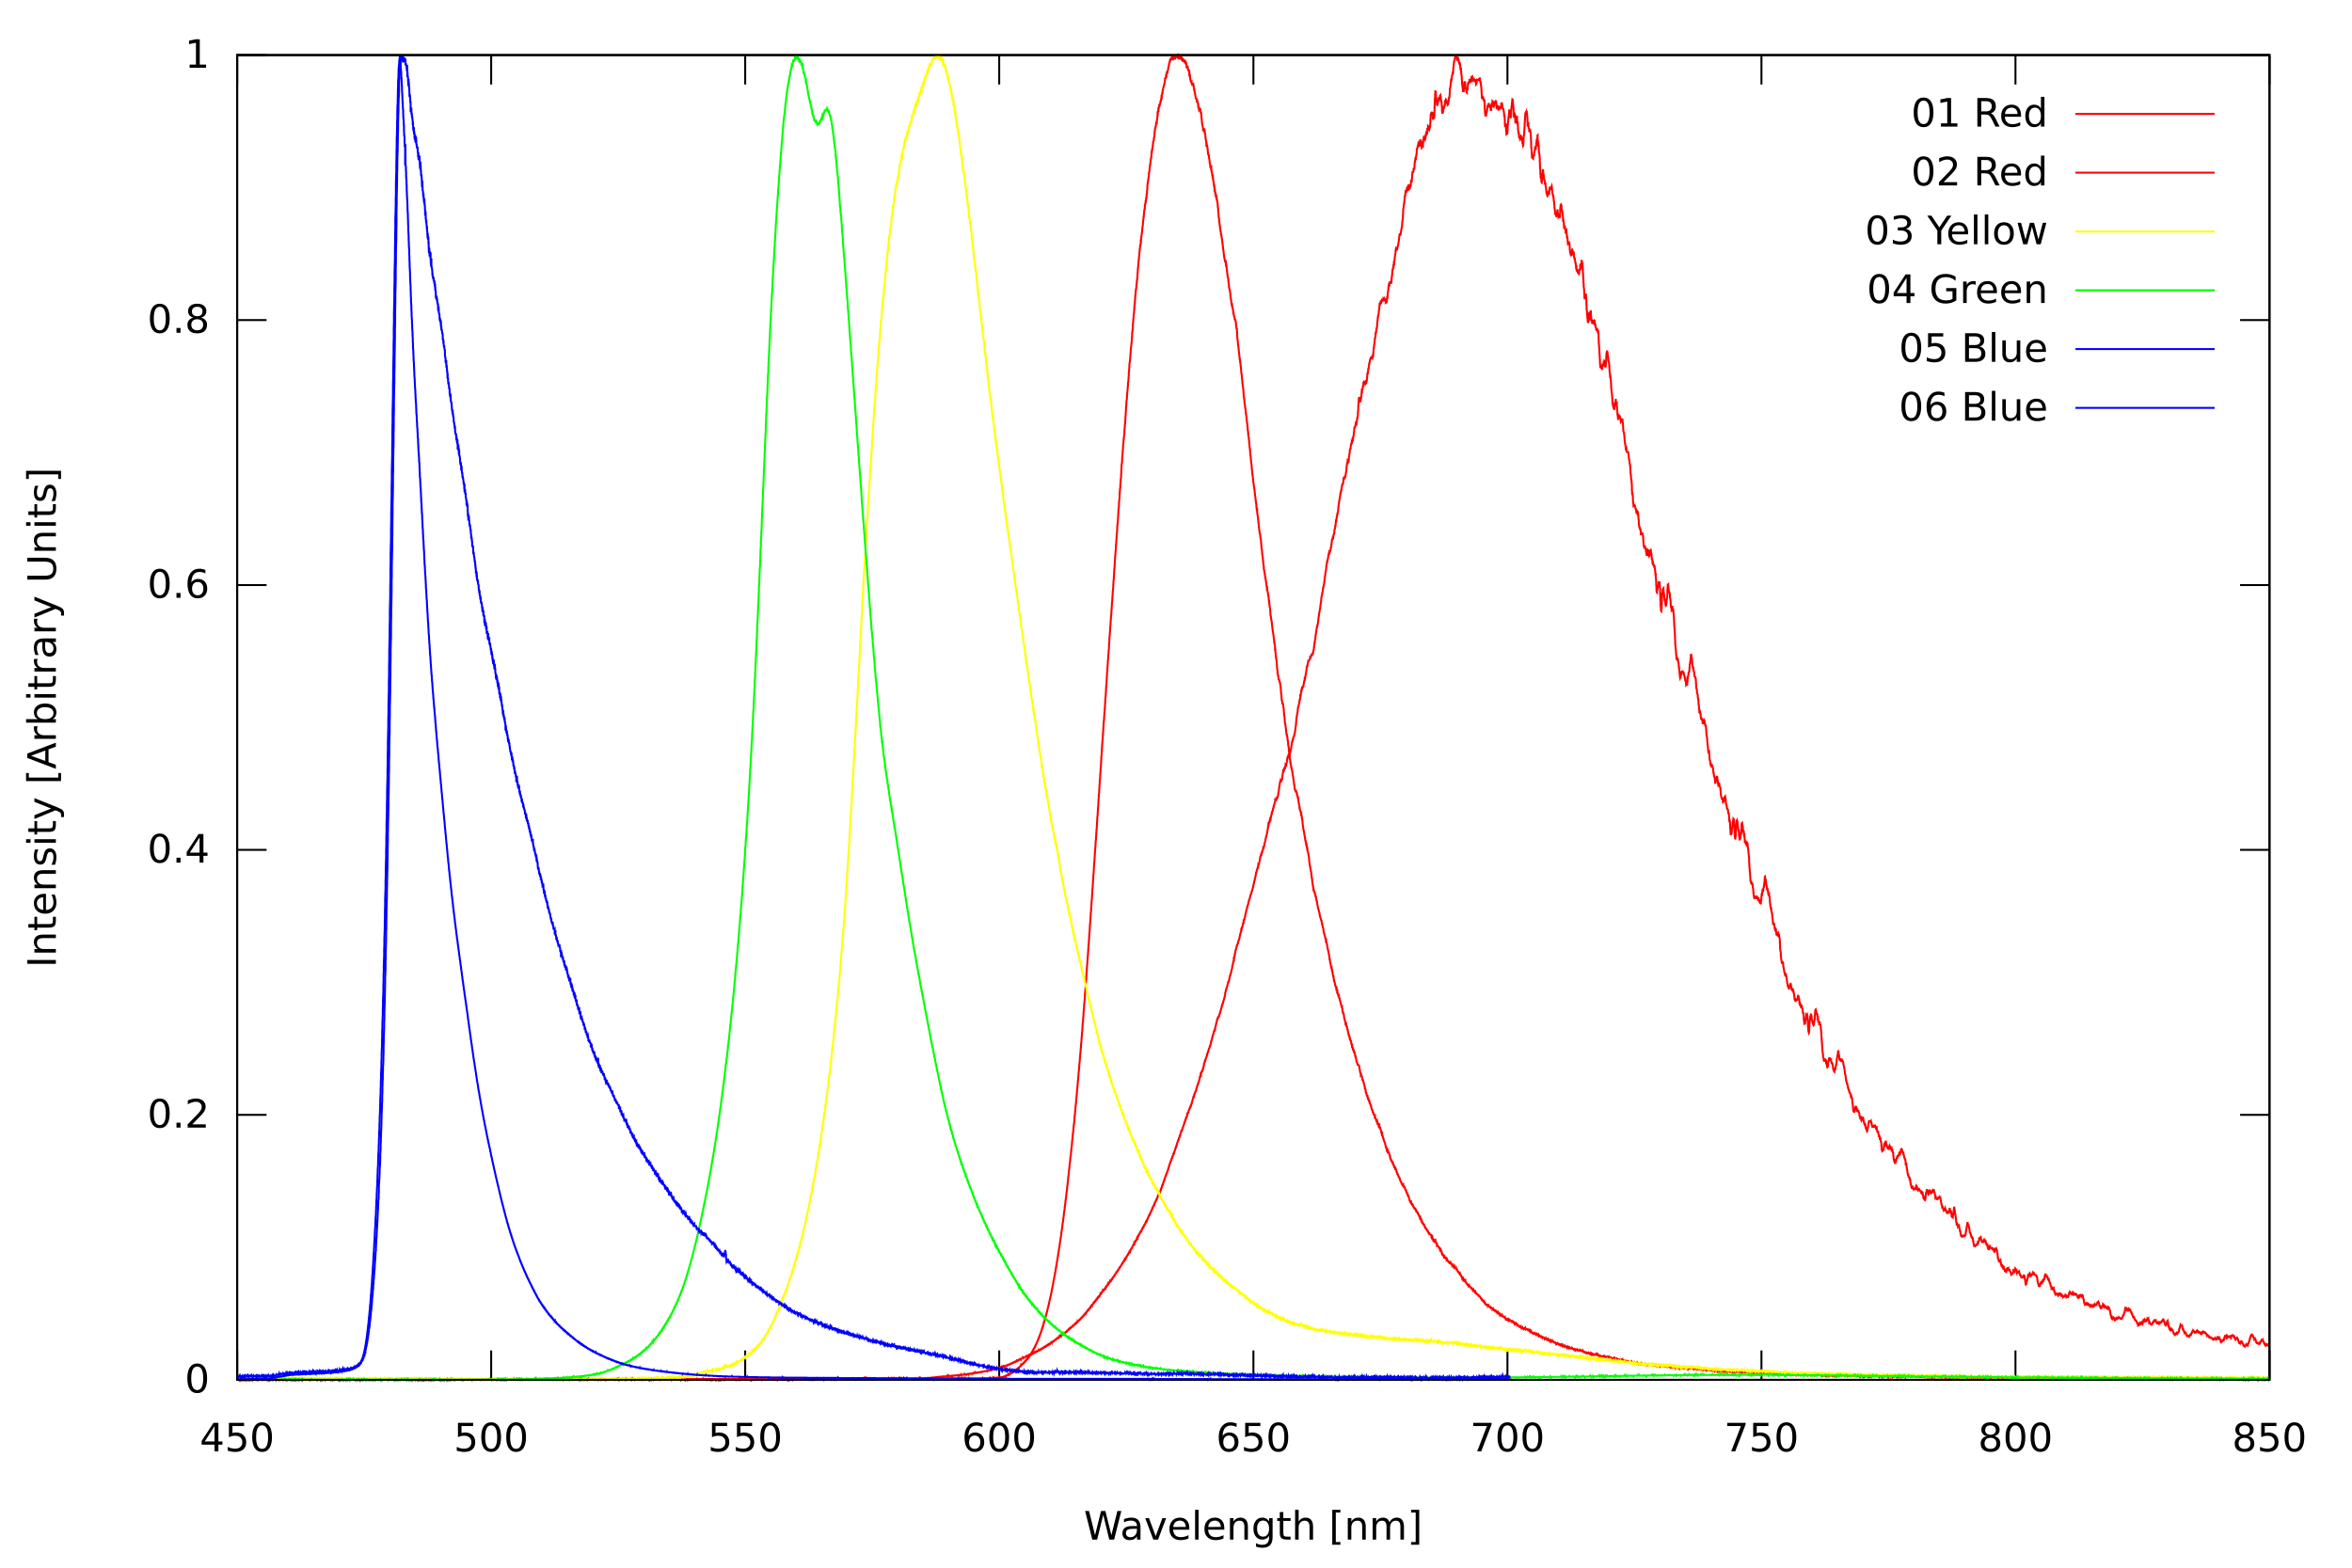
Note that the spectrometer is configured for Raman spectroscopy with a 473 nm laser, therefore, it is equipped with a lowpass interference filter, which cuts off wavelengths shorter than about 482 nm. The blue LEDs spectra are clipped for this reason.
For a first small test to confirm the wavelengths the LEDs might be sensitive to, I took my decorative LED lamp I build many years ago which contains red, yellow, green, blue and ultraviolet LEDs. With this, I illuminated all the sensor channels and took notes which is sensitive to which colour.
I was very surprised, but observations first:
Red illumination:    Reaction on channels 1           | 7 8 | 9 10 | 11 12 13 14 15 |       18.
Yellow illumination: Reaction on channels     3 4     | 7 8 | 9 10 | 11 12 13 14 15 | 16    18.
Green illumination:  Reaction on channels     3 4     | 7 8 | 9 10 | 11 12 13 14 15 | 16 17 18.
Blue illumination:   Reaction on channels     3 4 5   | 7 8 | 9 10 | 11 12 13 14 15 | 16 17 18.
UV illumination:     Reaction on channels   2 3 4 5 6 | 7 8 | 9 10 | 11 12 13 14 15 | 16 17 18.
Note that the diffuse LEDs 1, 2, 5, and 6 had a much lower sensitivity than the other ones. I took a quite long discharge time in order to see if there is any sensitivity.
Surprises:
* The tint of "01 Red" must act as a narrow filter, so 01 is sensitive to the red illumination only.
* "02 Red" is sensitive to ultraviolet only despite being a red LED.
* "18 Blue" is slightly sensitive to everything, despite being a blue LED.
Clearly, my former rule of thumb that a LED is sensitive for its own wavelength or slightly shorter (more blueish) does not hold in all cases. Therefore, I cannot easily determine the LED sensitivity by measuring its emission spectrum. I need a tunable monochromatic source of light for measuring the actual sensitivity spectrum of the LEDs. Unfortunately, I could not take apart the expensive spectrometer in university lab..
Finally, I found a surplus grating monochromator with manual mechanics giving a linear wavelength scale, which I added a stepper motor drive to:
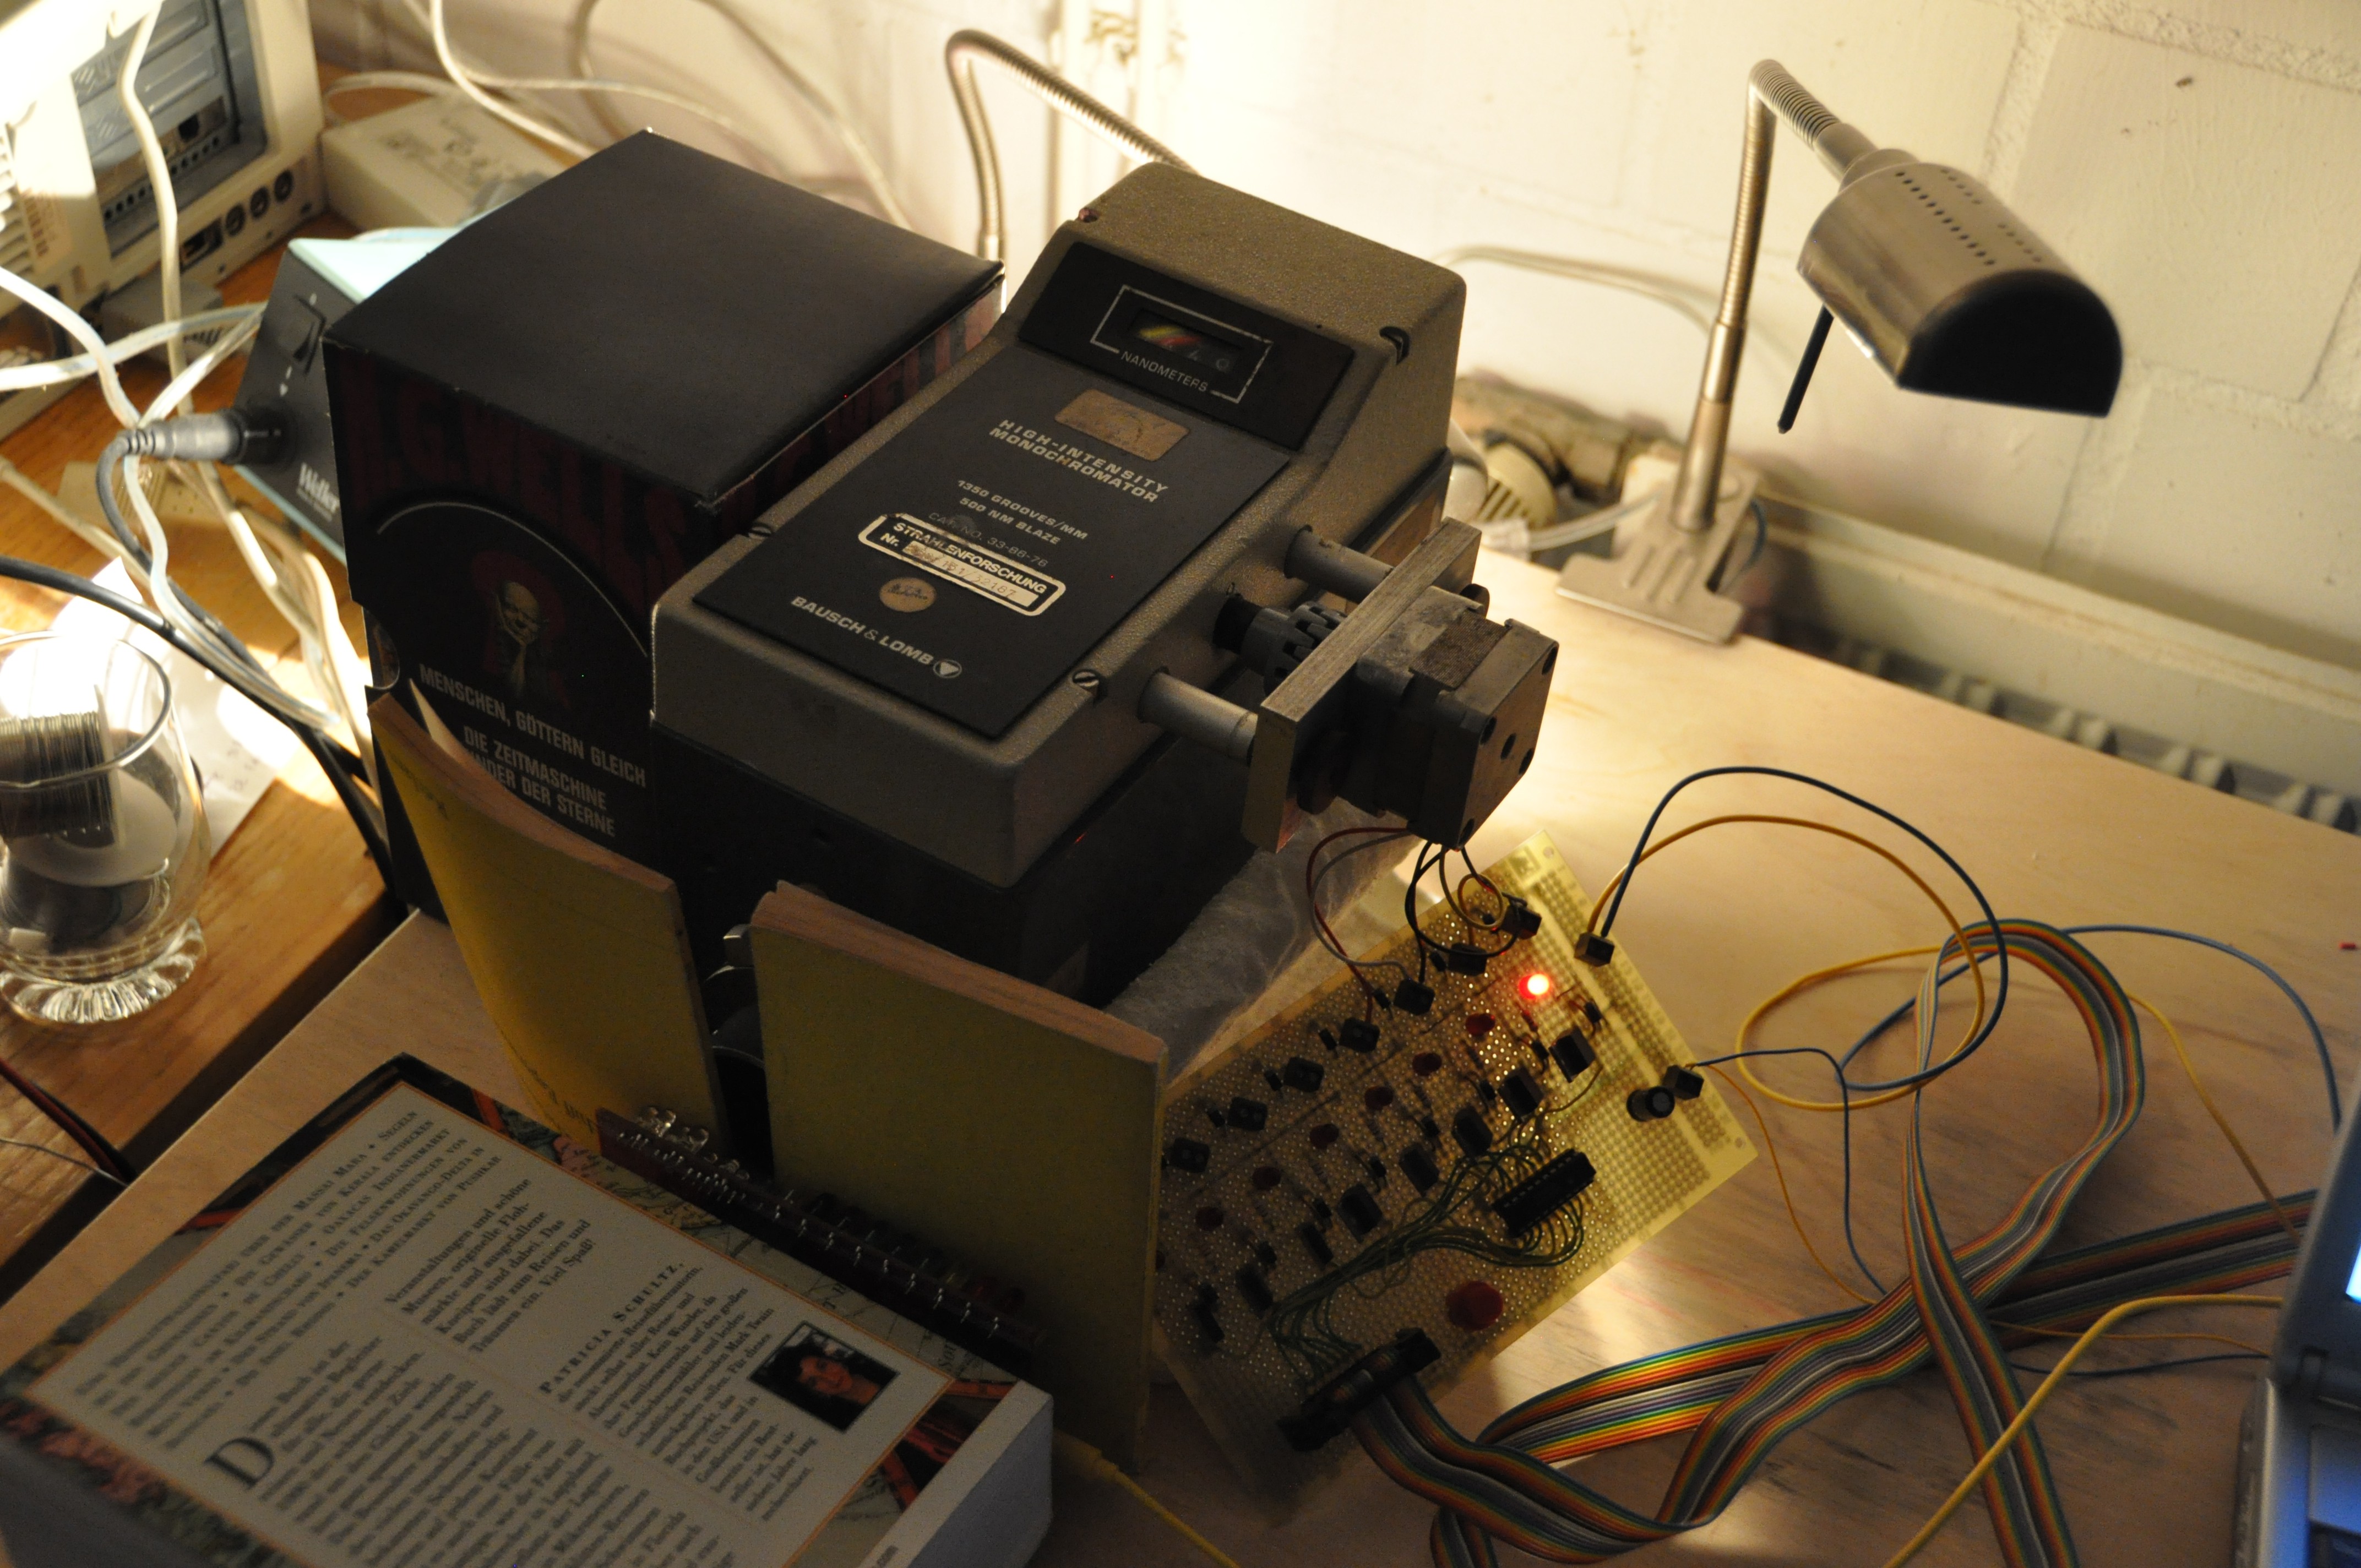
With this, and a halogen lamp at the input, I get tunable monochromatic output:
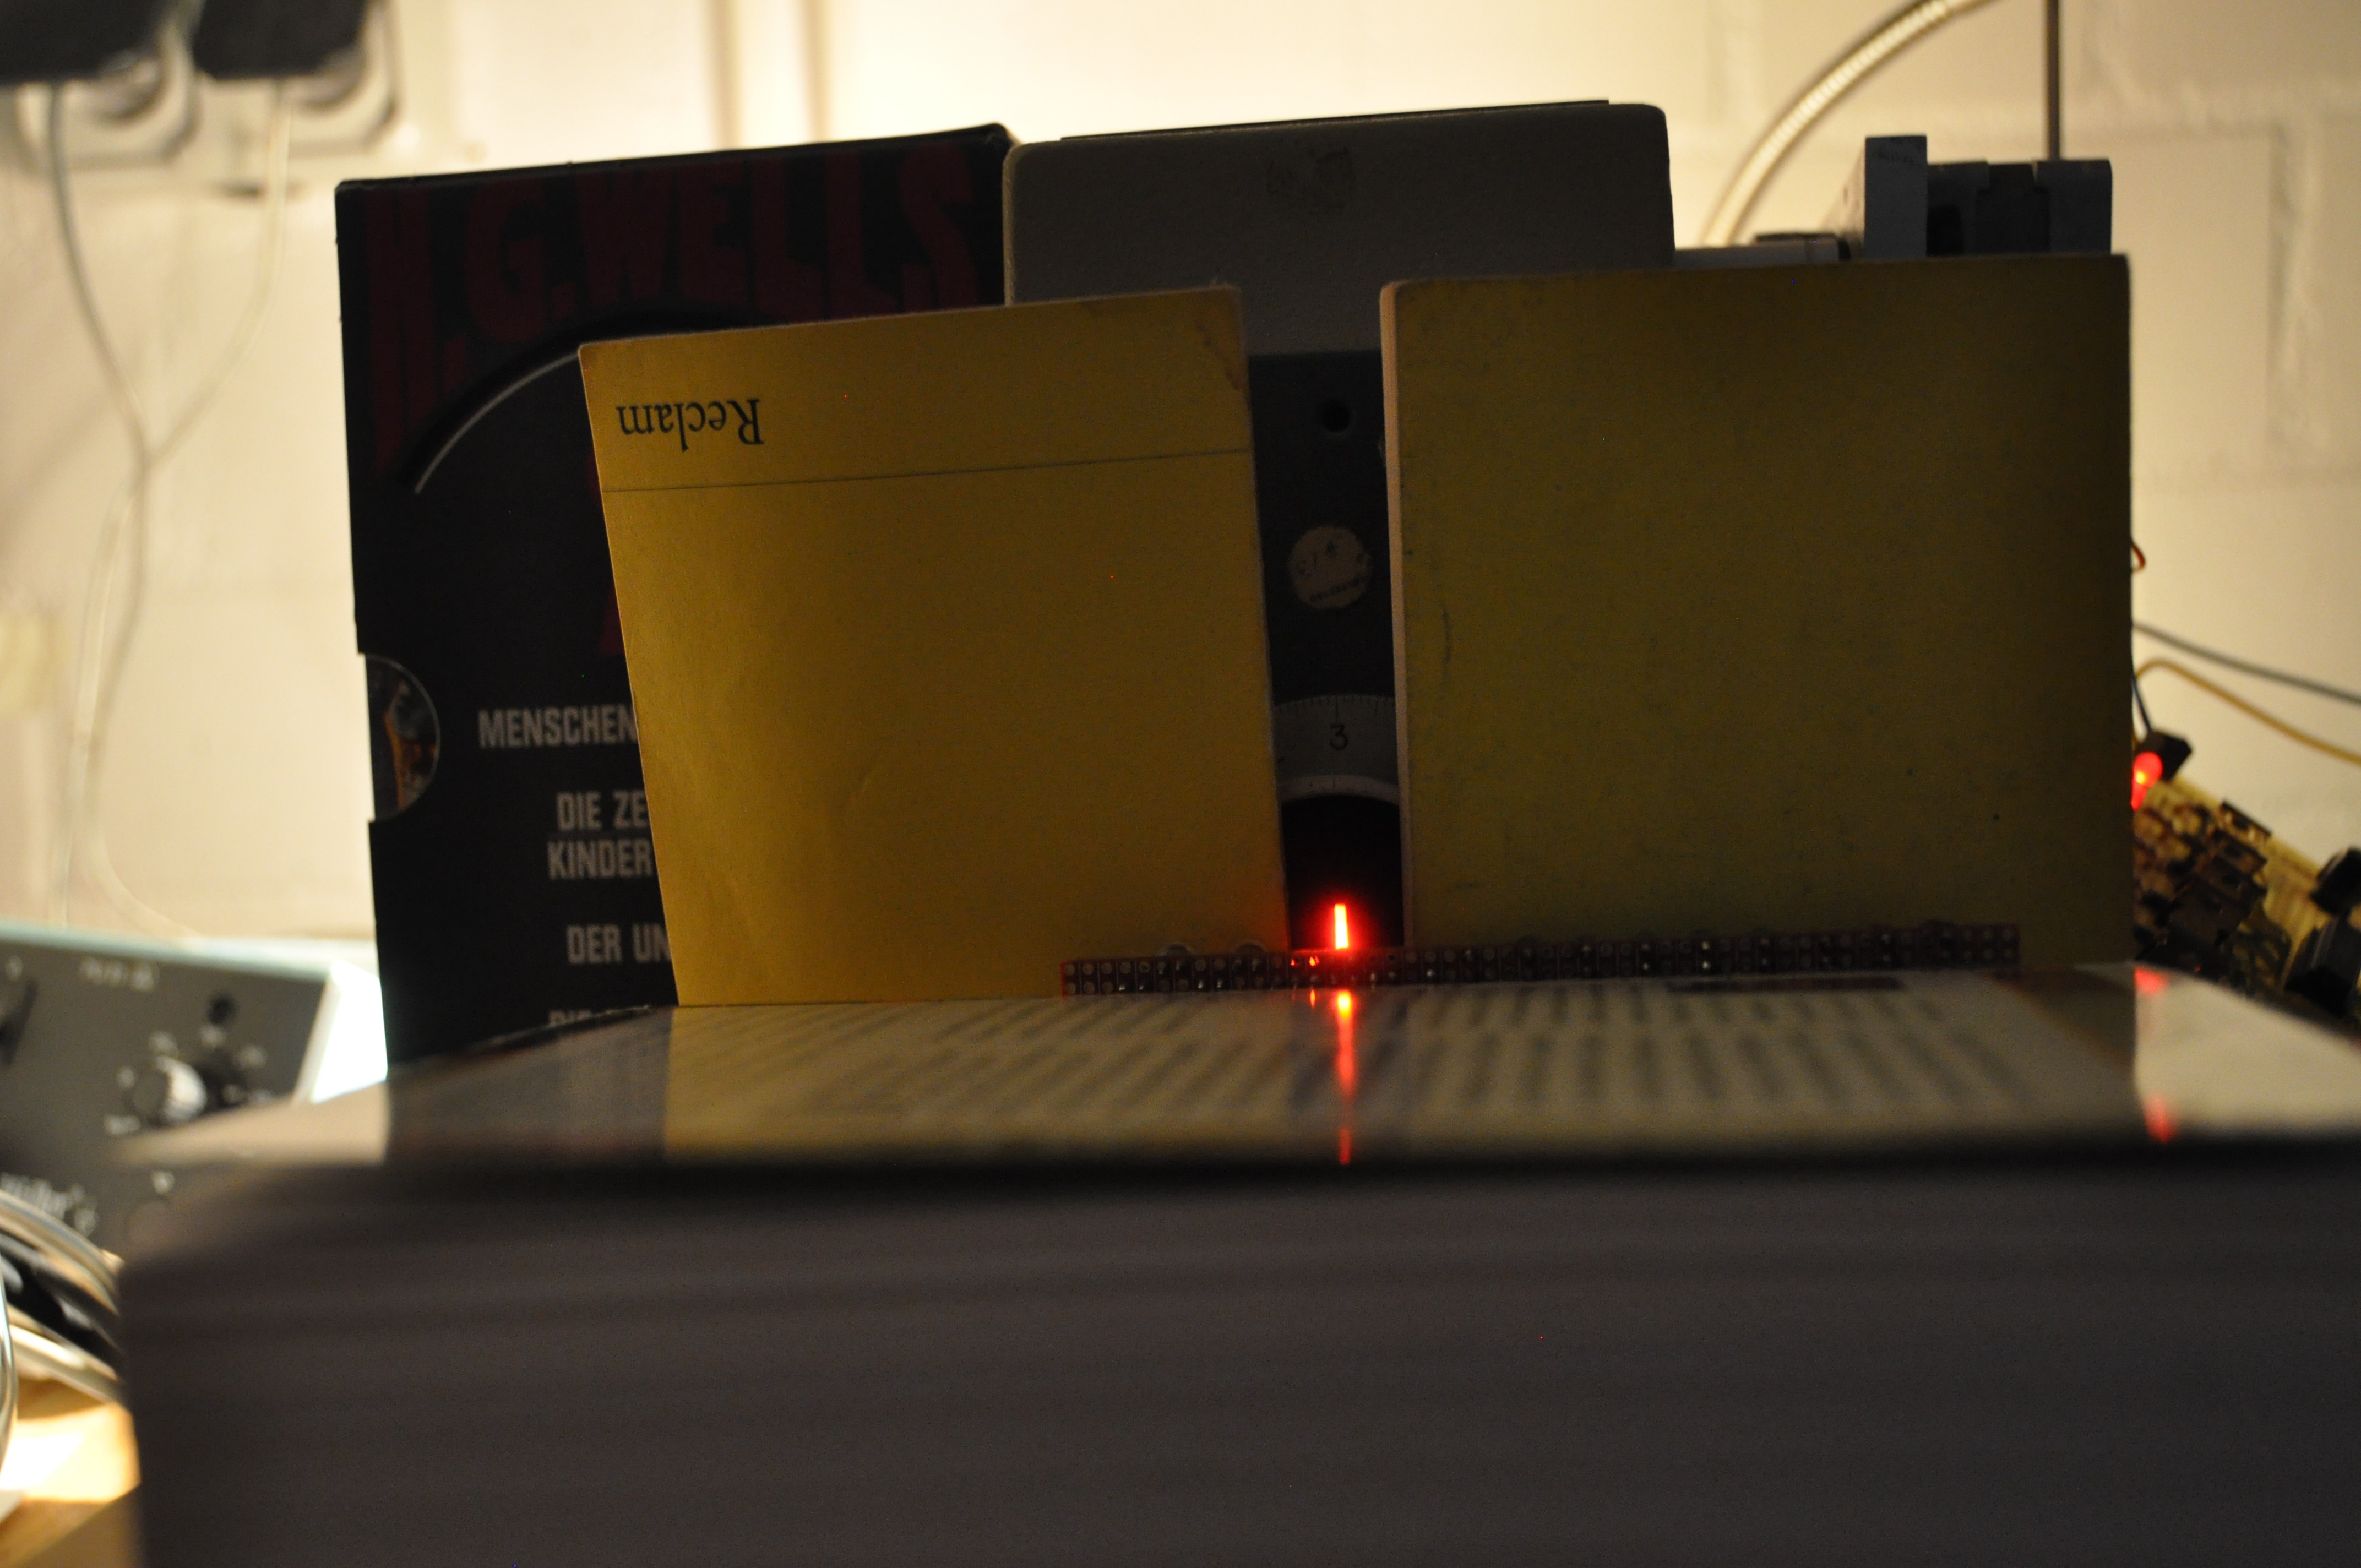
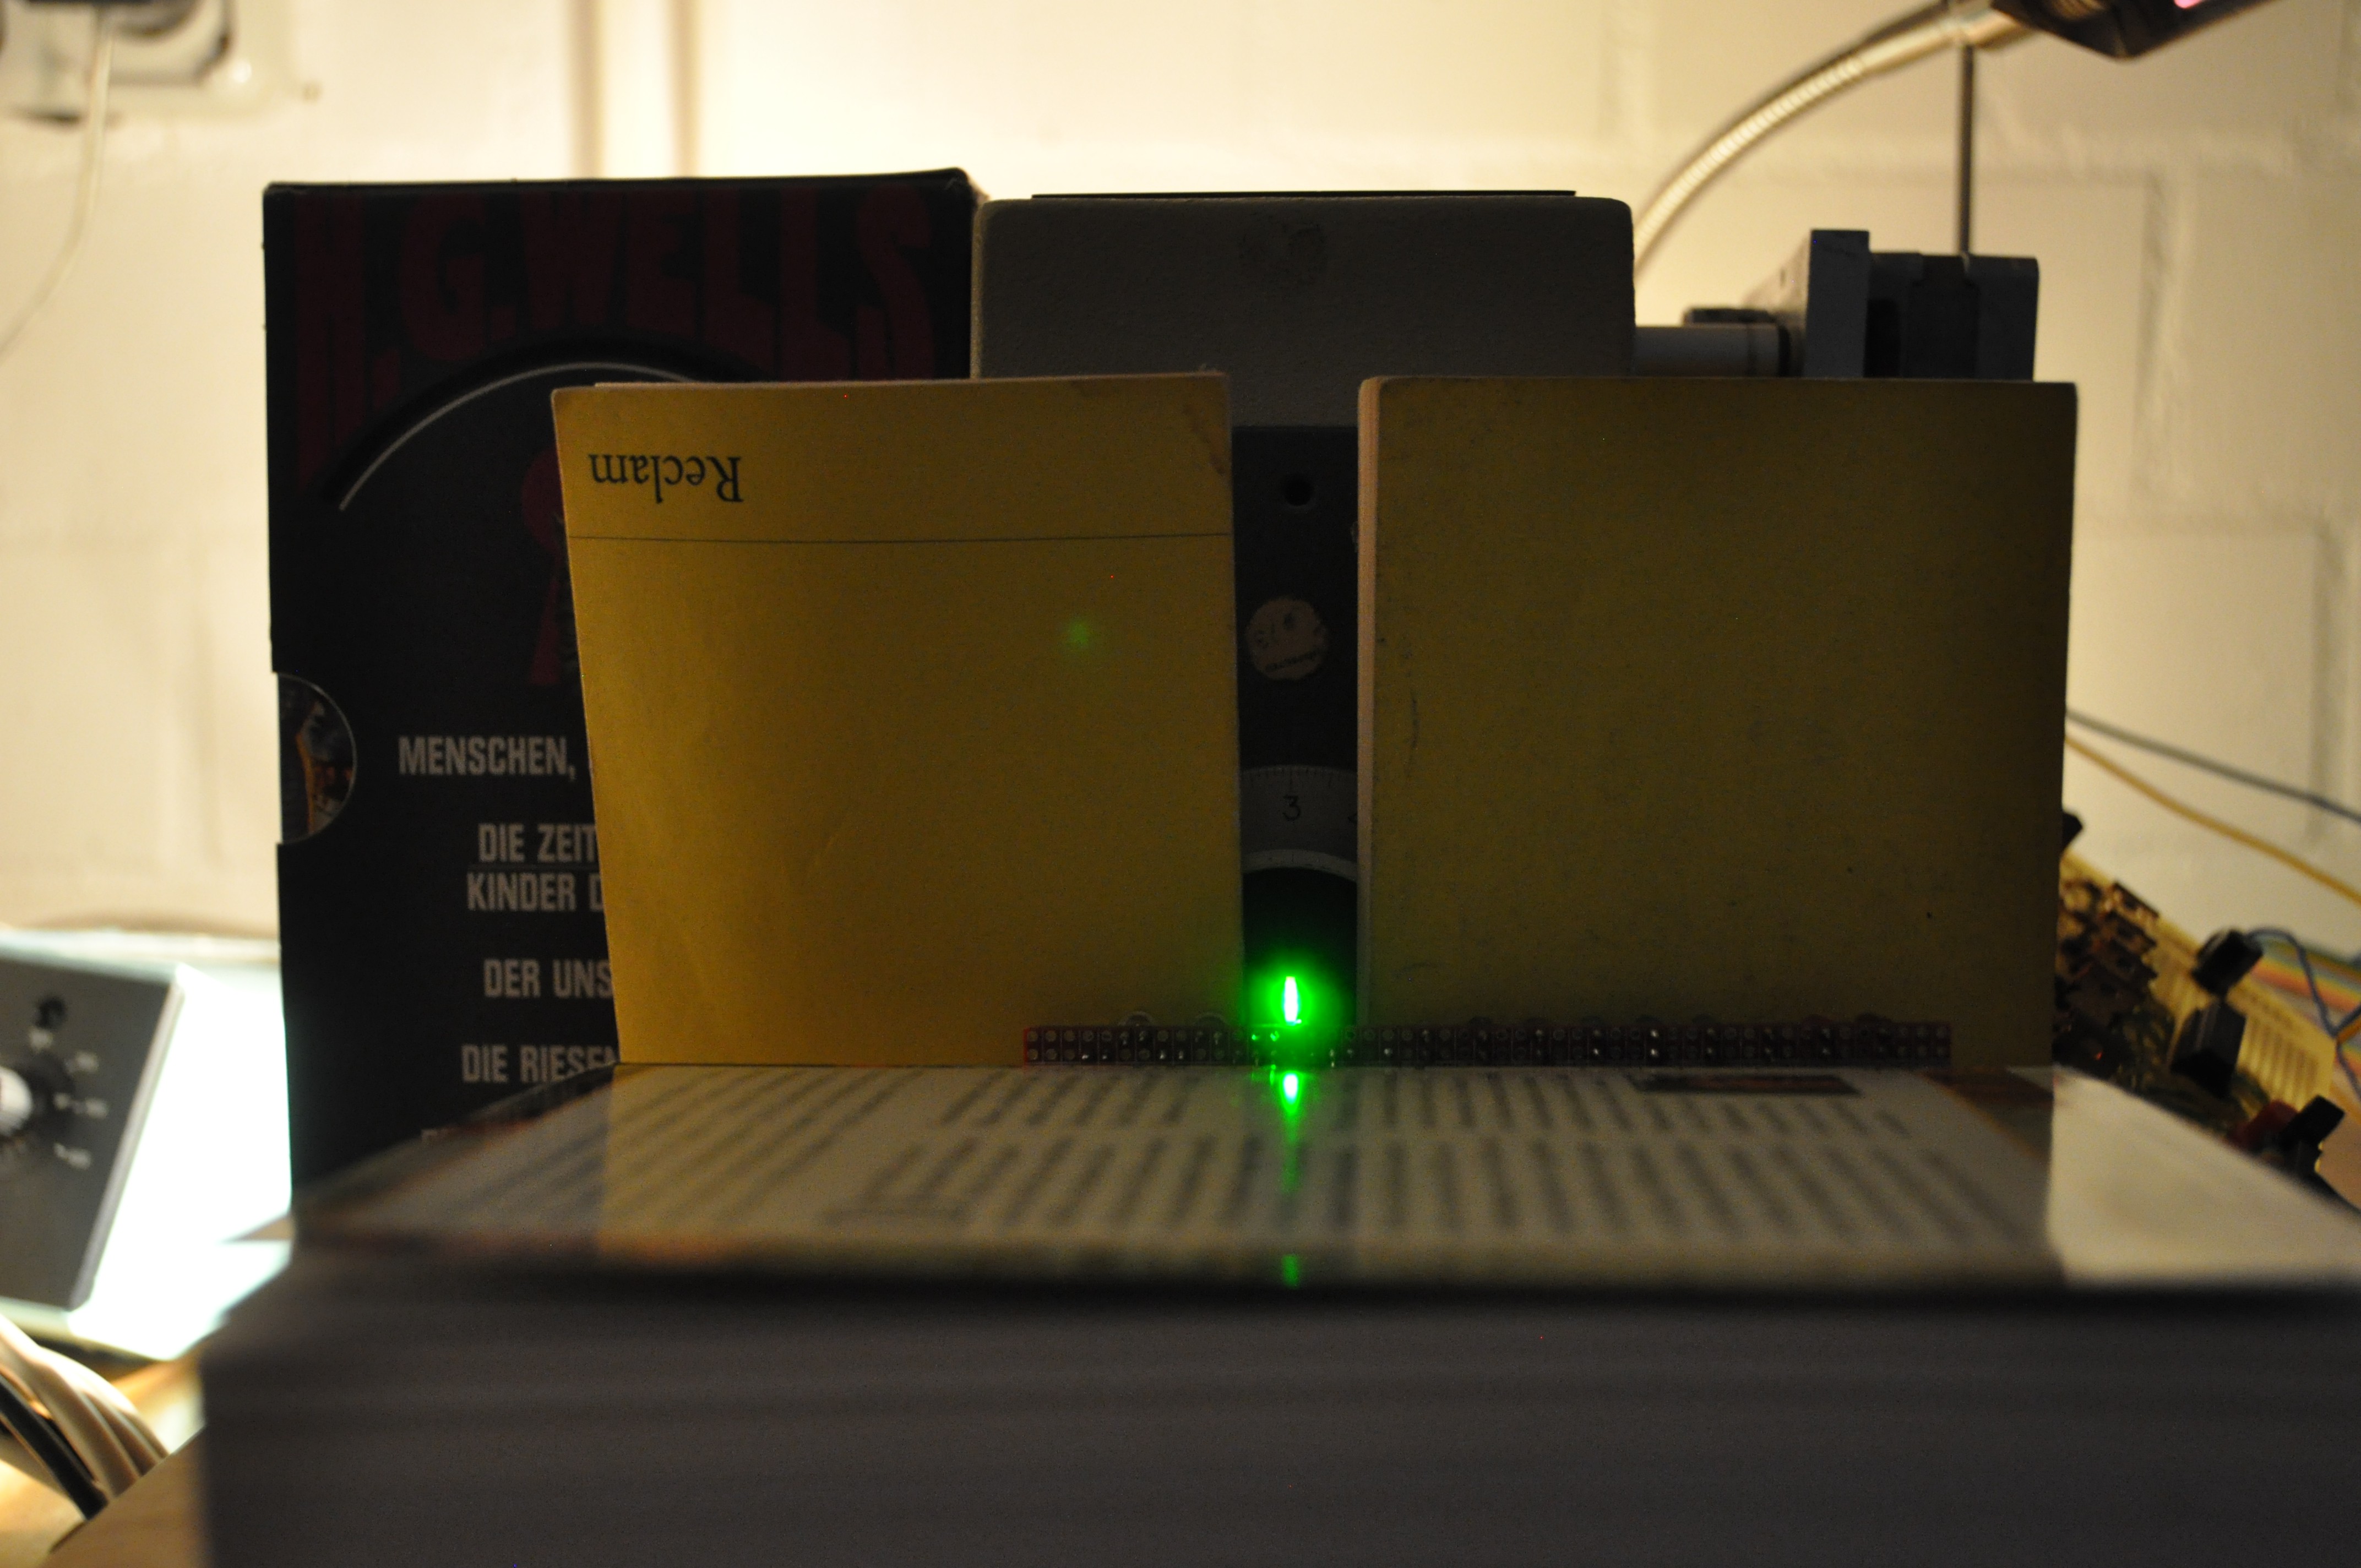
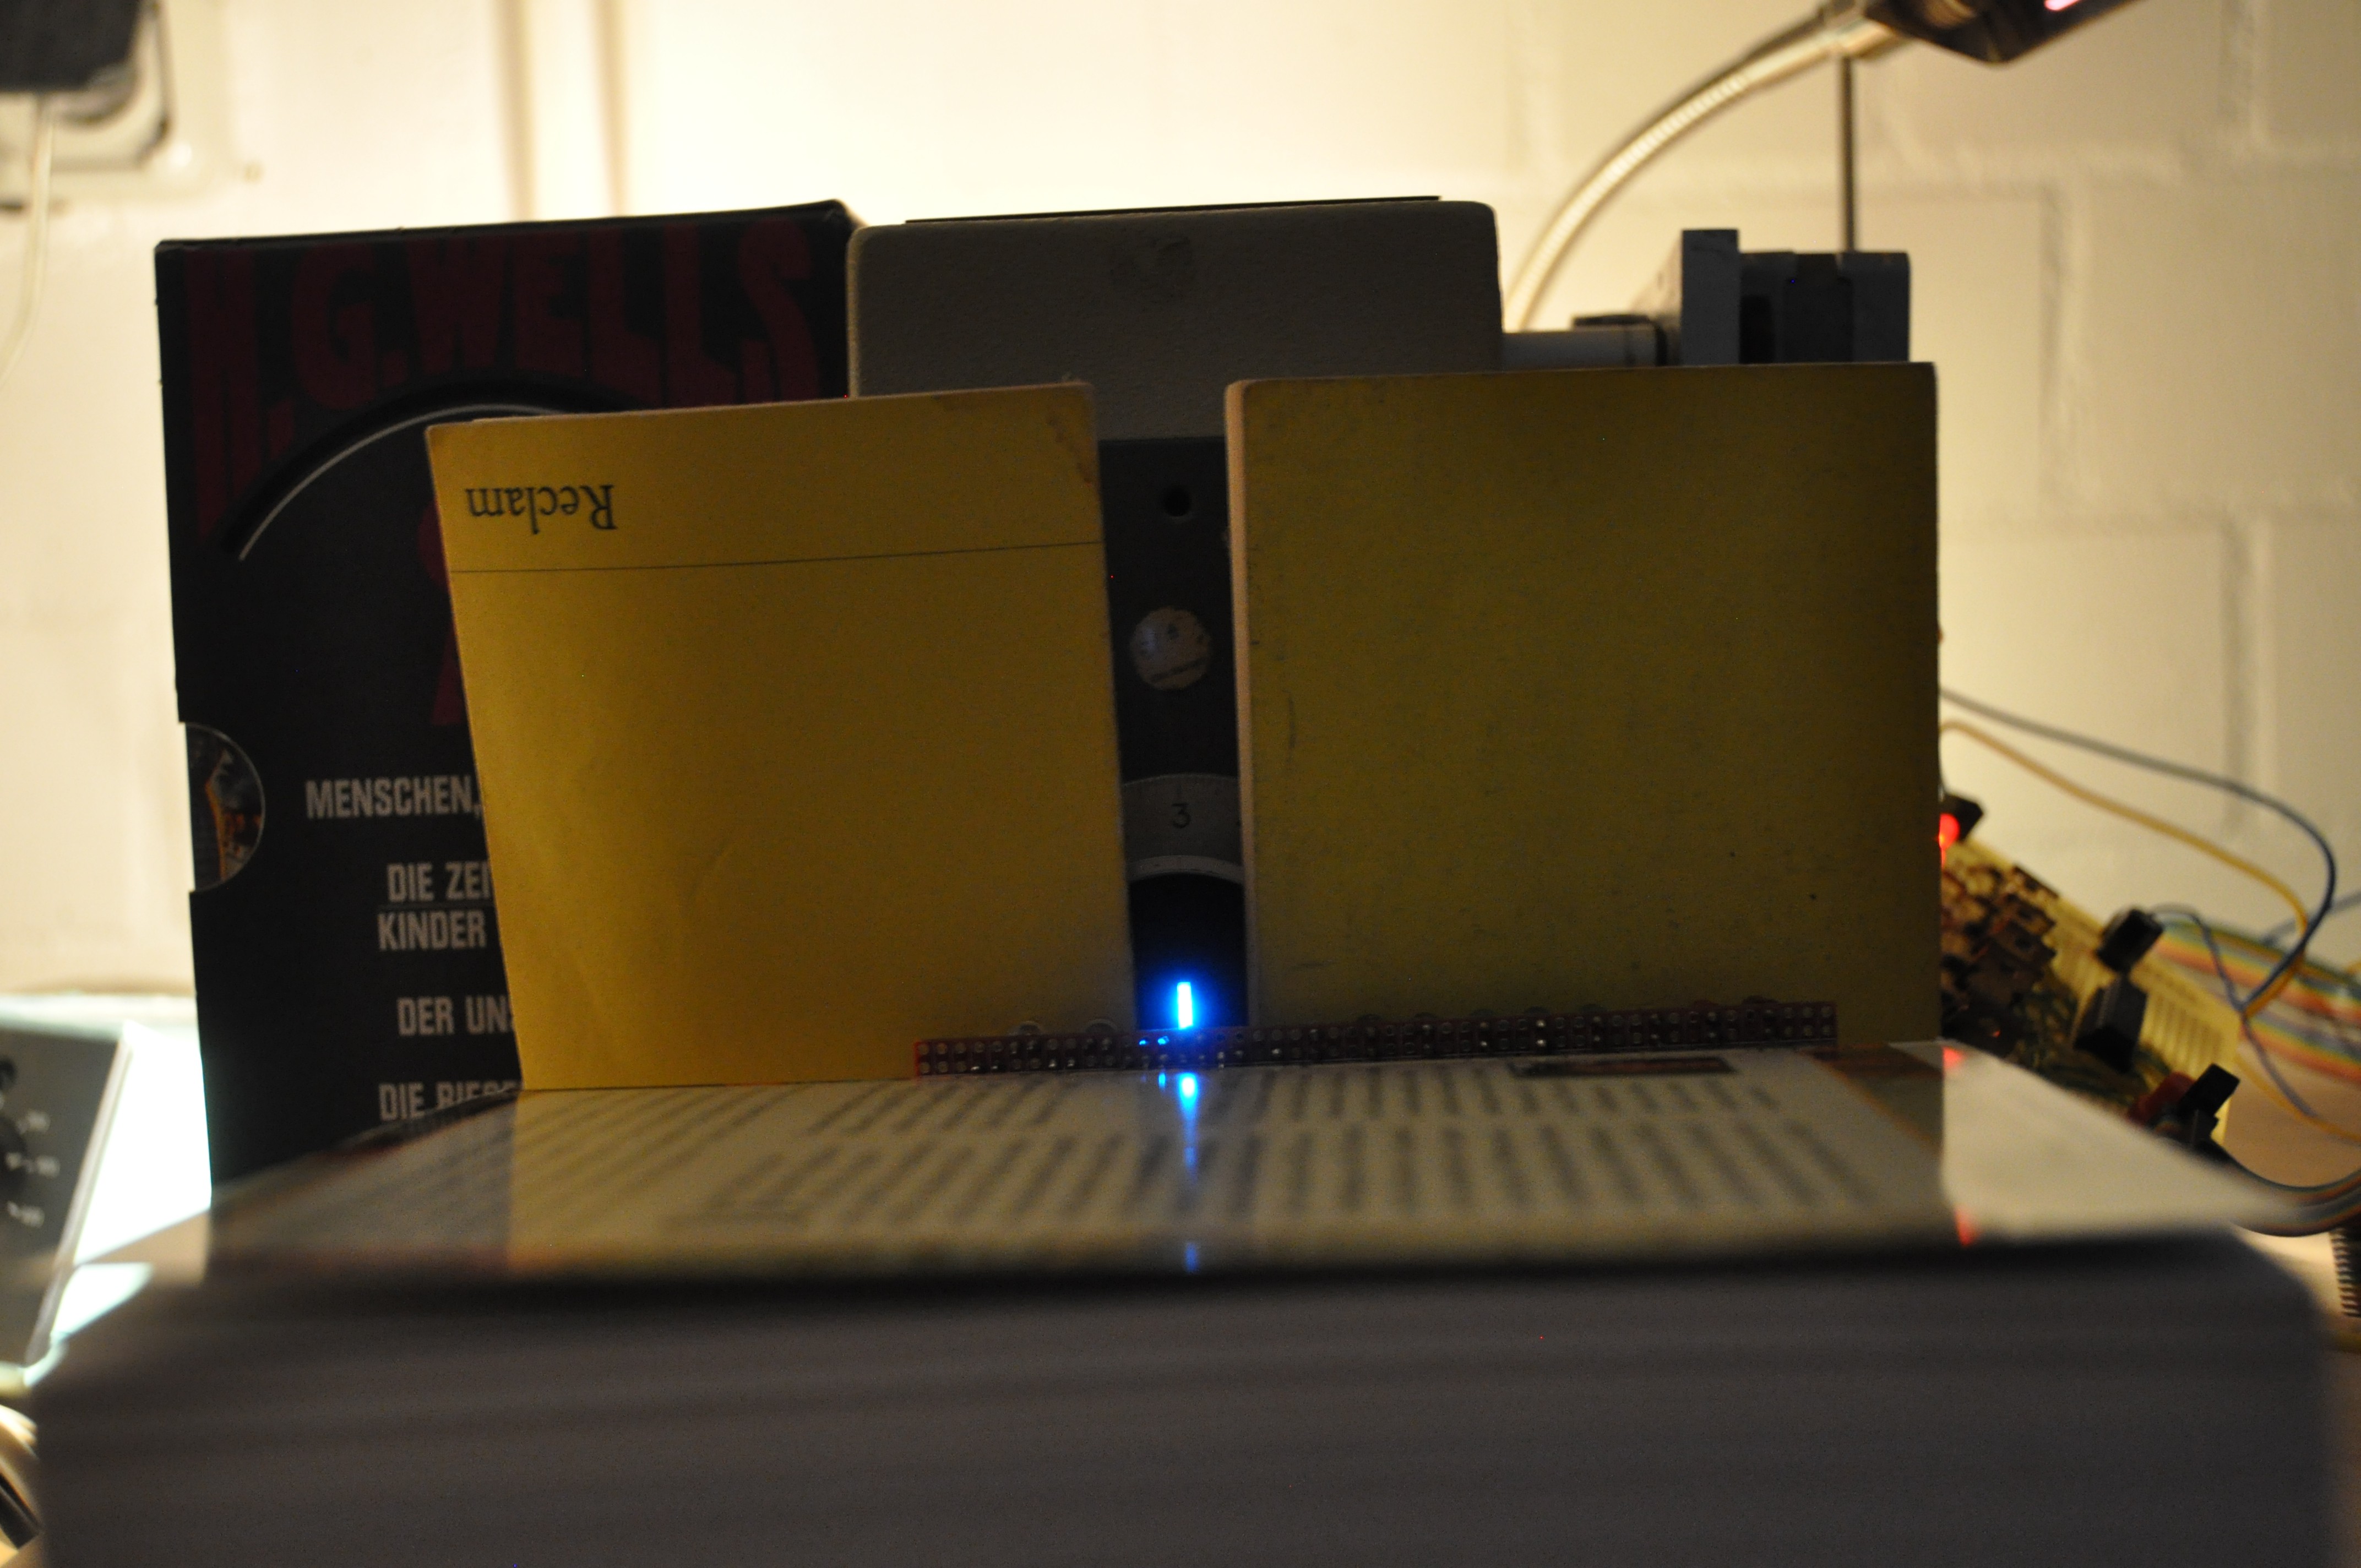
With the help of books of various weights and sizes, the position of the LED under examination is carefully adjusted to be illuminated by the output beam of the monochromator.
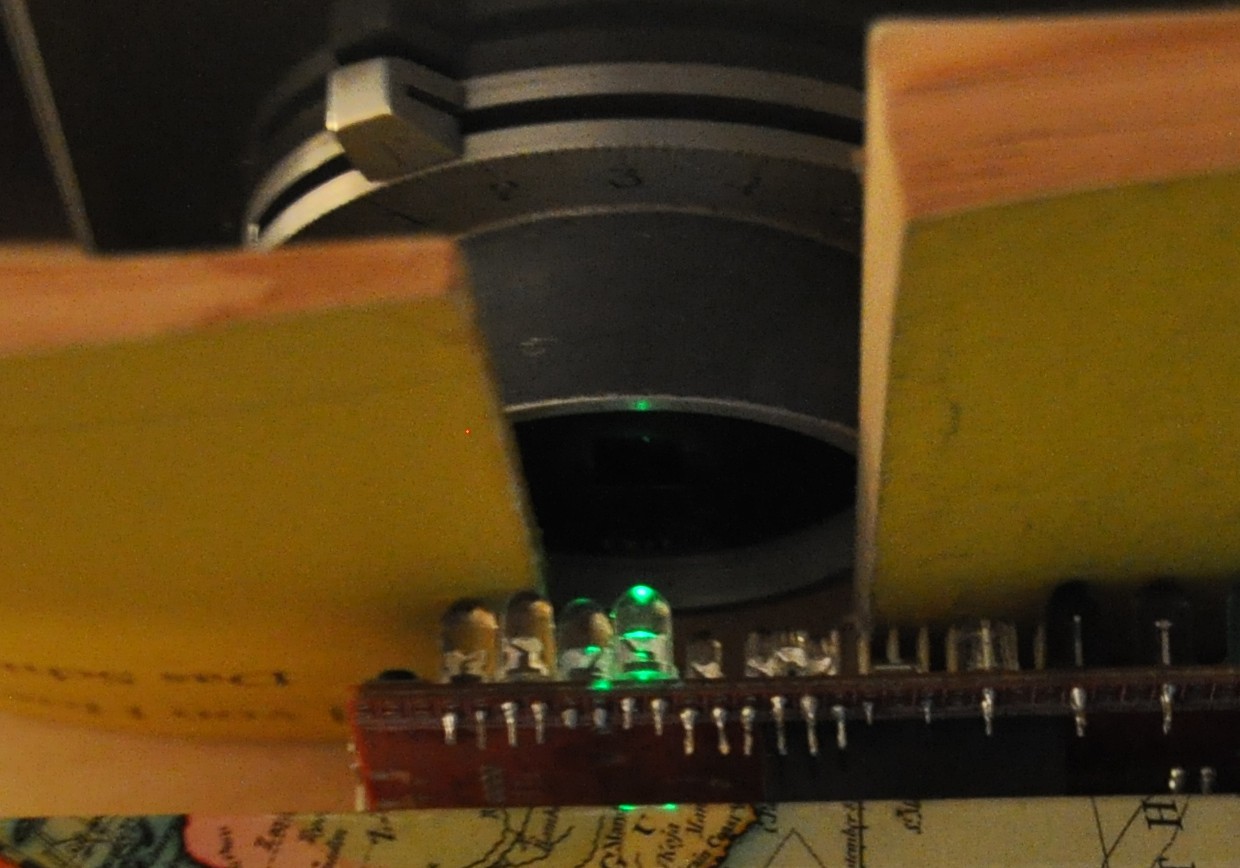
Please note that this is the monochromator output illuminating the dark LED.
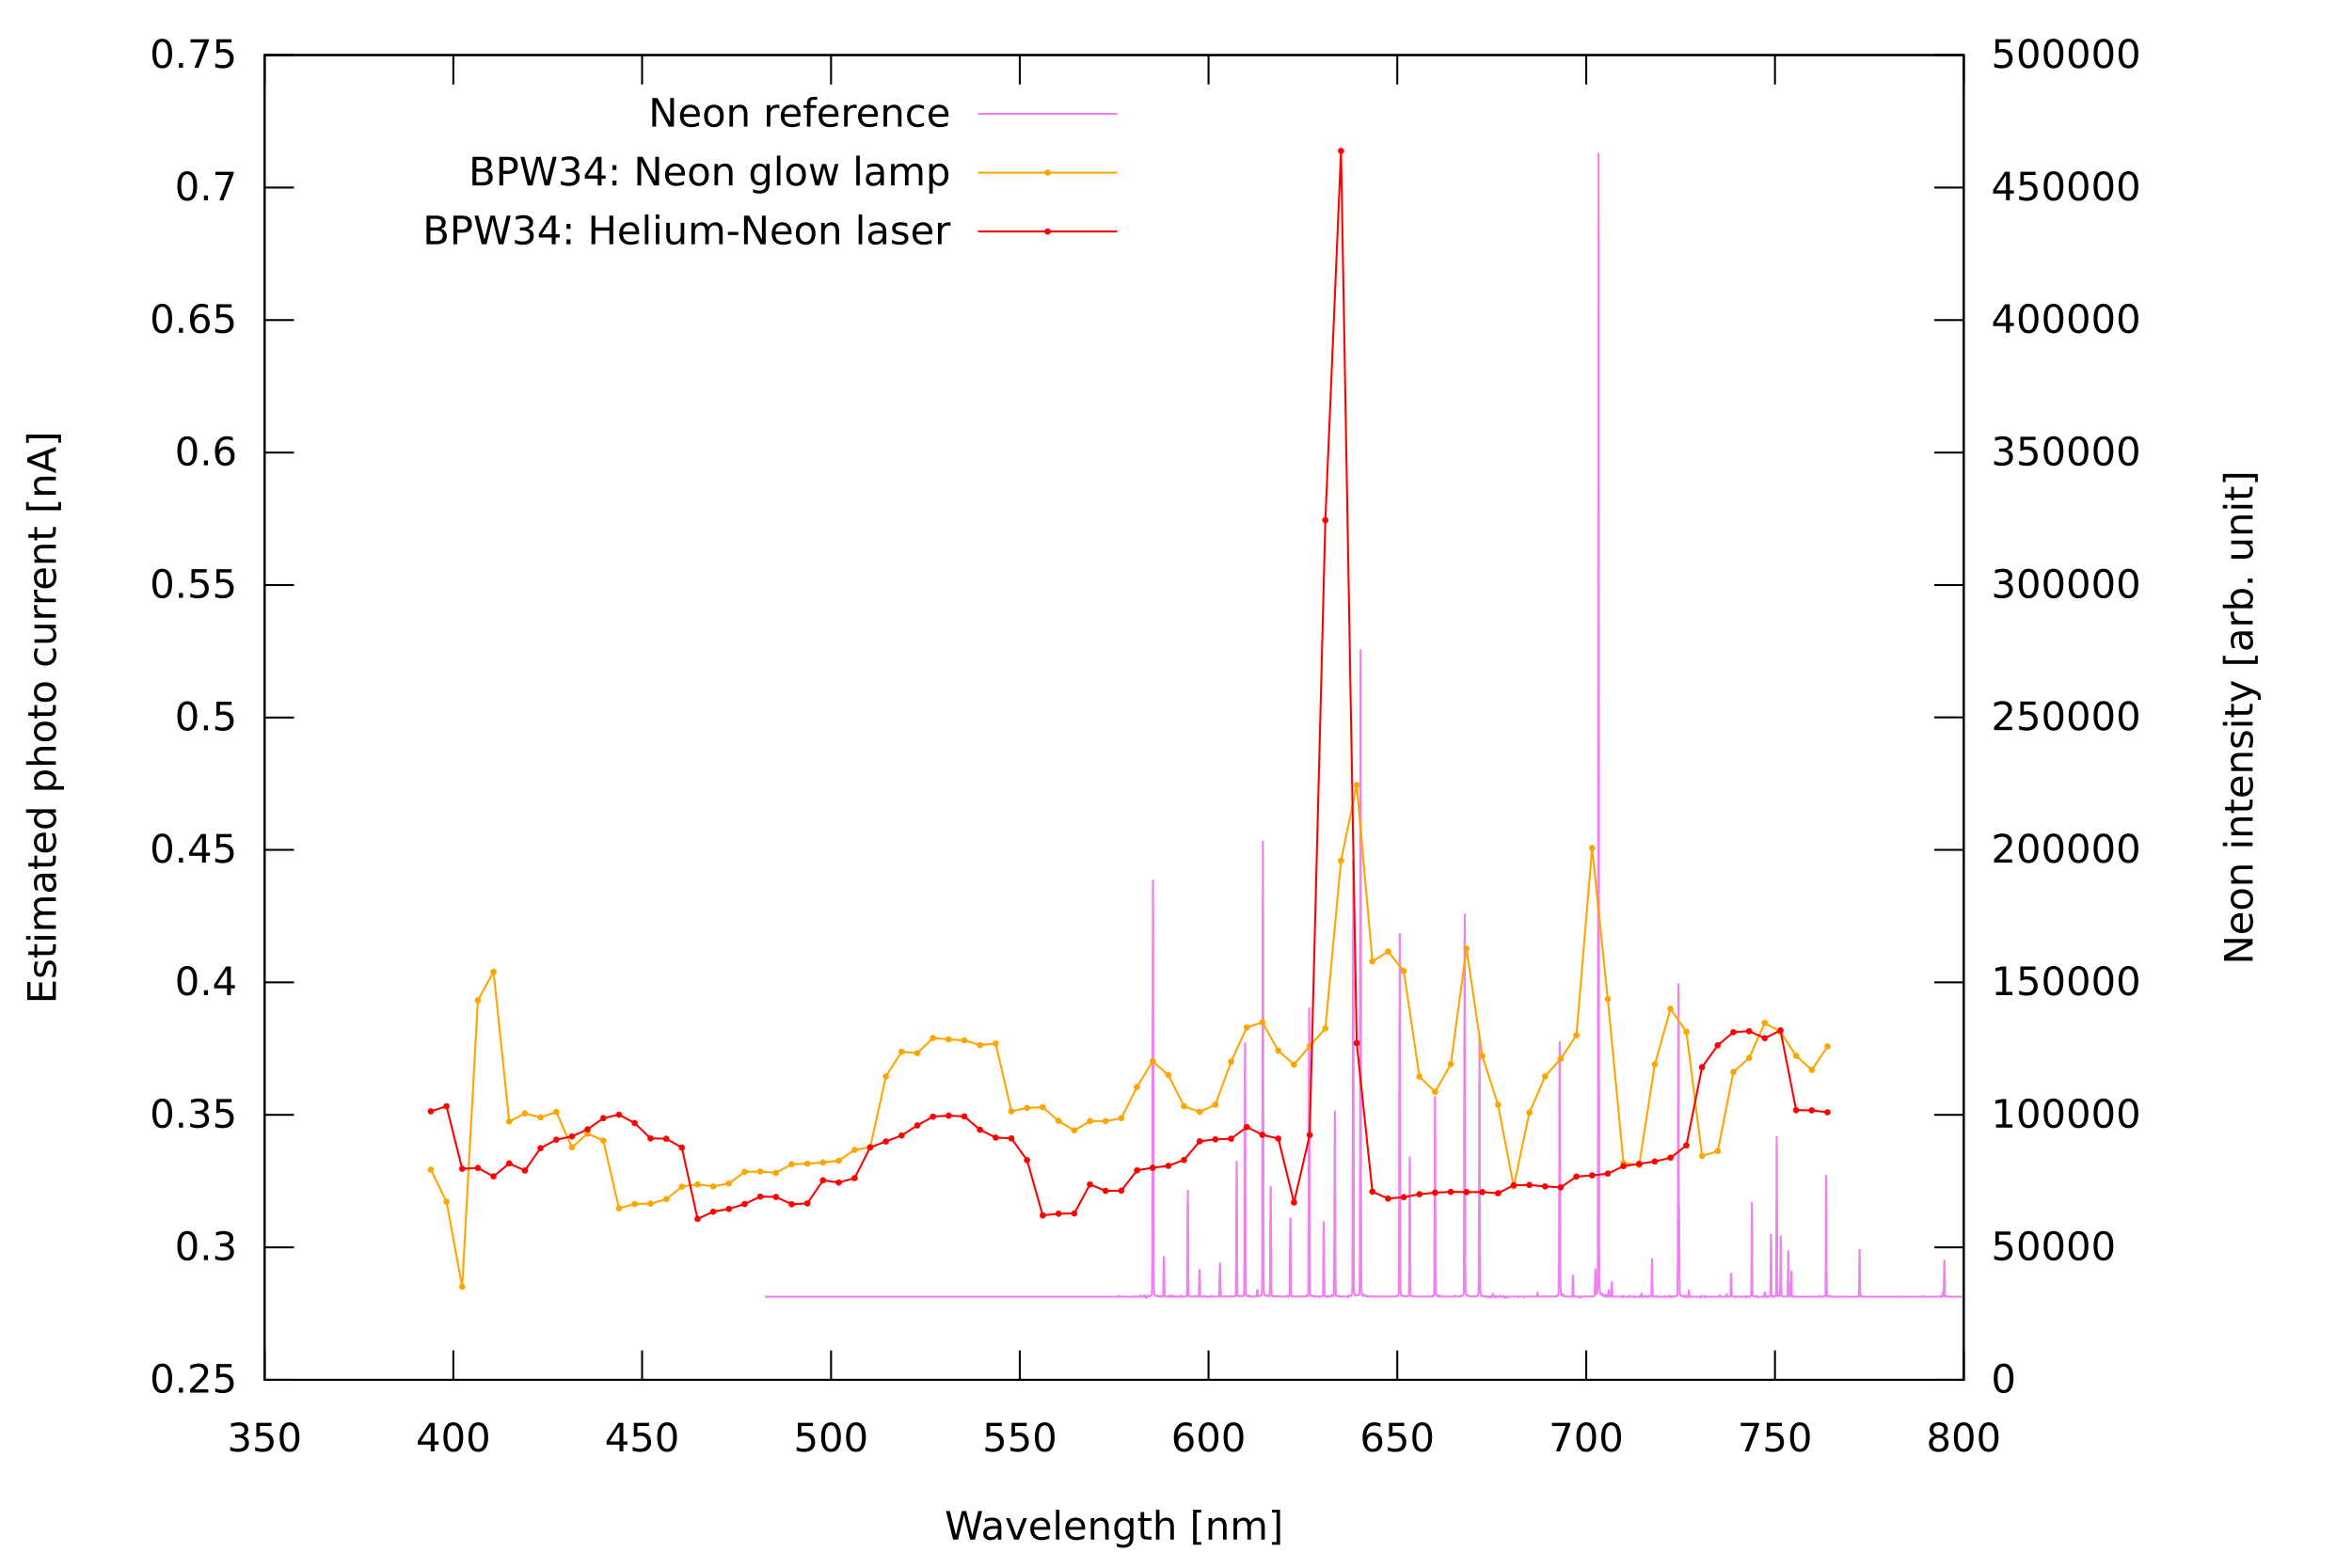
For calibration and mapping of motor steps to wavelengths, I used a Helium-Neon laser with 632.8 nm output for offset correction and then a neon glow lamp for determining the correct scale factor.
In order to get enough intensity from this simple setup, I had to set input and output slit widths to 1.5 mm. For comparison: The spectrometer above has an input slit width of 10 um, therefore, the experiment will have a quite coarse resolution and I choose to take one data point every 20 steps. The red Helium-Neon laser line has a very narrow line width, but still is spread out over five data points, so we will not gain more resolution by using smaller step sizes with given slit width.
Next step was to derive a very simplified model of the discharge time vs. photo current, which is - within reasonable bounds - hopefully linear with irradiance(wavelength) * responsivity(wavelegth).
Therefore, lets model this as a capacitor with a constant current source.
Let voltage u(t) = U0 + Q(t)/C = U0 + (-I_Photo * t) / C
I know, there is dark current, leakage current, and, the largest error in this simplification: Junction capacitance is heavily dependent on voltage. For BPW34, C_j is specified to be typically 70 pF at zero reverse voltage and 25 to 40 pF at 3V reverse voltage. Usually, photodiodes are used either as current source with the capacitance just low-pass filtering the output, or with a high, but constant reverse voltage. I need to take care of the variable capacitance in our weird mode of measurement in parallel with a constant capacitance of the wirings, but math is going unpleasant there.
Let's try a first rough estimate with the assumption of constant capacitance, now the current necessary to discharge the LED from U0 to Ulow is:
I_photo = C/t * (U0 - Ulow)
I_photo therefore proportional to 1/t.
I set the maximum discharge time to $300000 * 14 cycles on 120 MHz, giving 0.367 s, which, assuming a capacitance of 20 pF and a discharge from Vcc of 3.3V to low-going hysteresis of 0.35*Vcc = 1.16V, translates to a photo current in the order of magnitude of about 0.12 nA.
Higher sensitivity can be reached by allowing longer discharge times, but for a first proof-of-concept for a sensitivity experiment to find out which types of LED are suitable for sensor usage, this may be a reasonable cutoff.
Now on to the results:
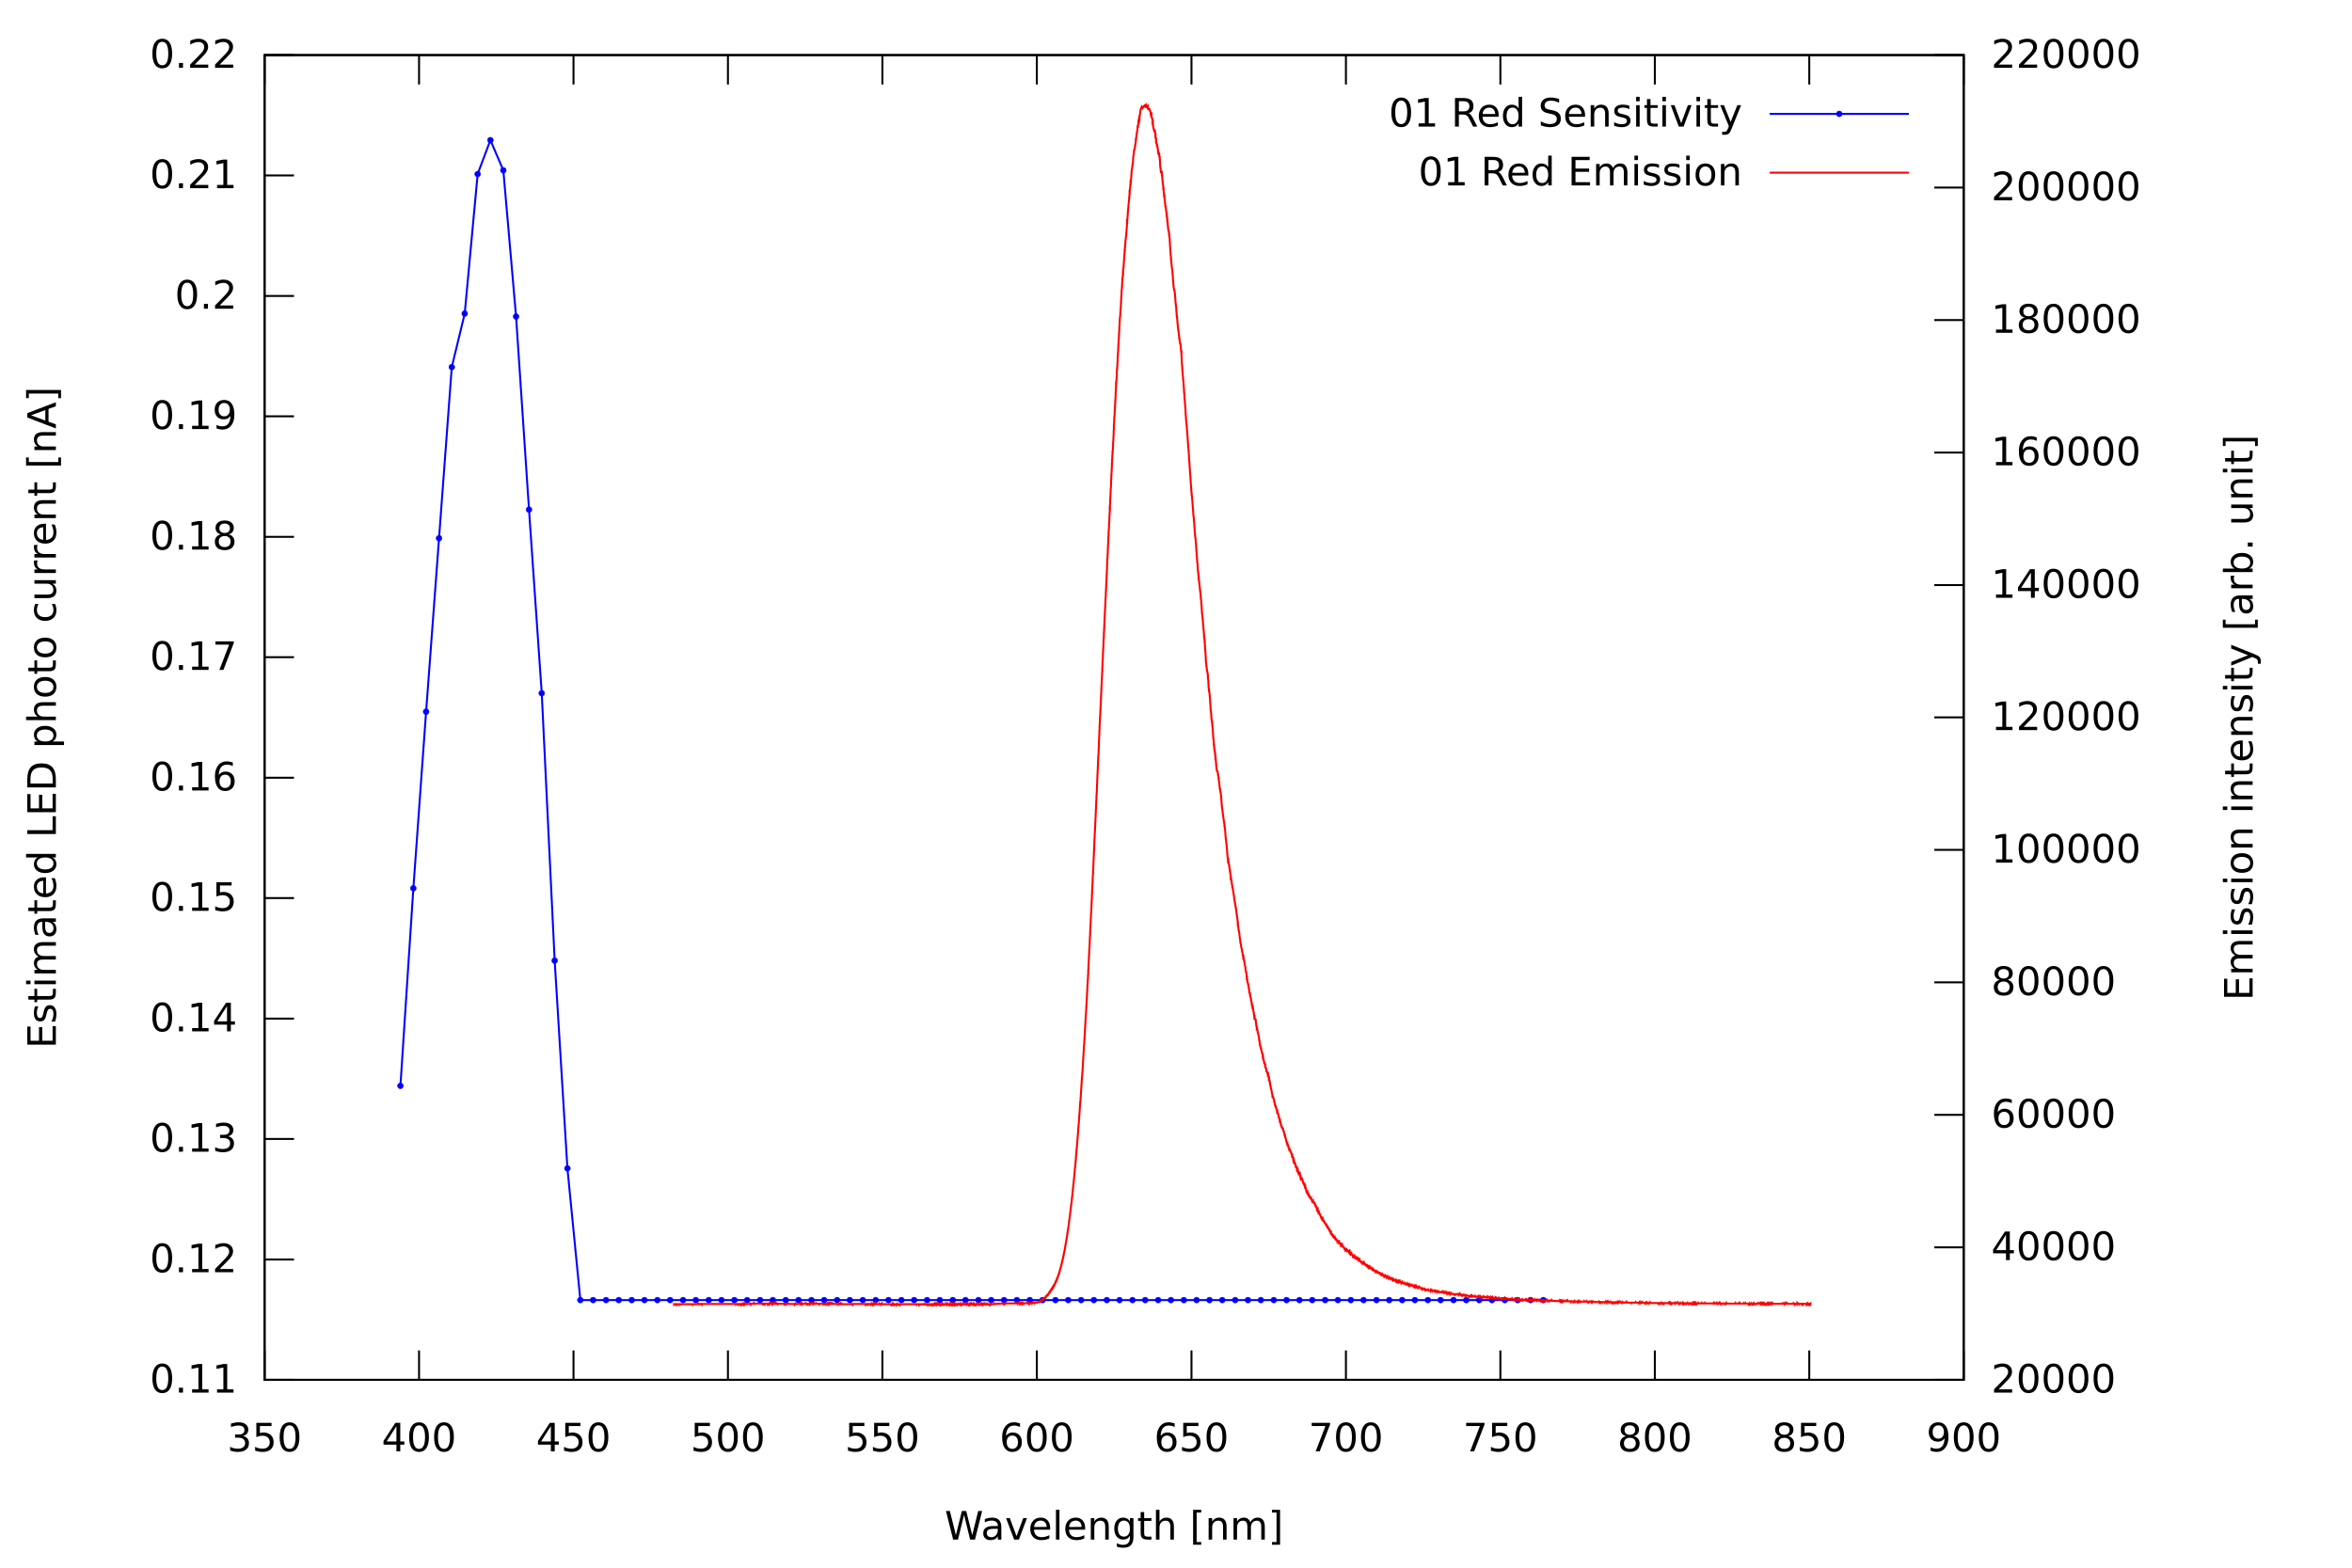 This red LED is sensitive to ultraviolet, probably due to being made from an indirect bandgap semiconductor material, which is unusual for red LEDs.
No sensitivity for red light is found as in the experiment using the decorative lamp, probably due to the low intensity of the monochromator output.
 This red LED was not sensitive enough at all to see any of the monochromator output.
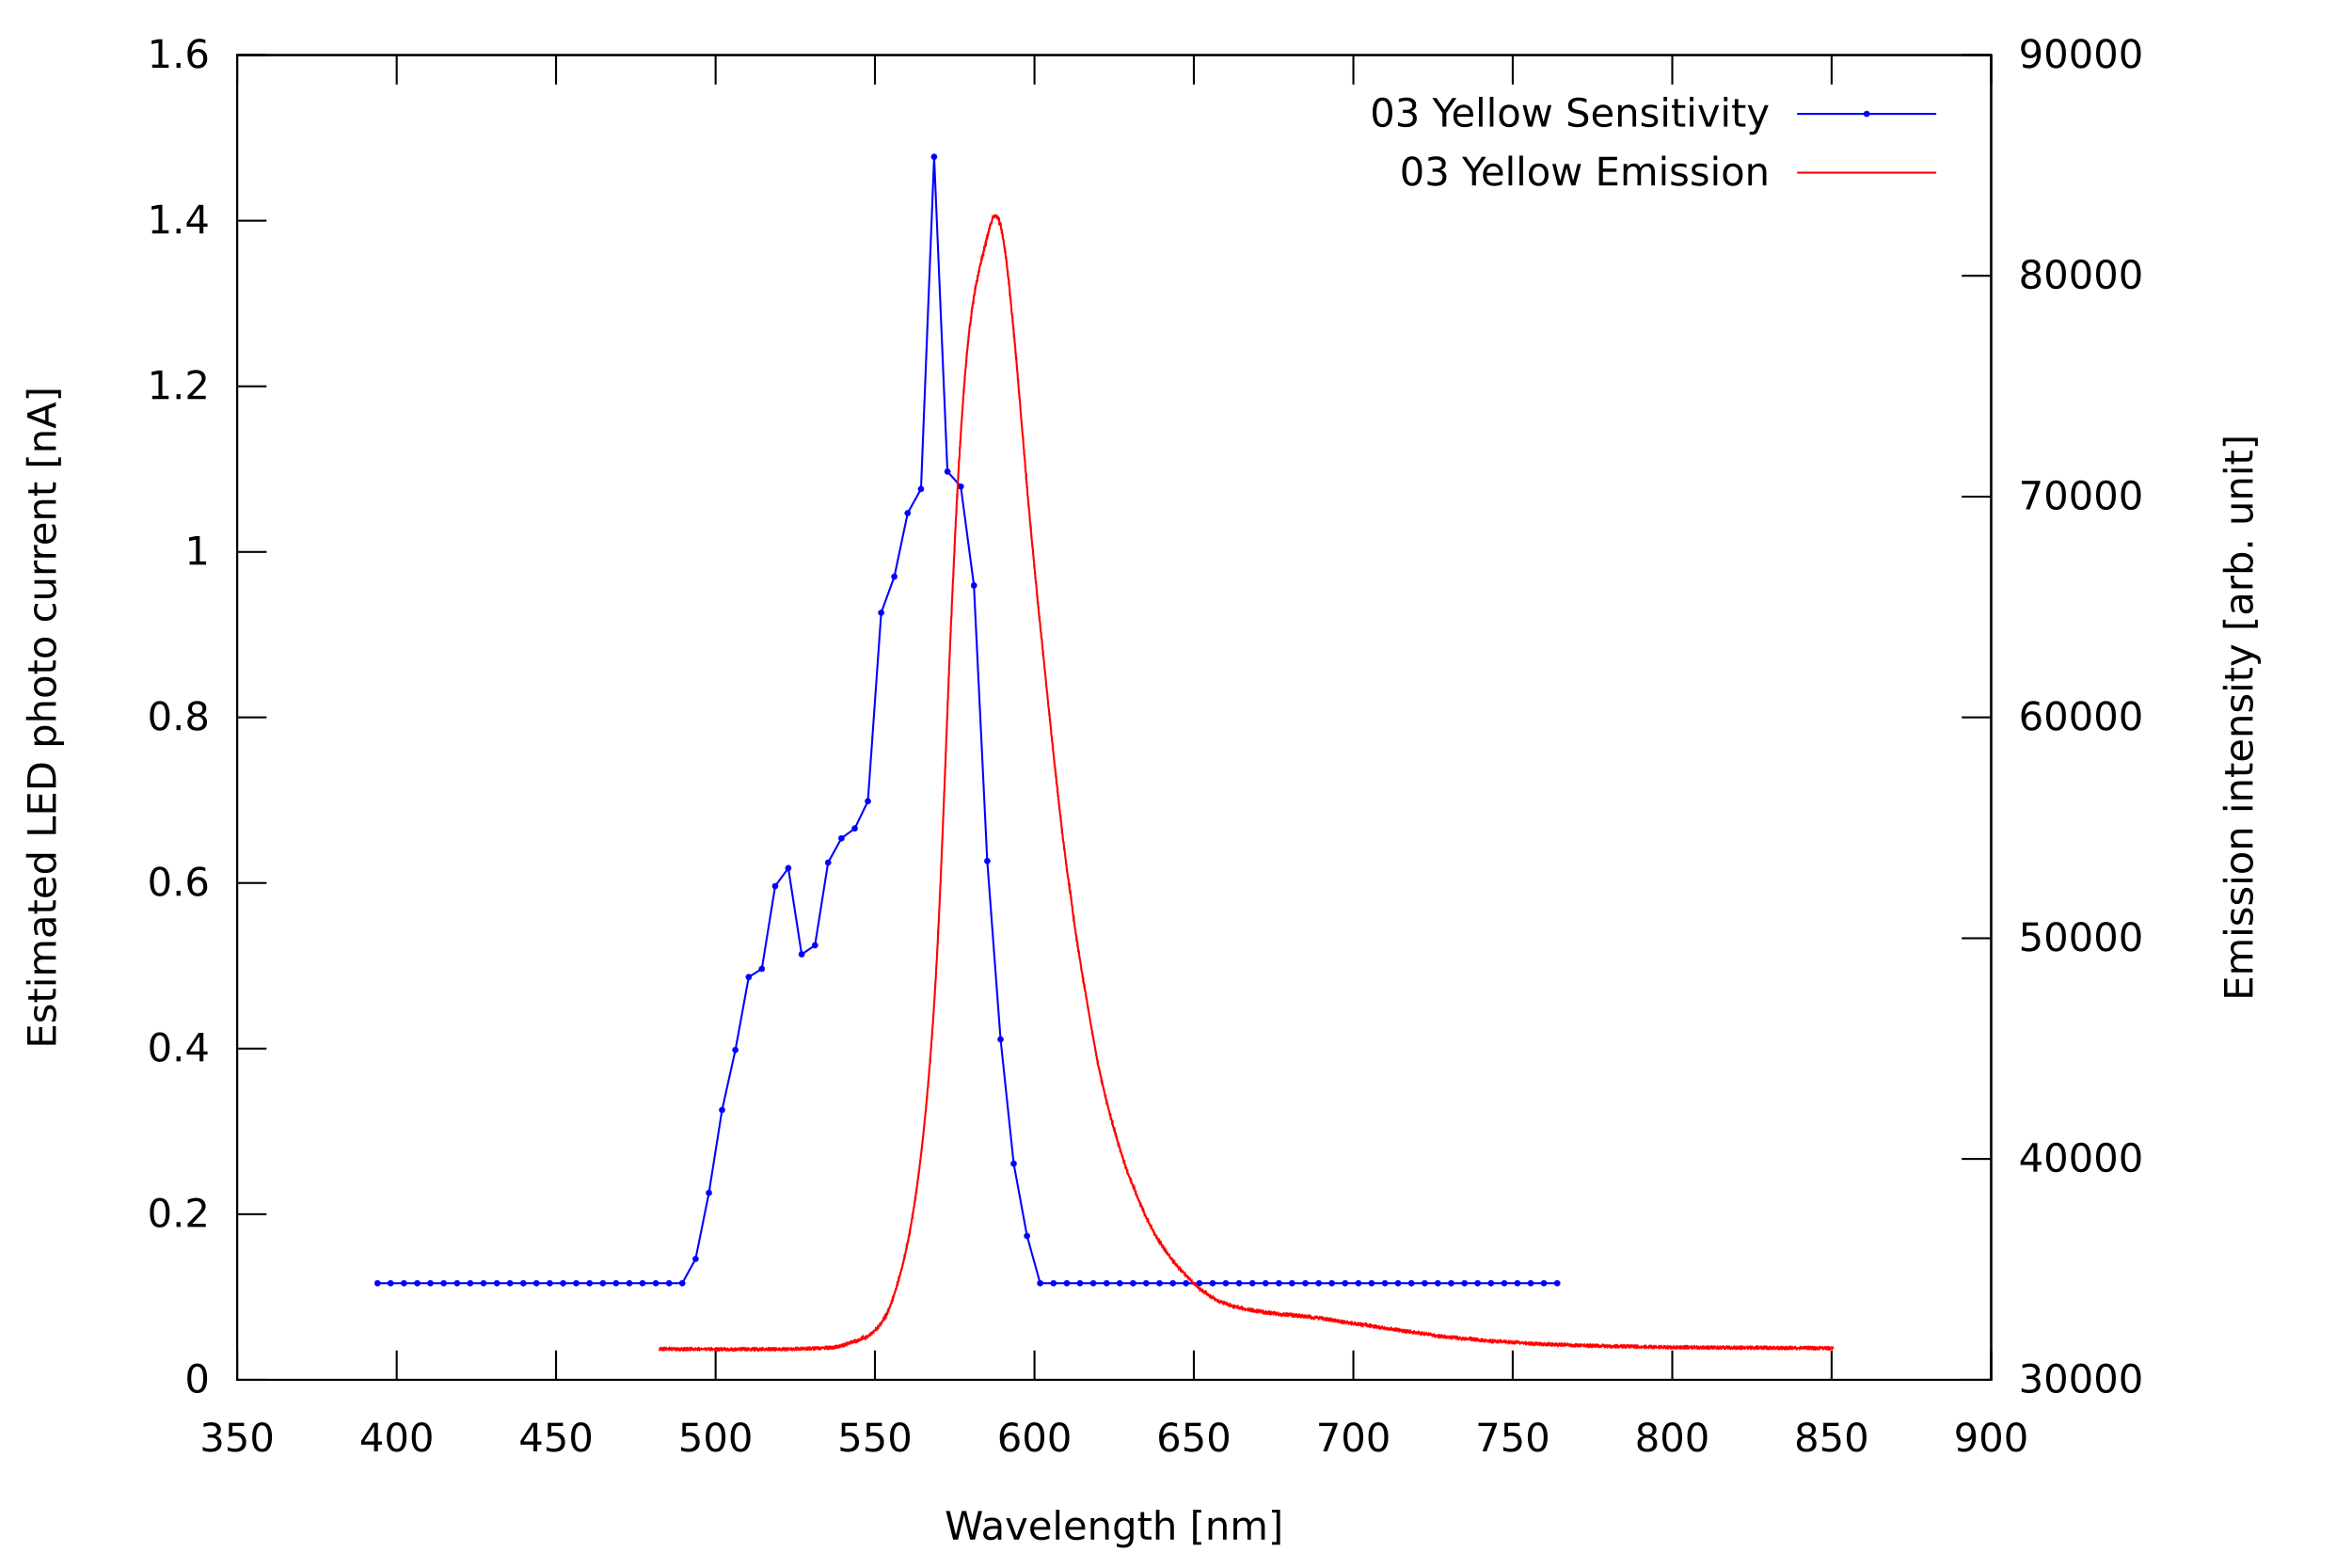 This yellow LED behaves as expected for a direct bandgap material, with the sensitivity curve shifted to slightly shorter wavelengths than the emission, partially overlapping.
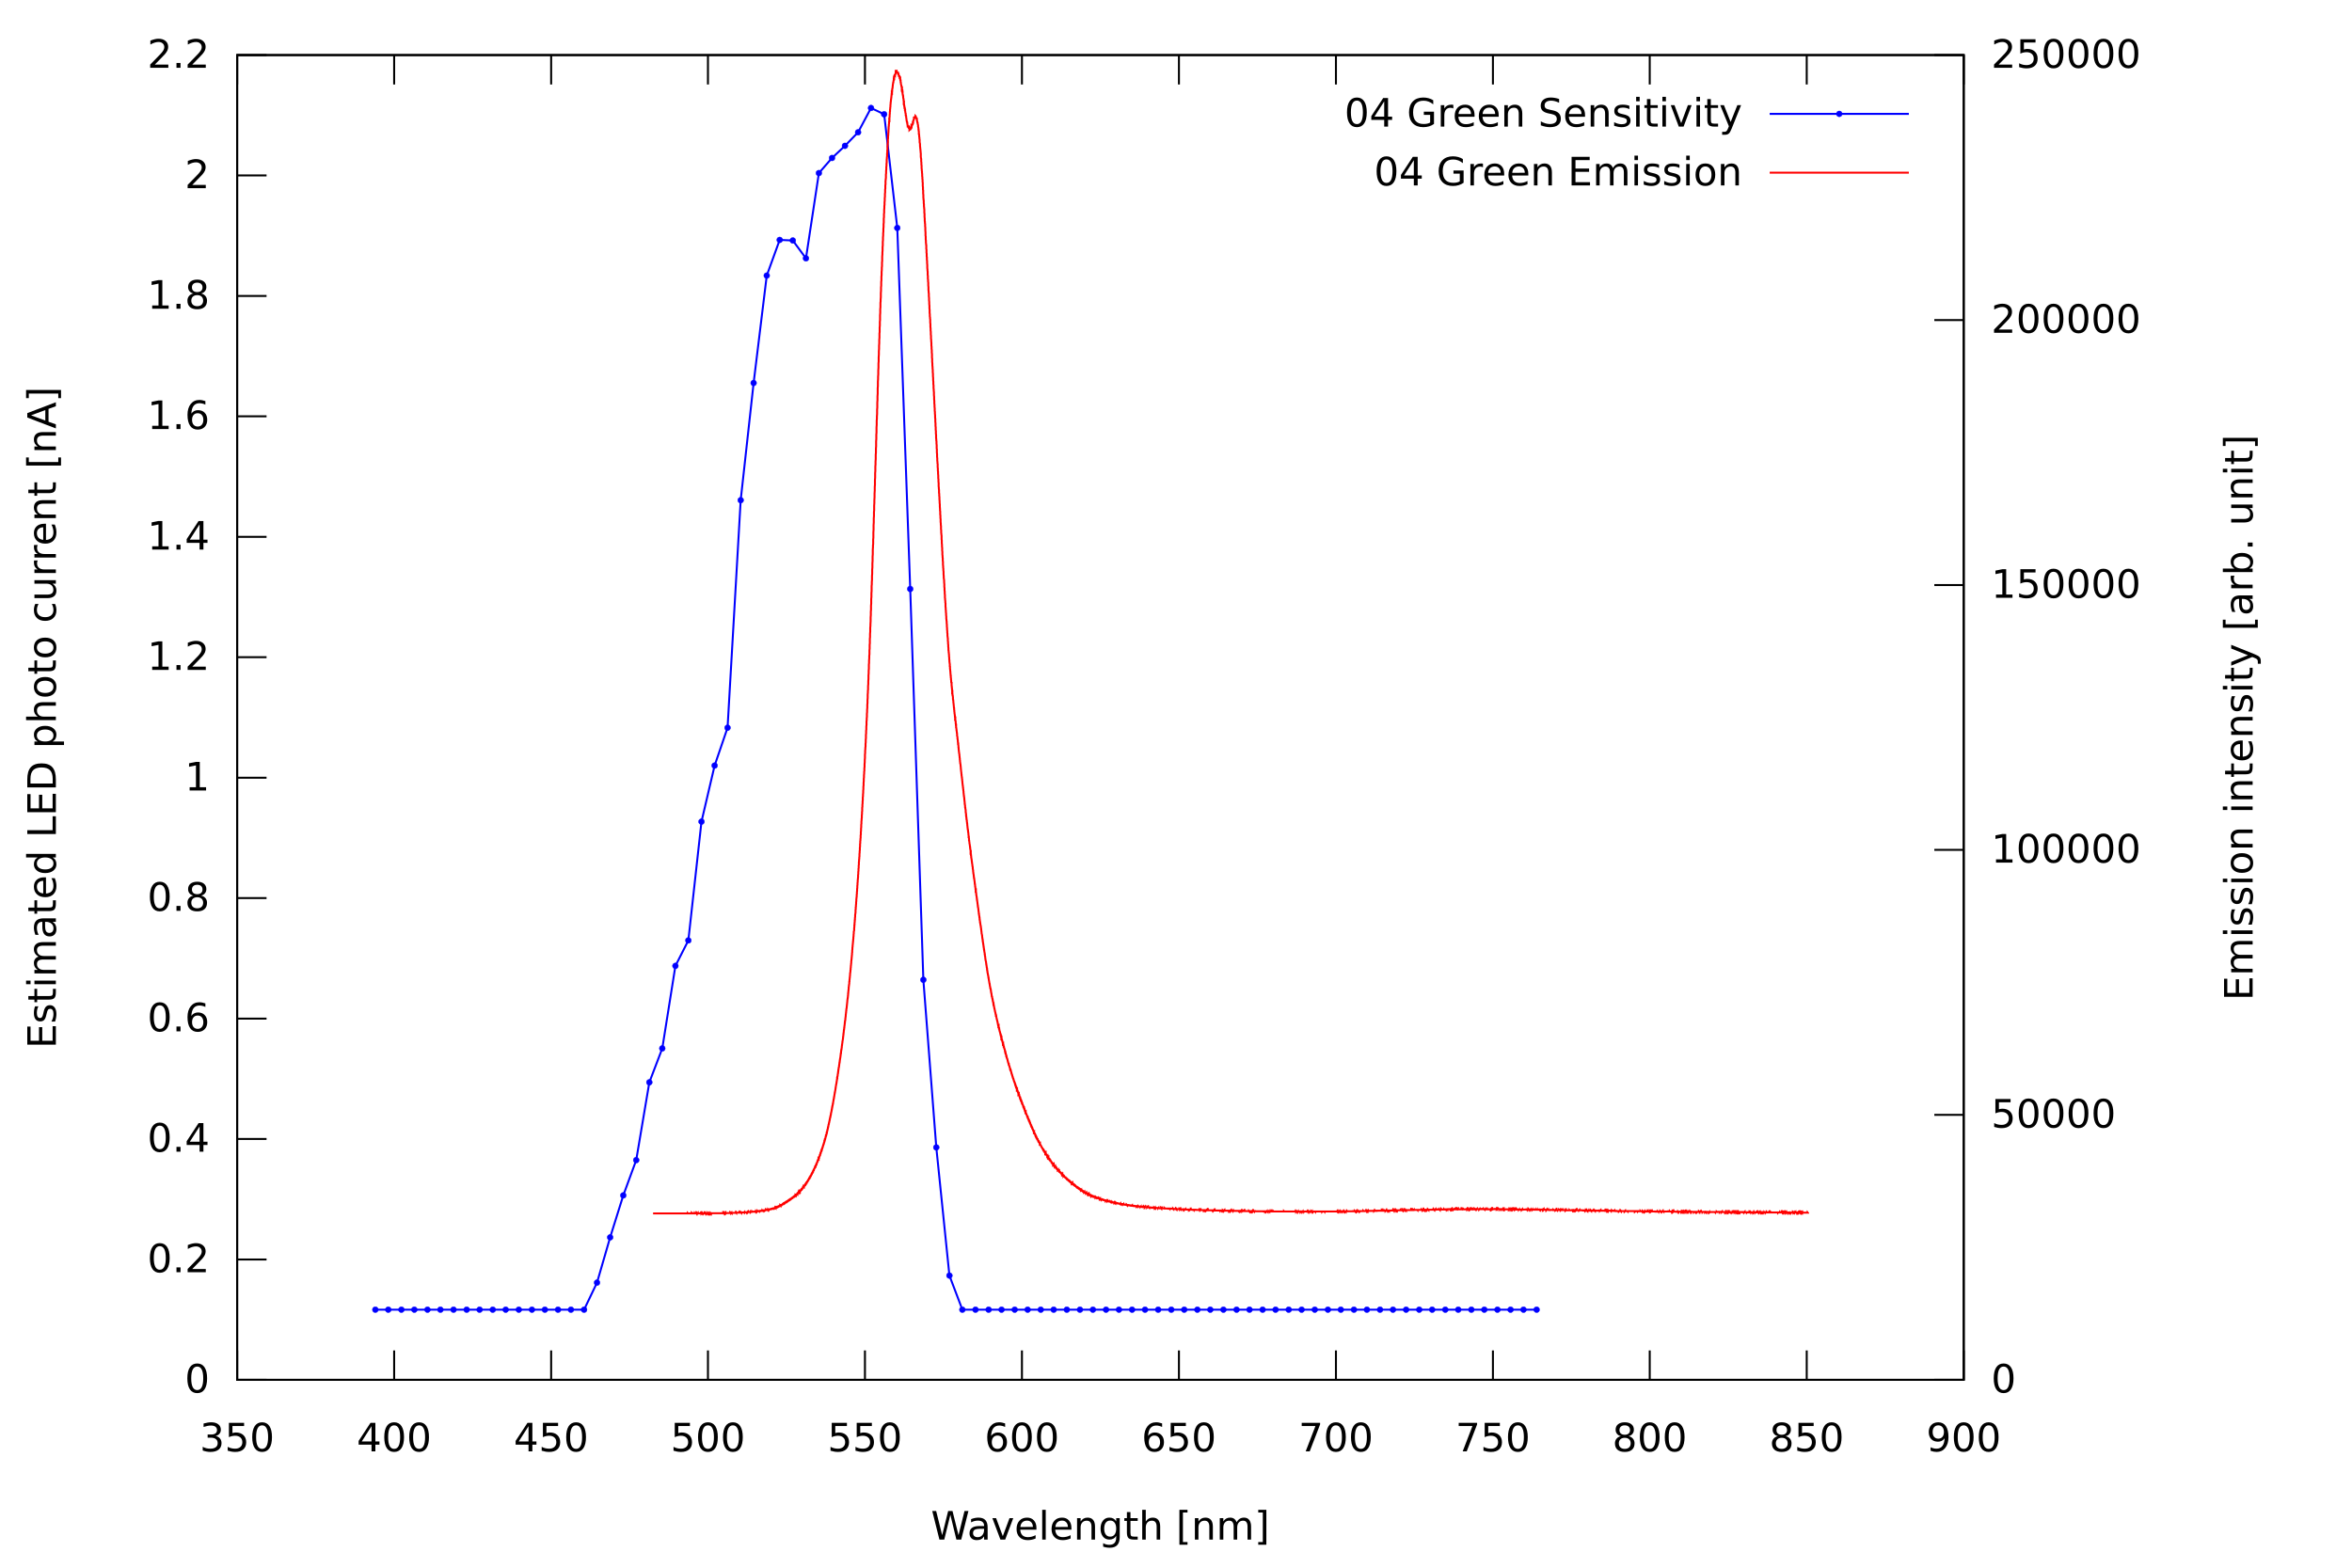
This green LED behaves as expected, too.
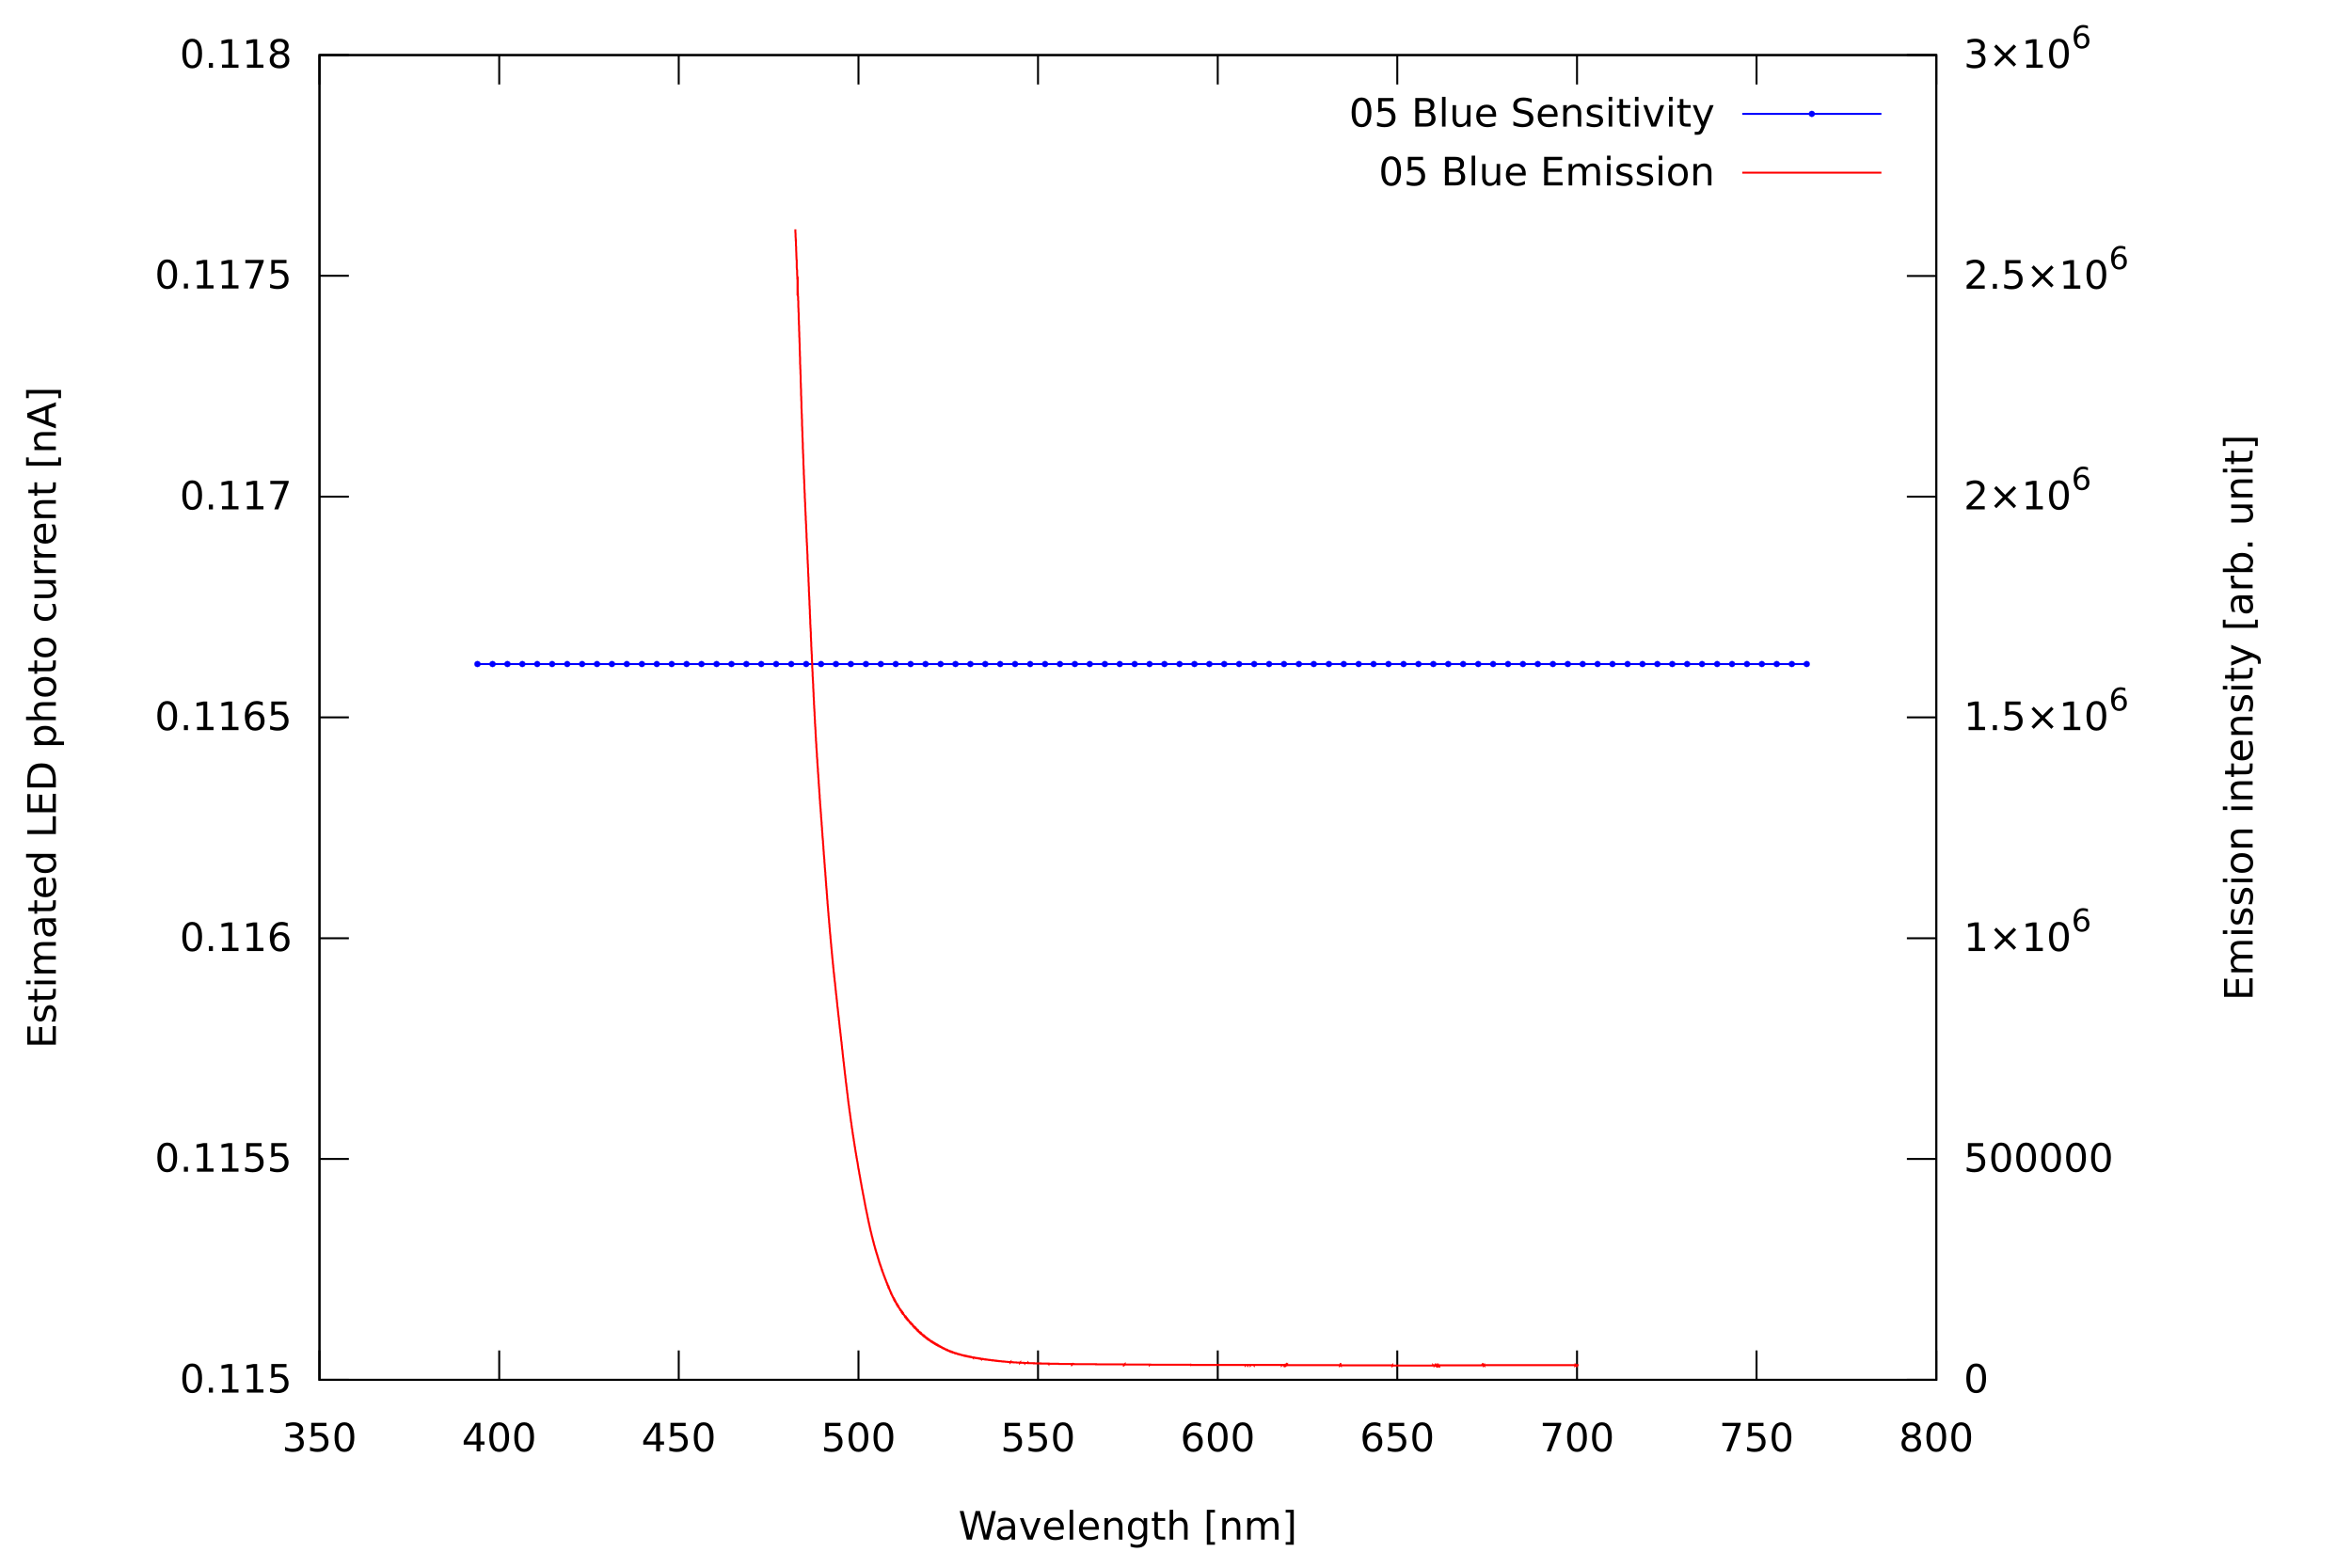
This blue LED was not sensitive enough at all to see any of the monochromator output. Emission spectrum is clipped due to interference filter in spectrometer.
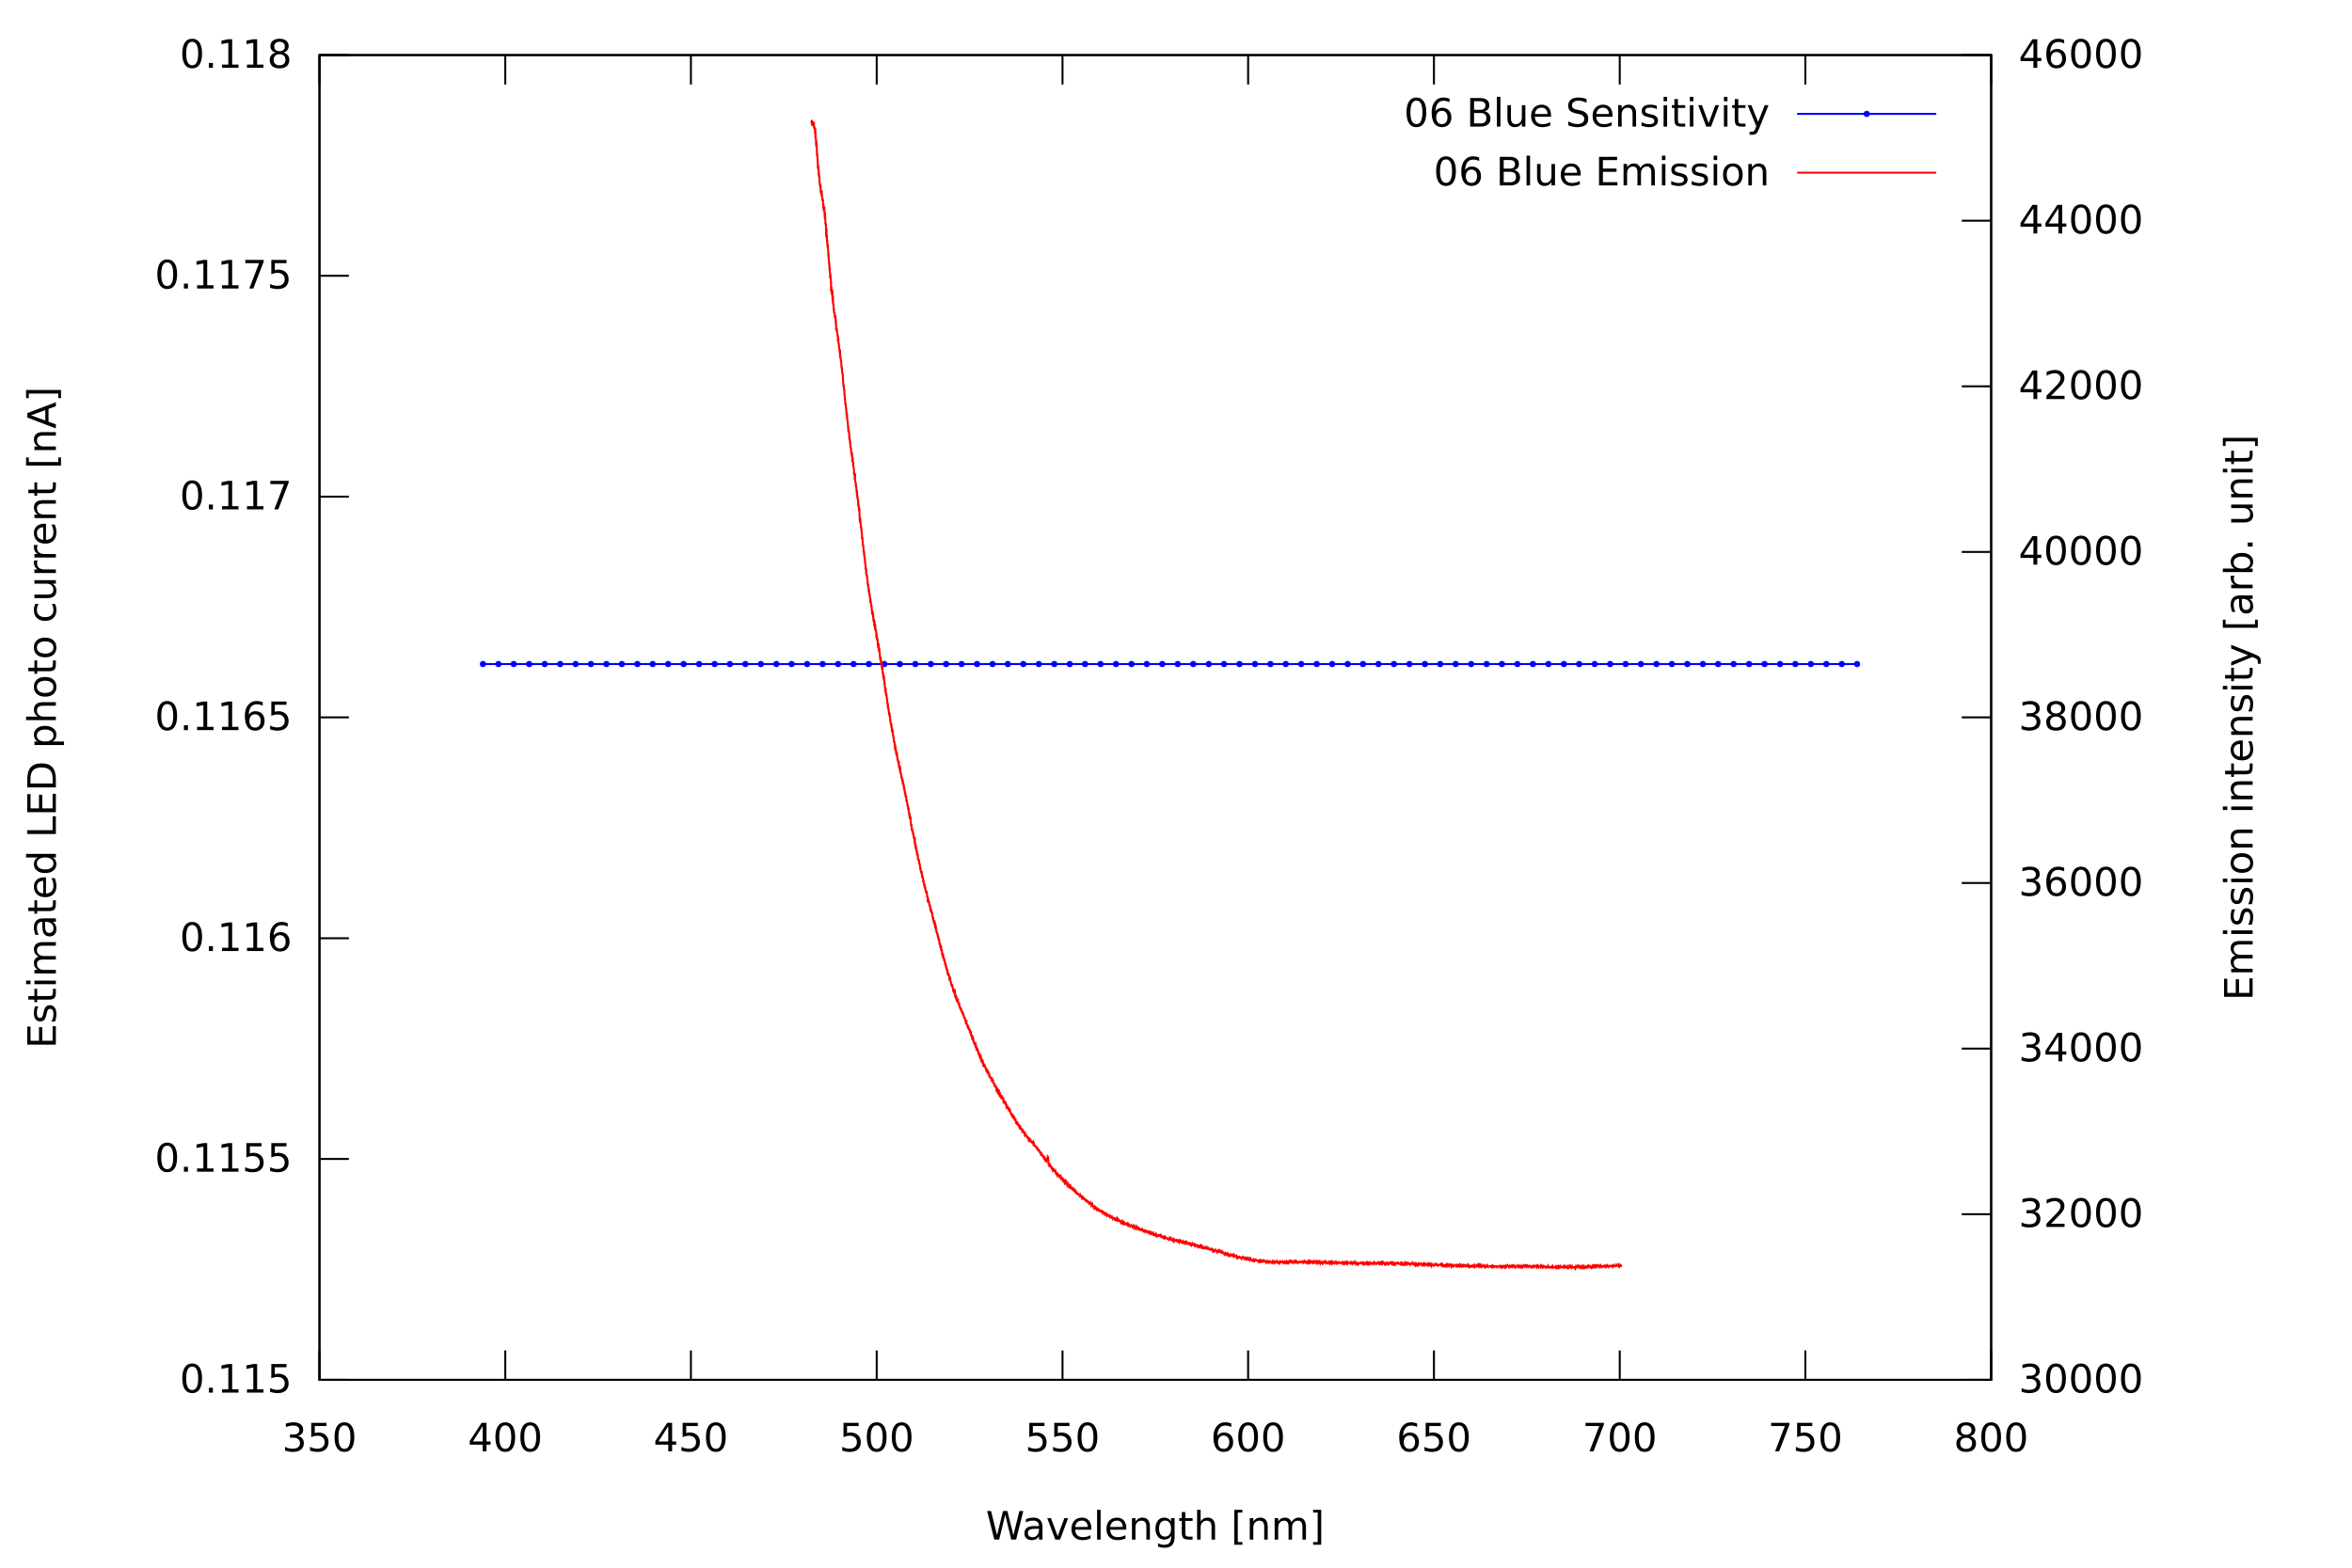
This blue LED was not sensitive enough at all to see any of the monochromator output. Emission spectrum is clipped due to interference filter in spectrometer.
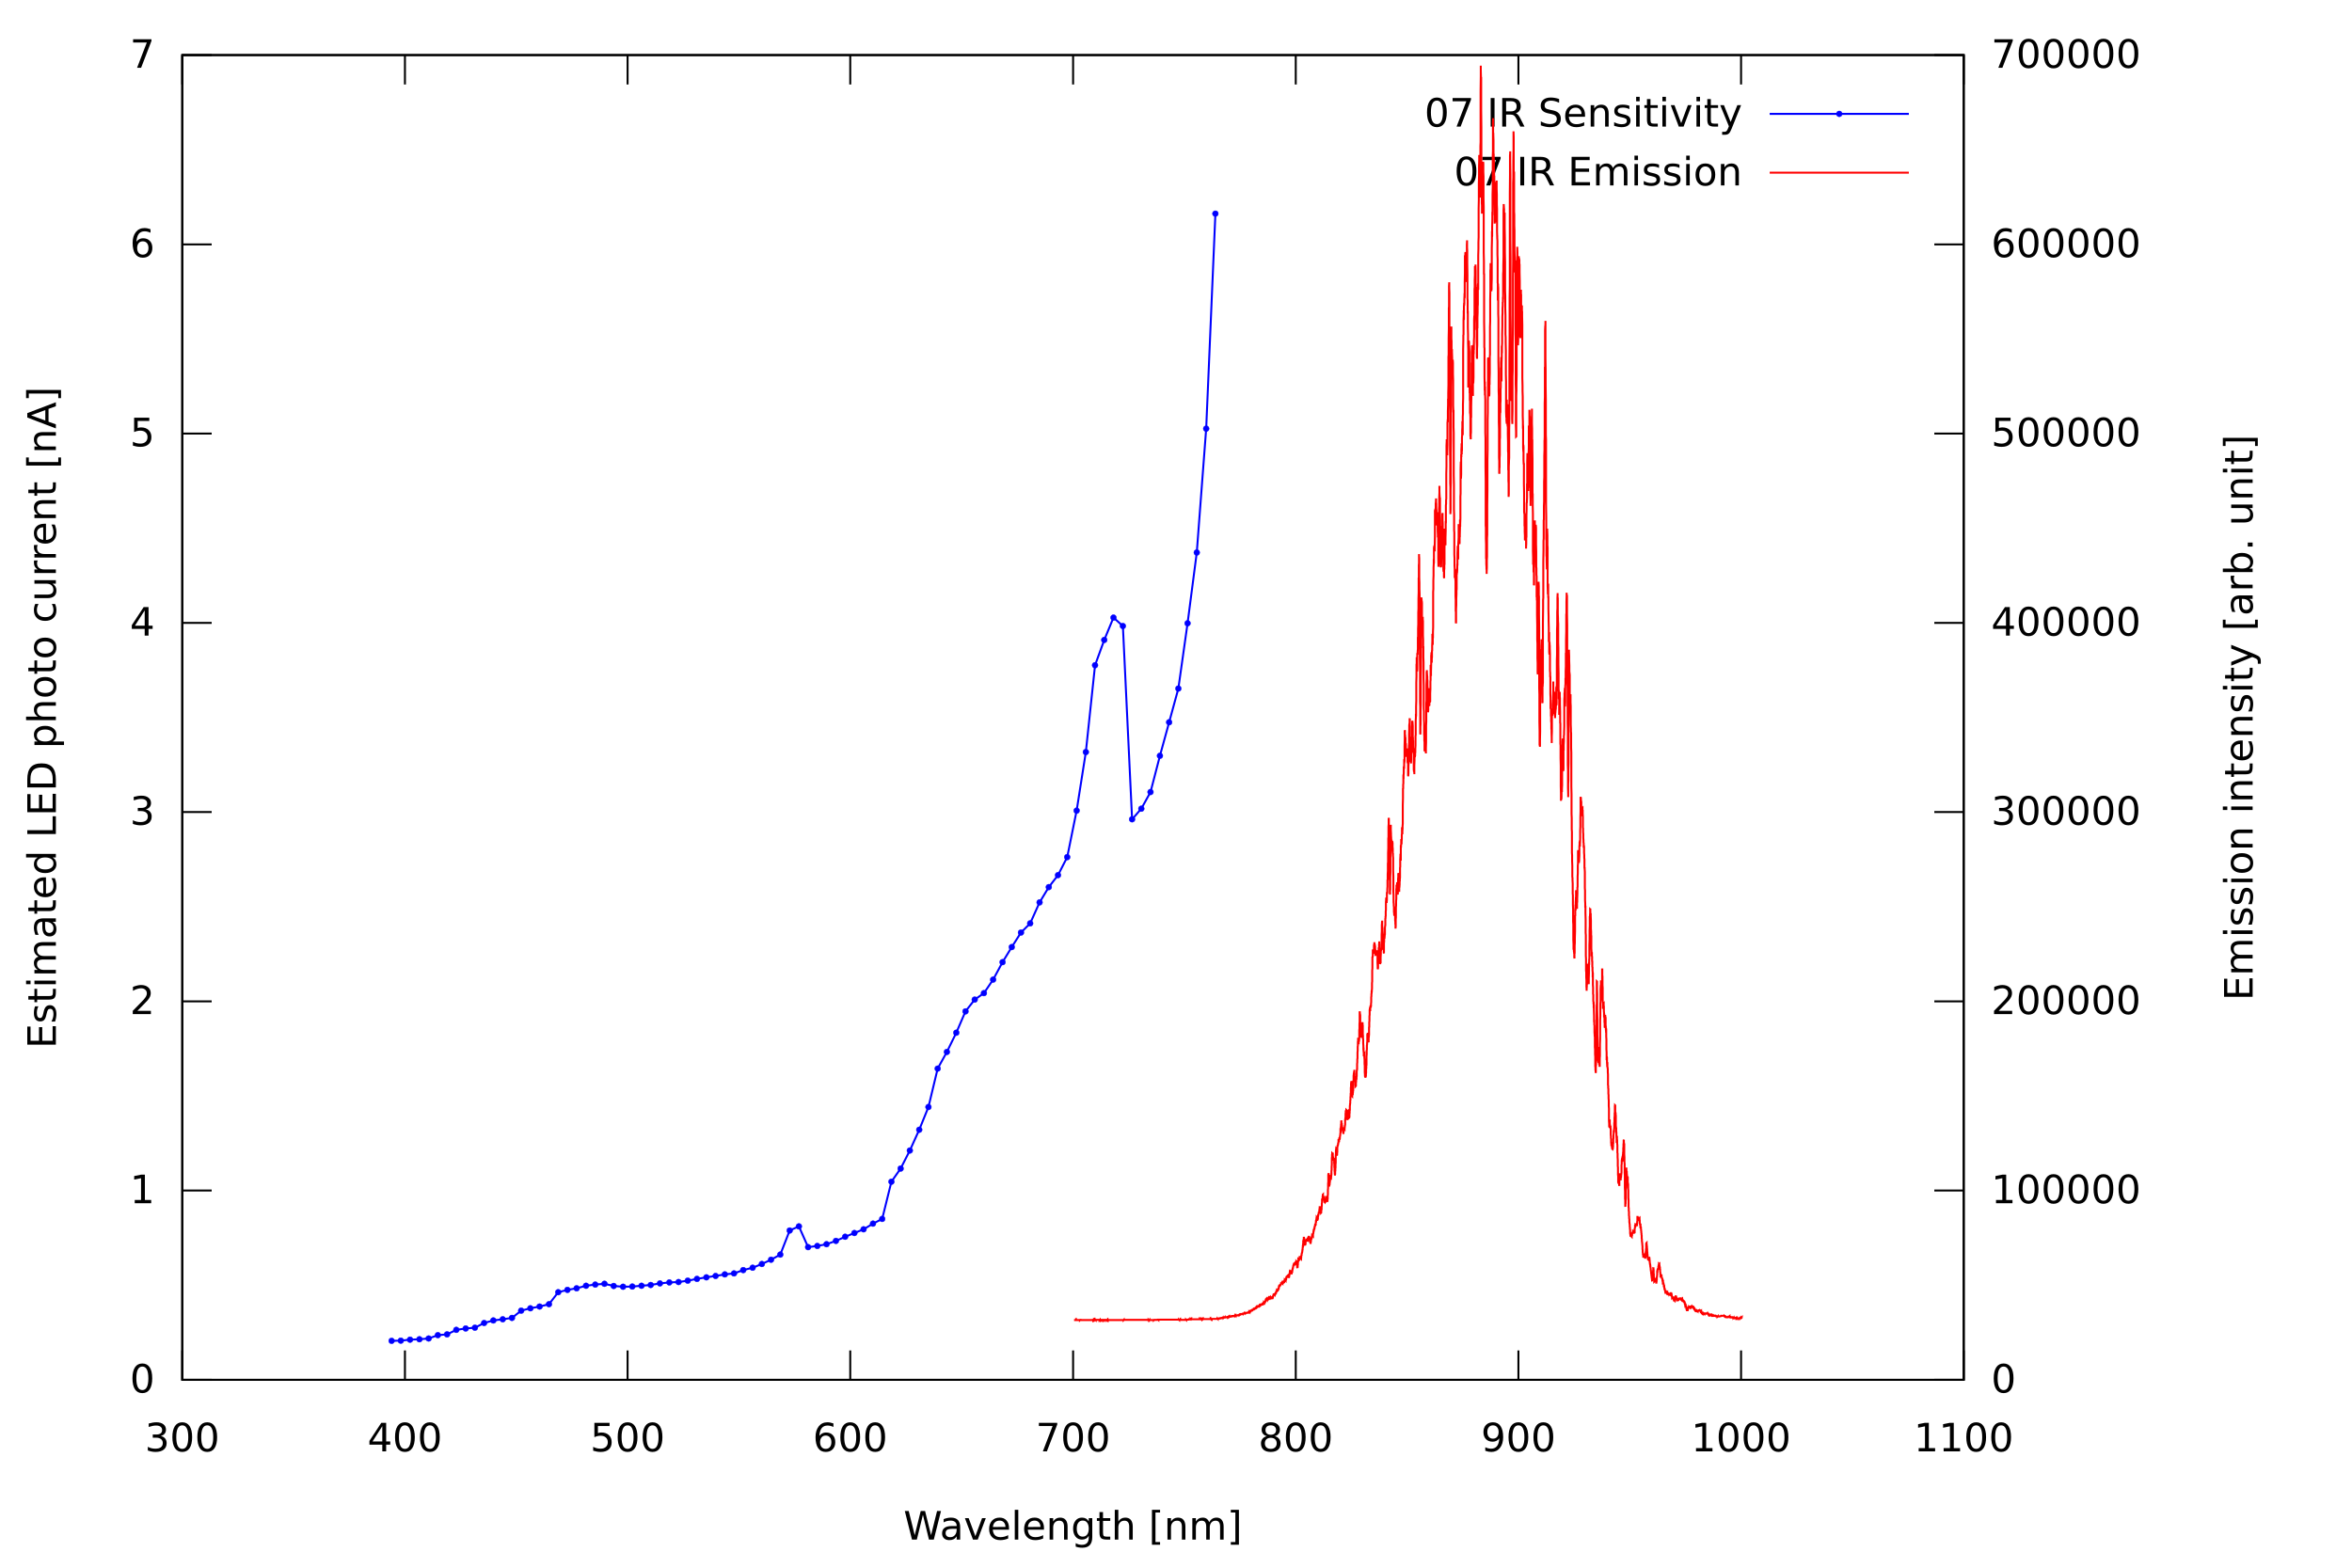
This 880 nm IR LED has a very broad sensitivity, which was clipped due to mechanical limitations of the monochromator.
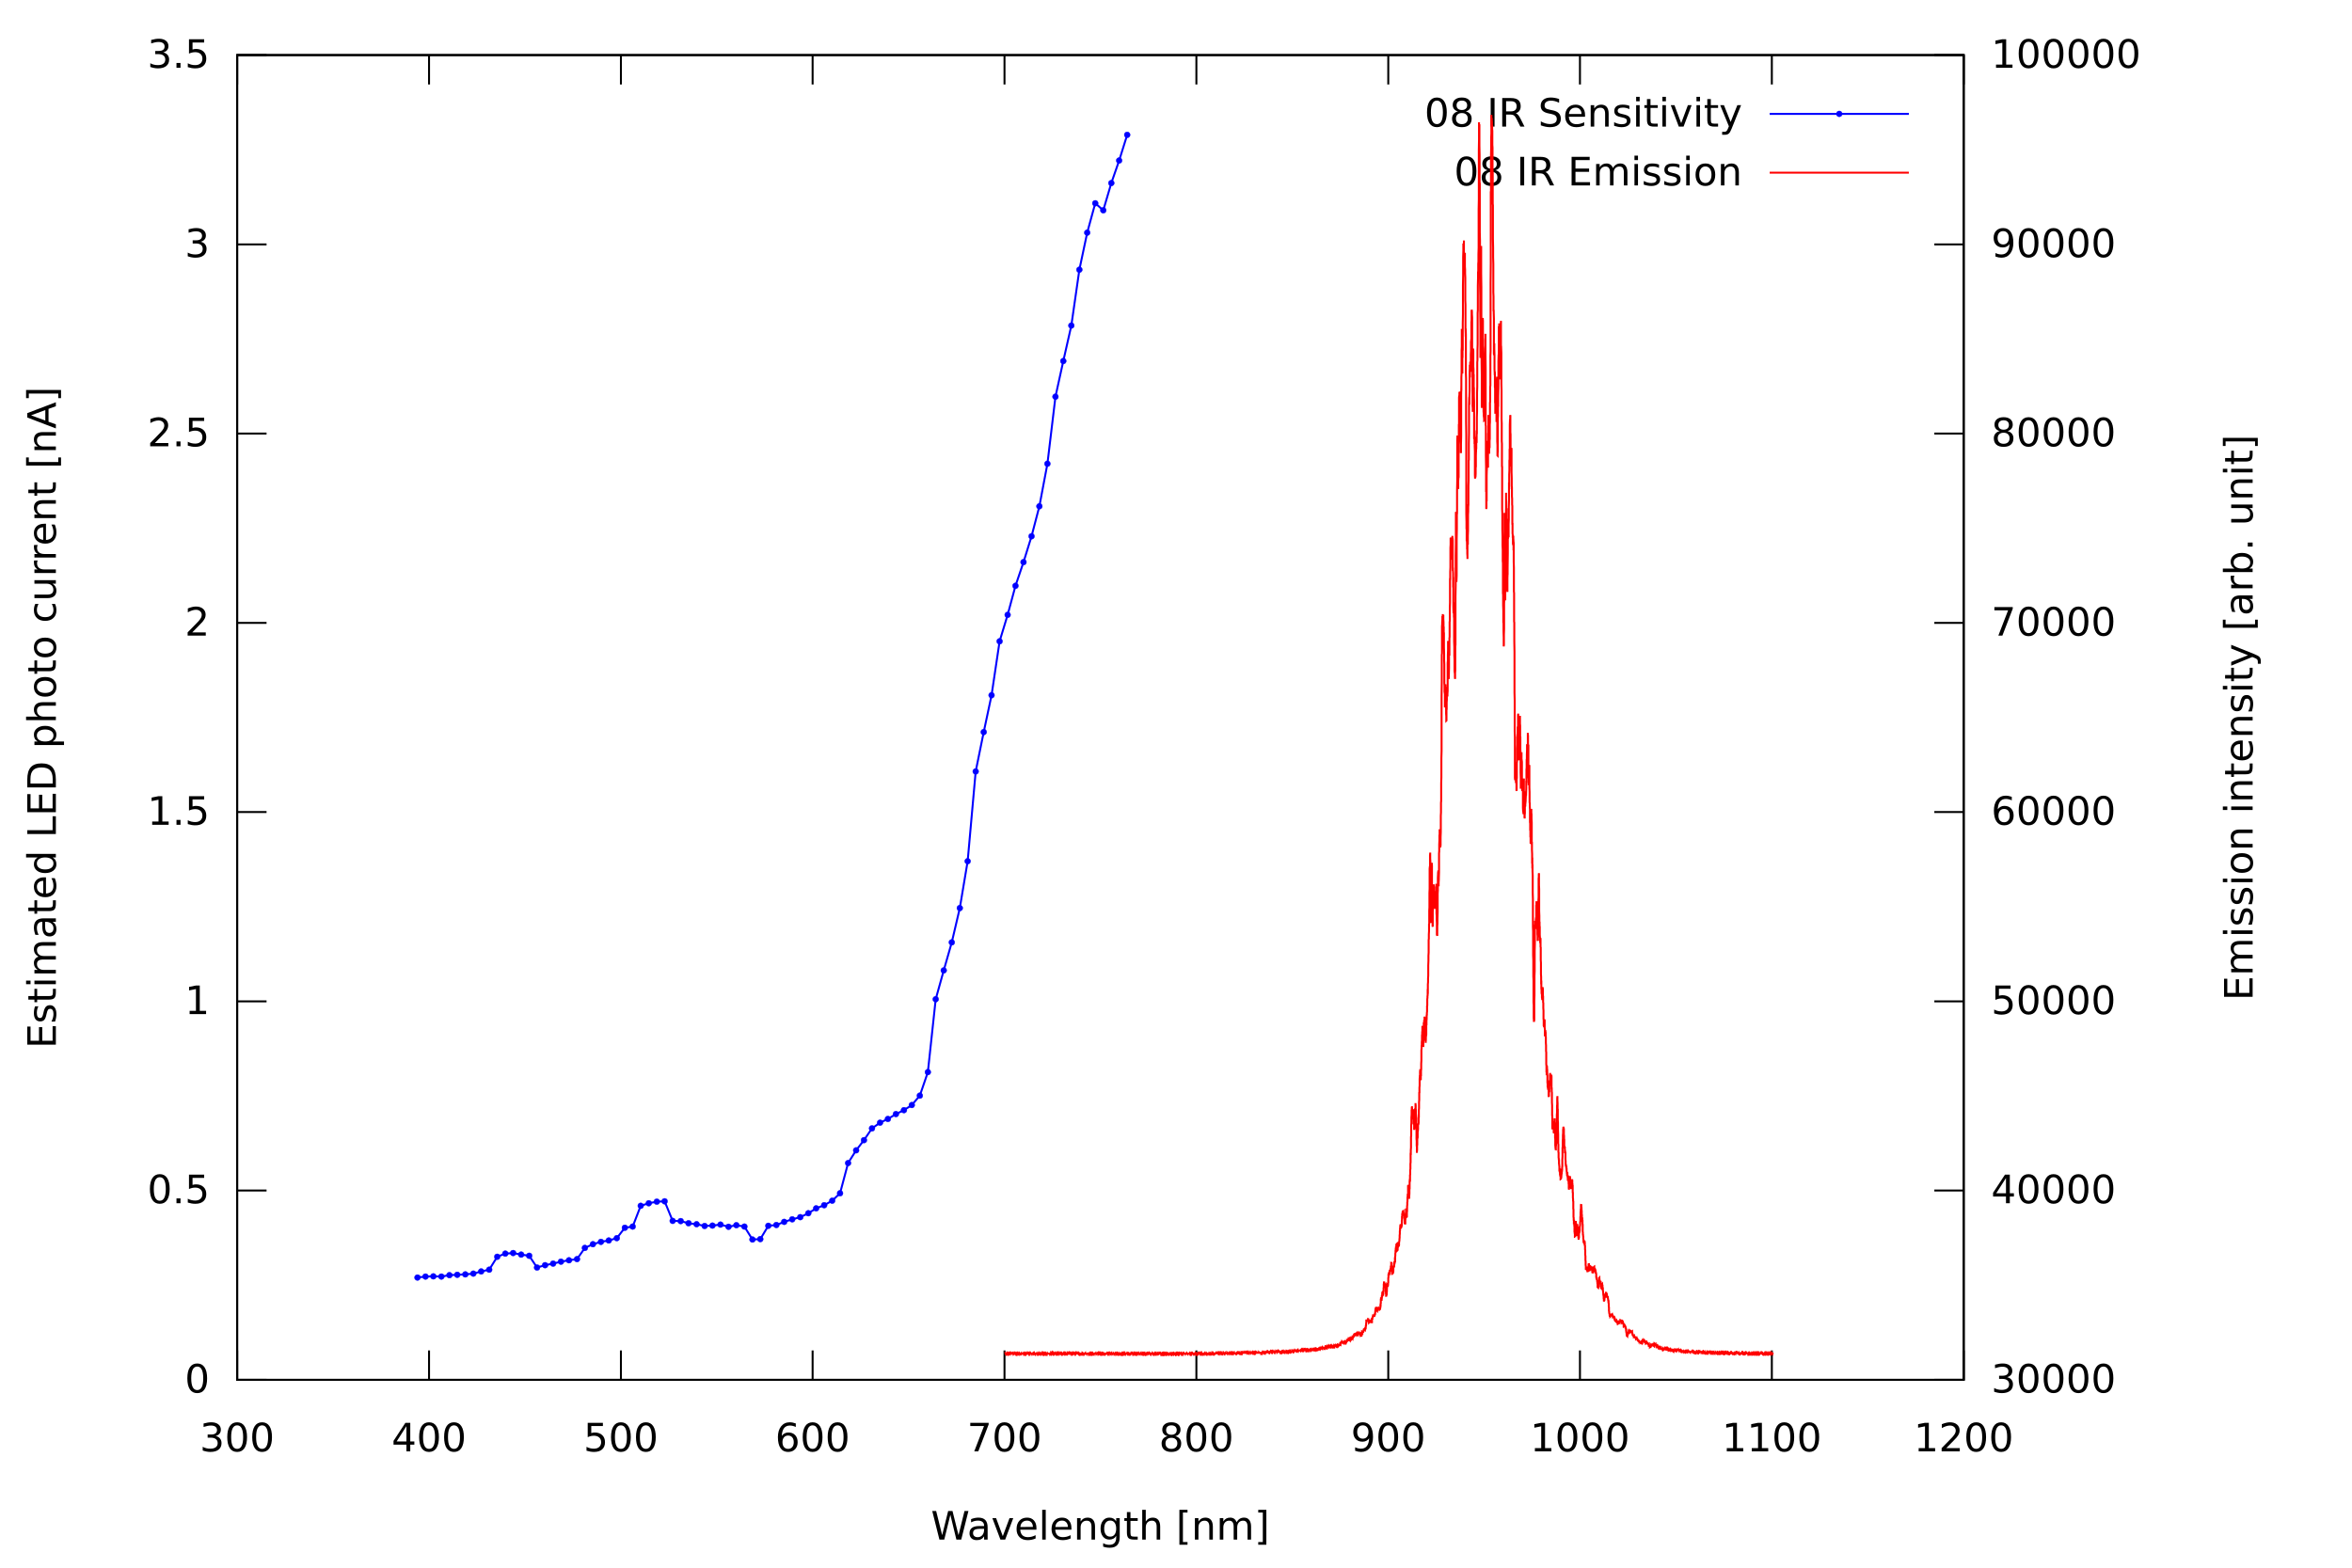
This 940 nm IR LED has a slightly more narrow emission spectrum than the 880 nm one, but shows a broad sensitivity, too, which was also clipped due to mechanical limitations of the monochromator.
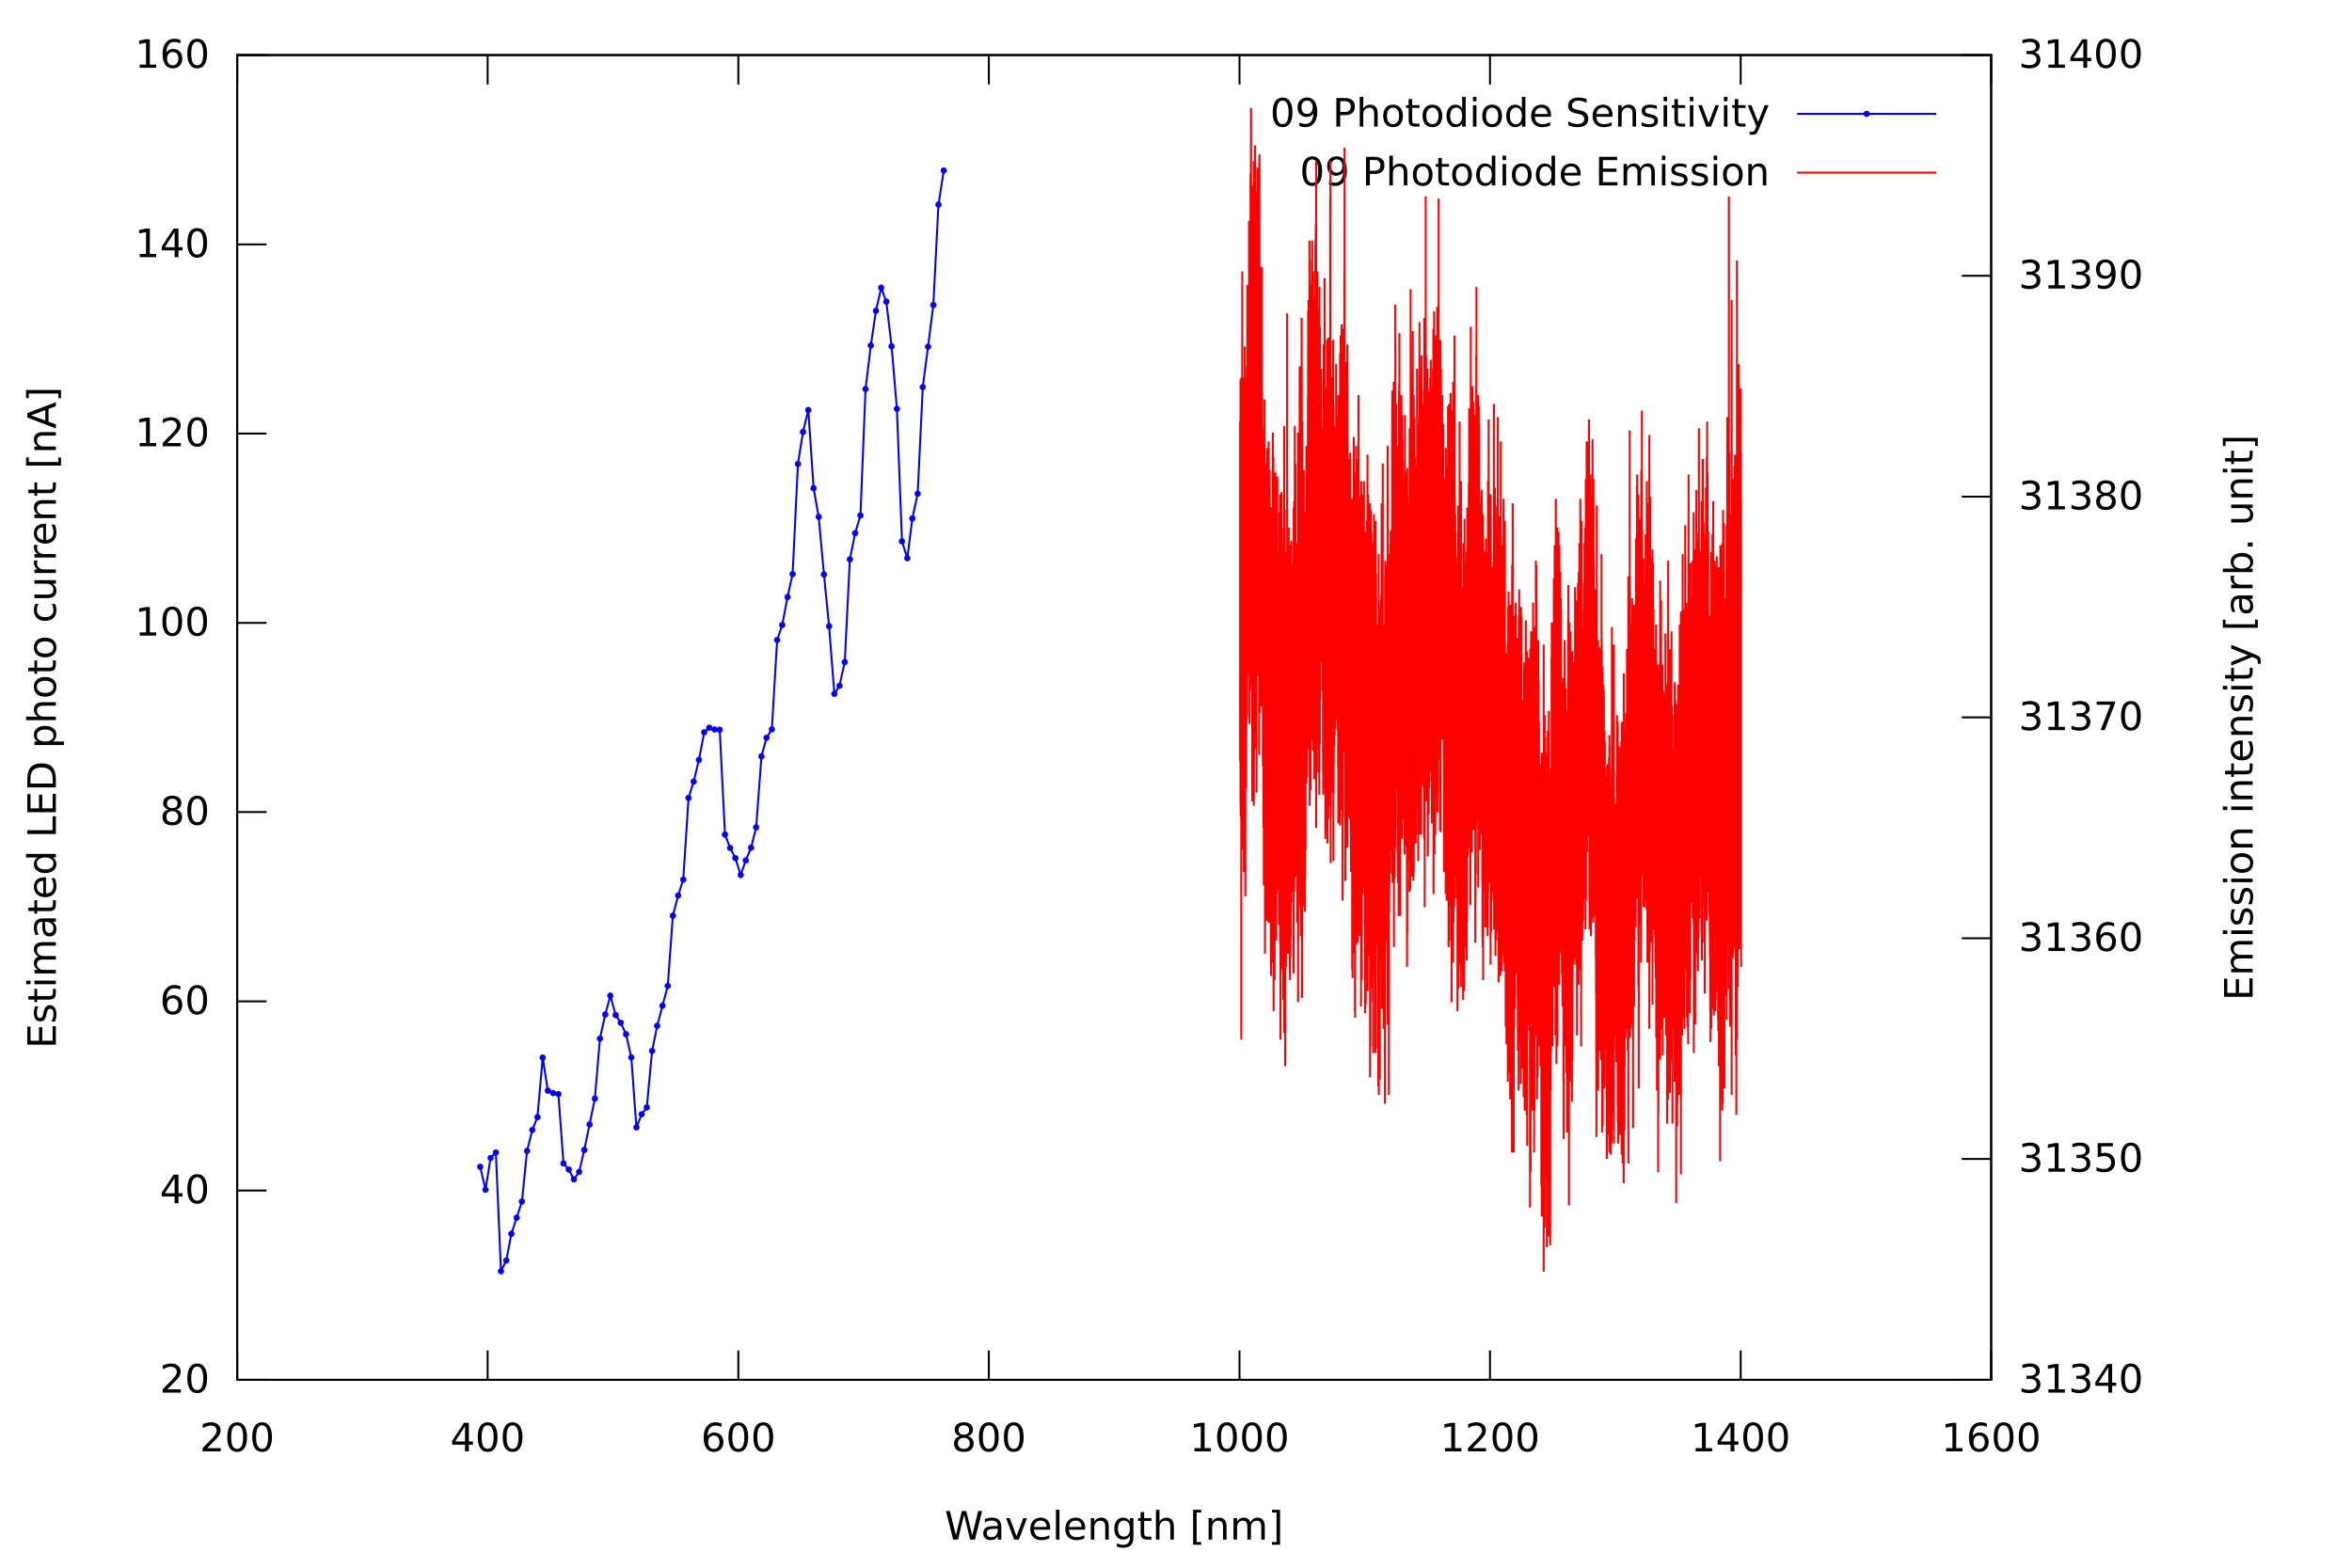
Photodiodes are designed to be sensitive for the whole visible range, therefore, we get a lot of response for the whole spectrum covered by the monochromator. The rise towards longer wavelengths is due to the sensitivity curve, but also due to the shape of blackbody radiation from the halogen lamp used as light source. No emission spectrum could be recorded, because either the photodiode does not emit a lot of light, or because the spectrometer itself uses a green-blazed grating in combination with a silicon based CCD camera, resulting in very low sensitivity in this wavelength range.
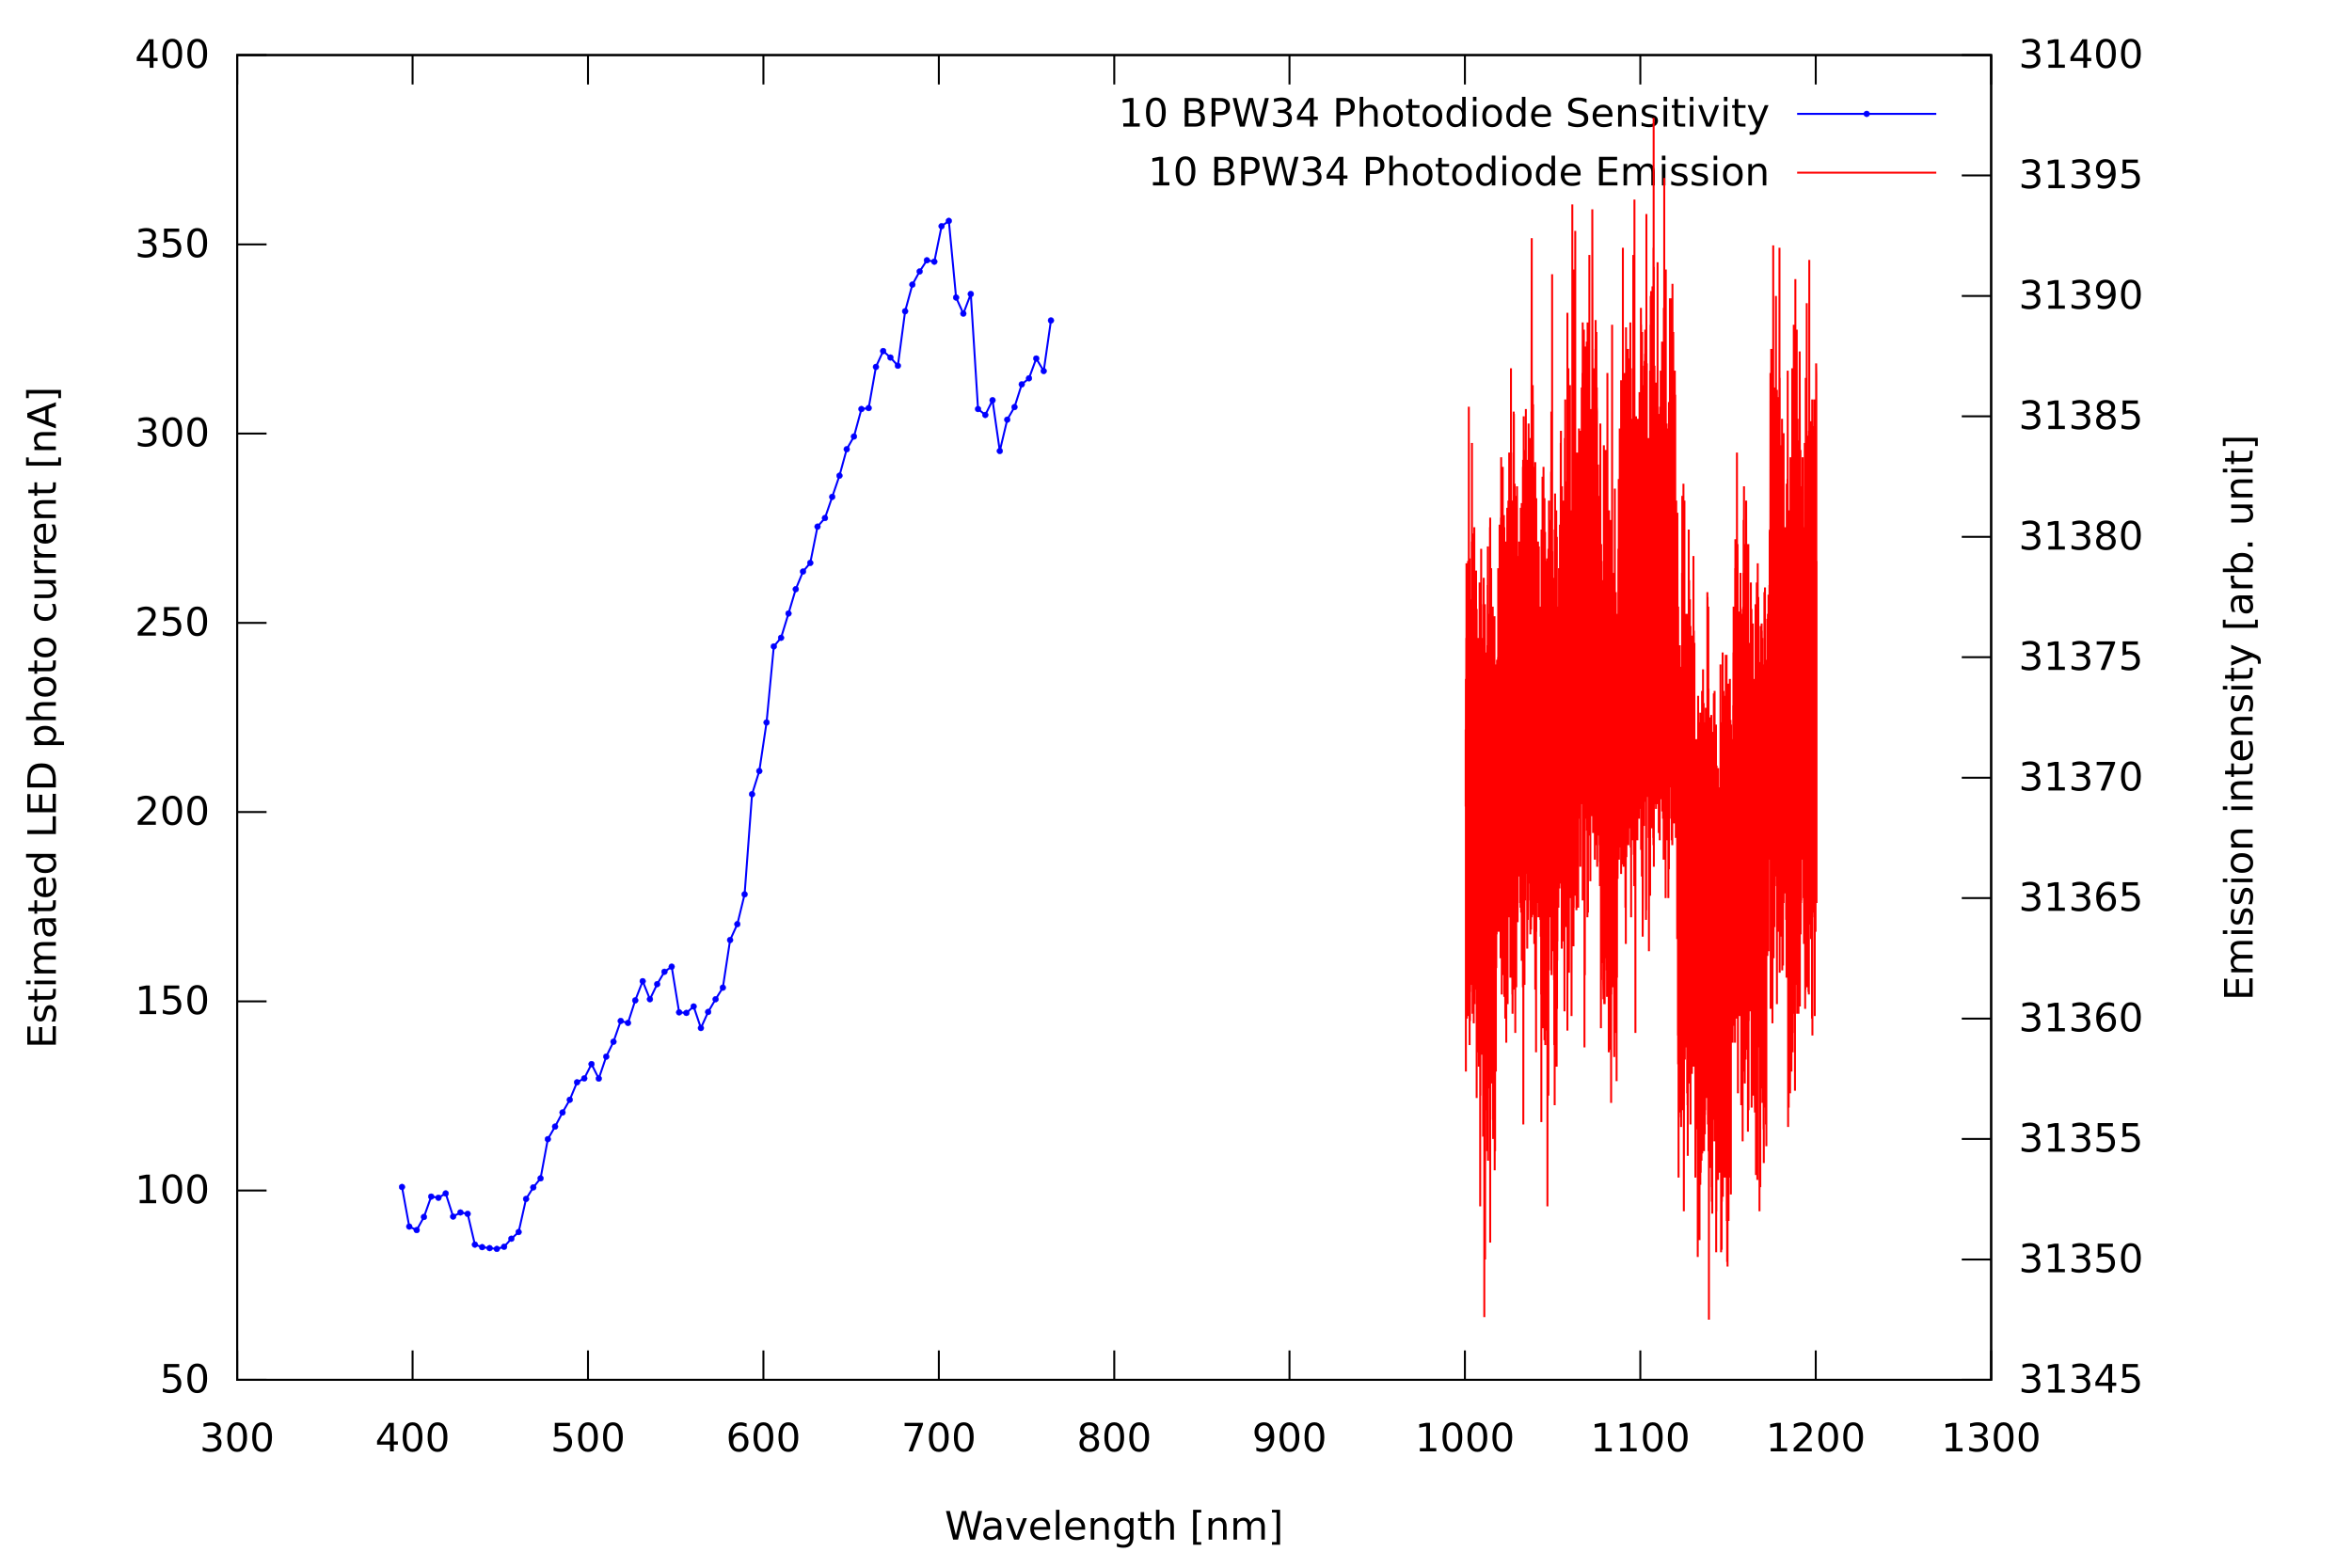
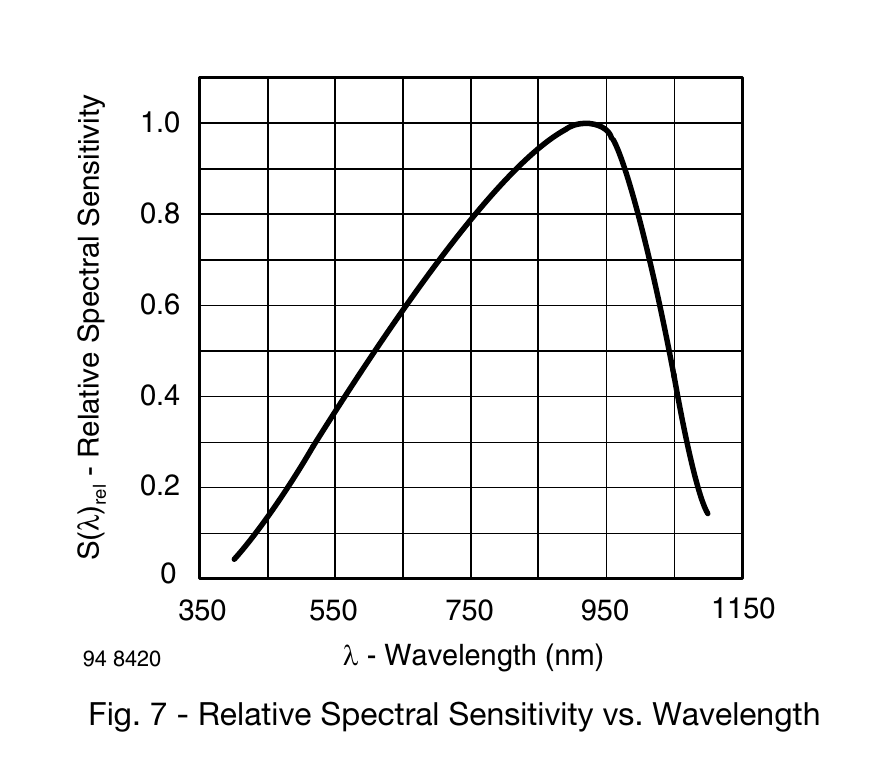
This is a known BPW34 photodiode, again showing great sensitivity to all wavelengths available at the monochromator output. For comparison, the sensitivity curve taken from the BPW34 datasheet:
The shape looks comparable. However, I cannot distinguish the blackbody properties of the halogen lamp from the sensitivity shape with this simple experiment.
Now on to the clear LEDs:
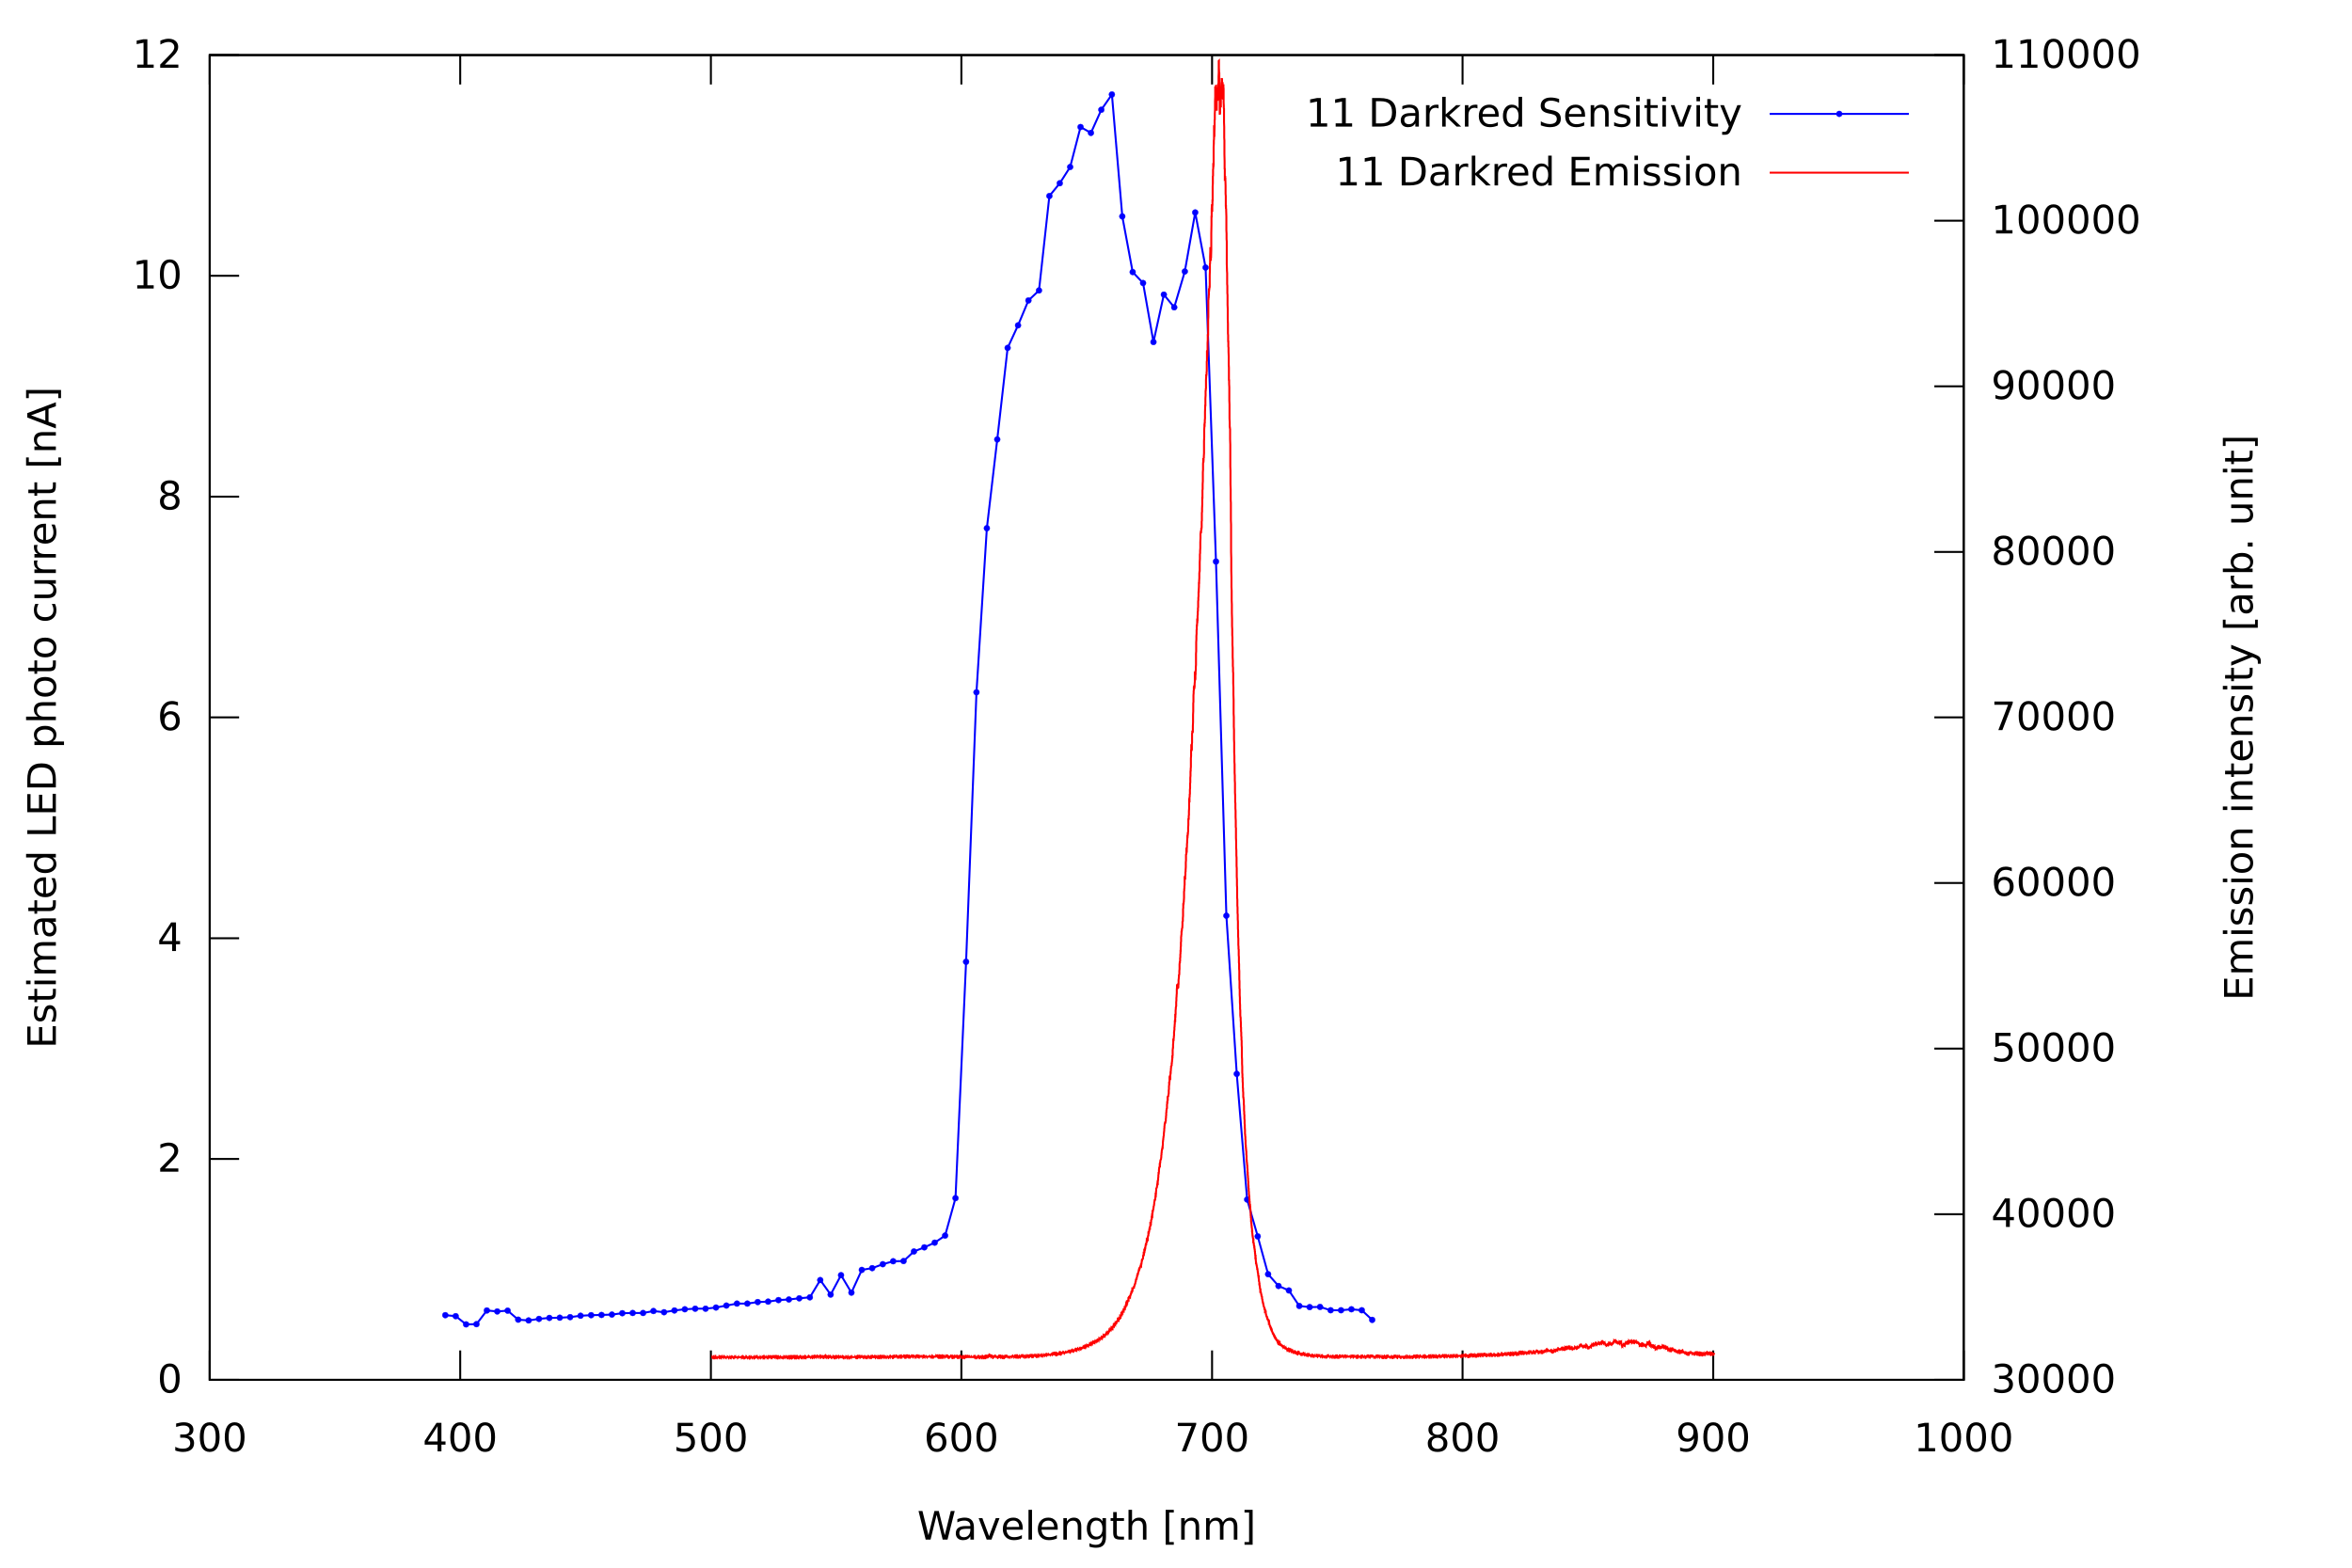
This darkred LED behaves as expected.
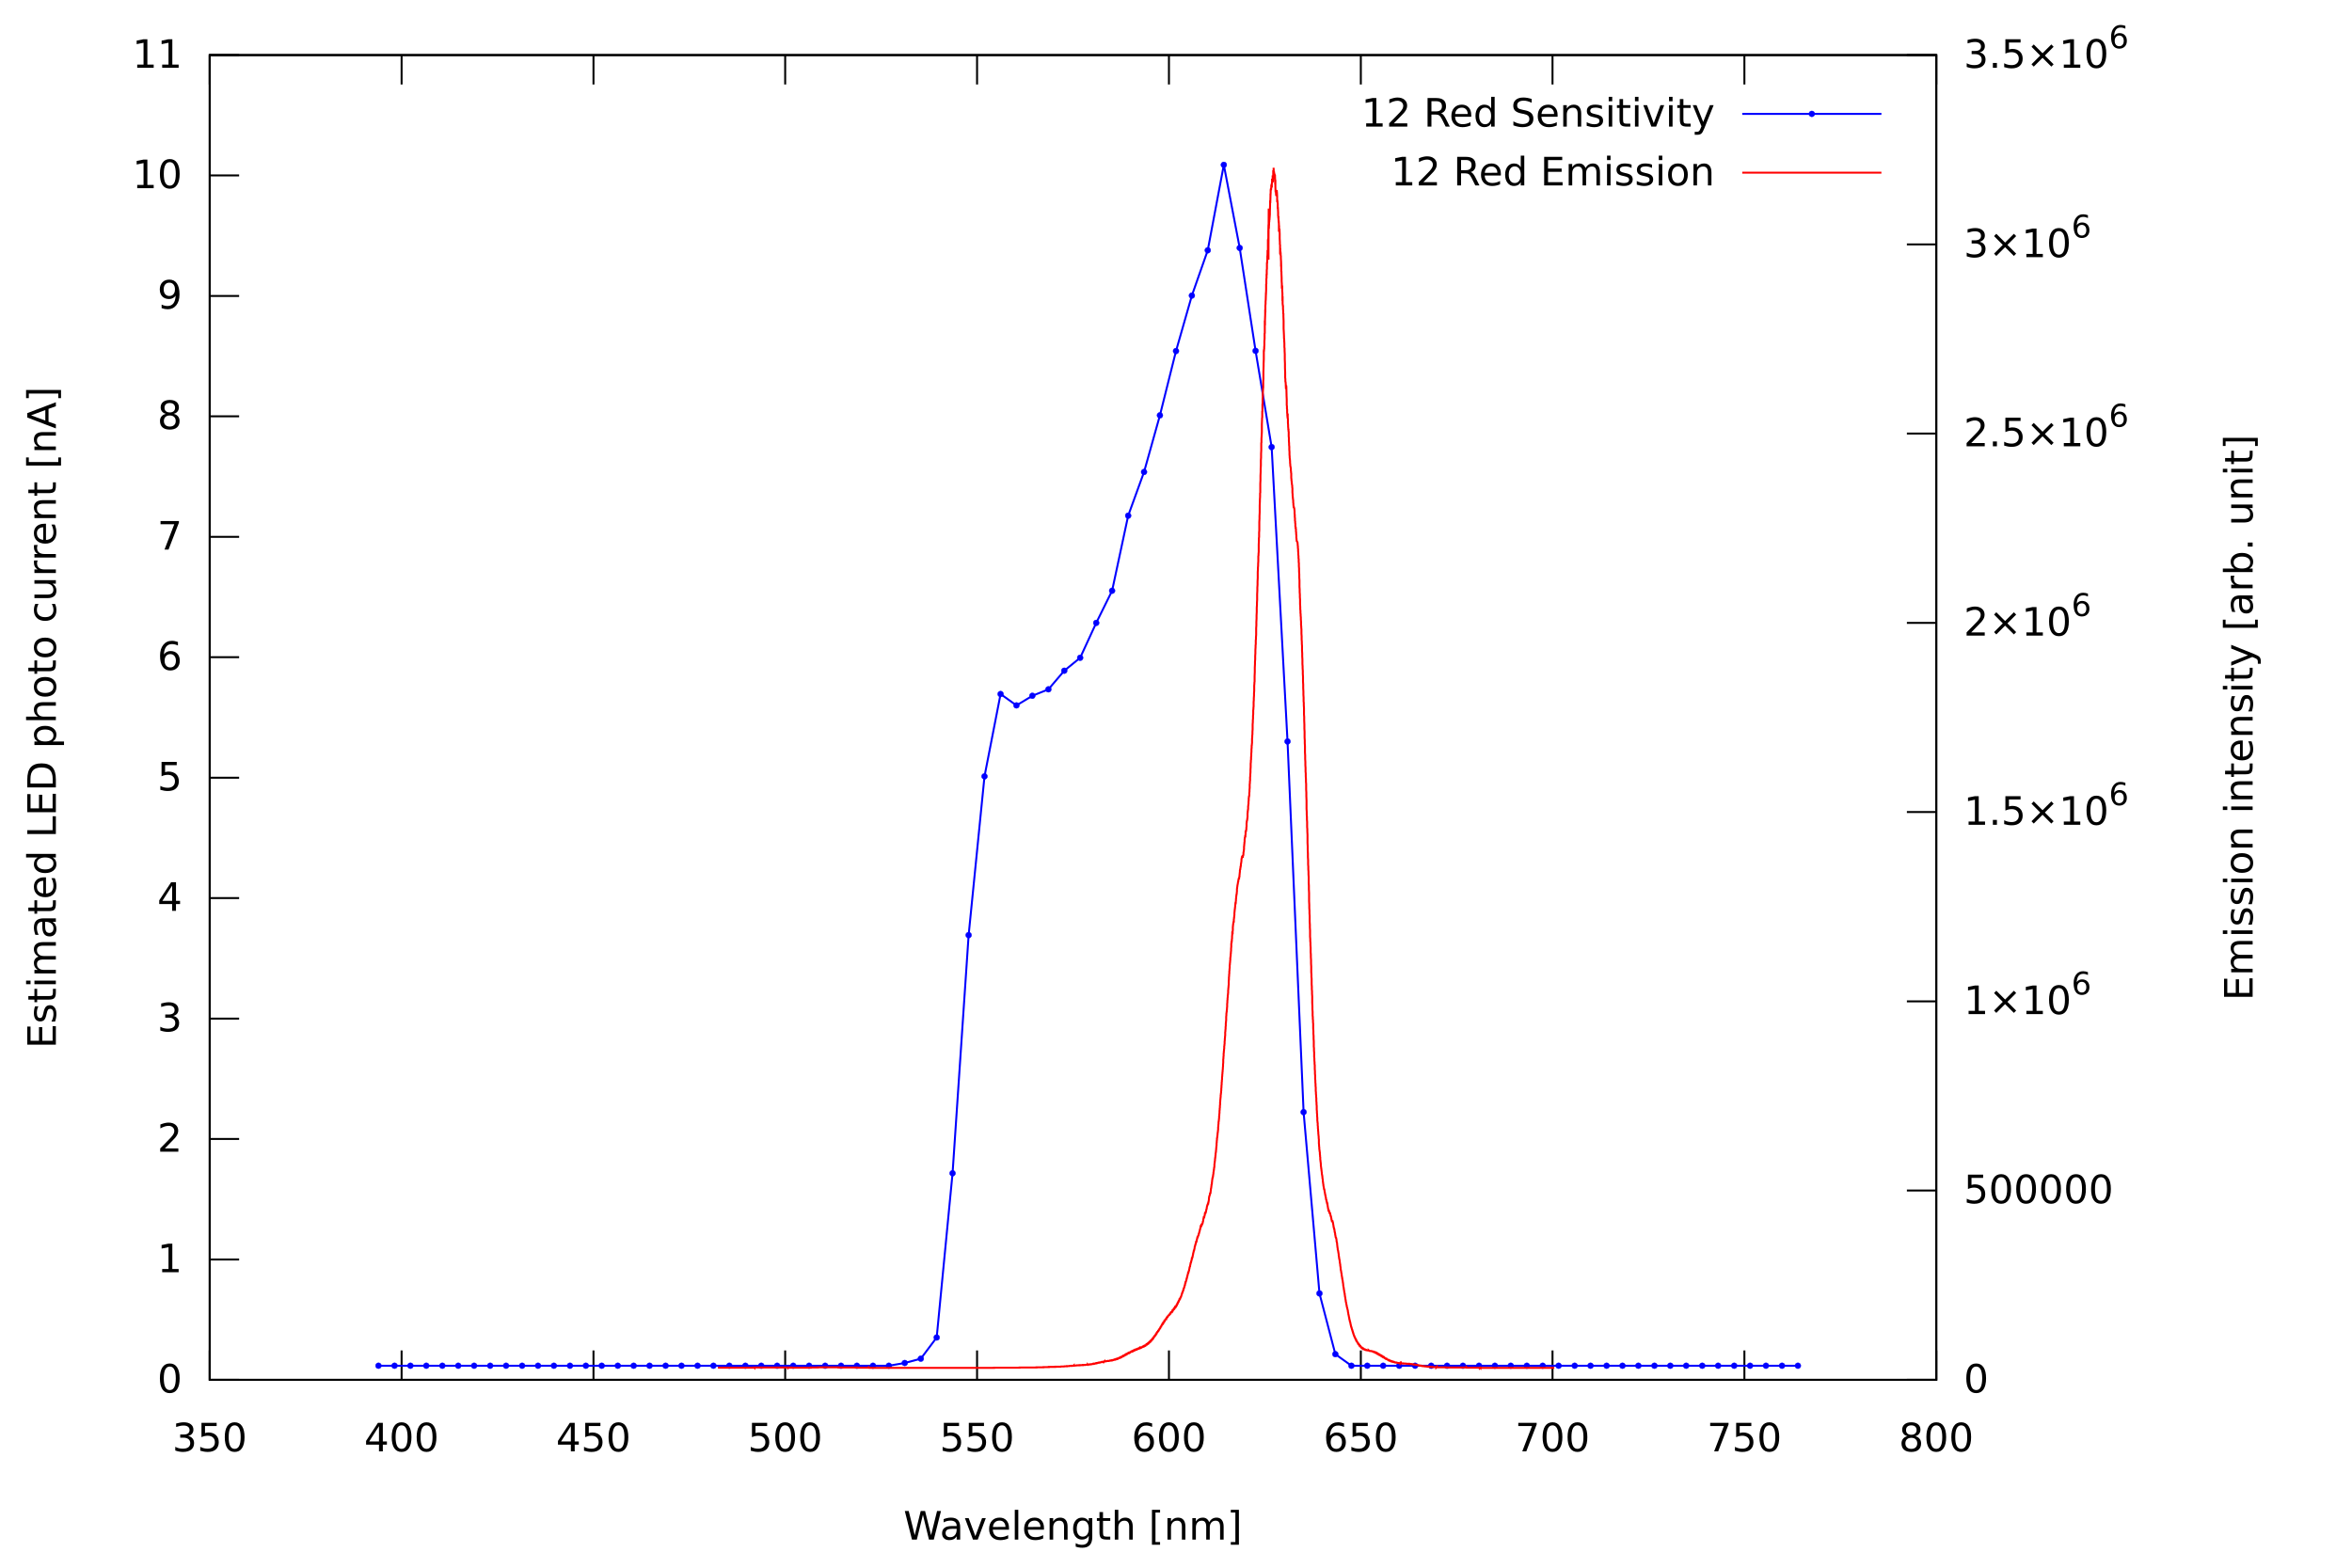
This red LED behaves as expected.
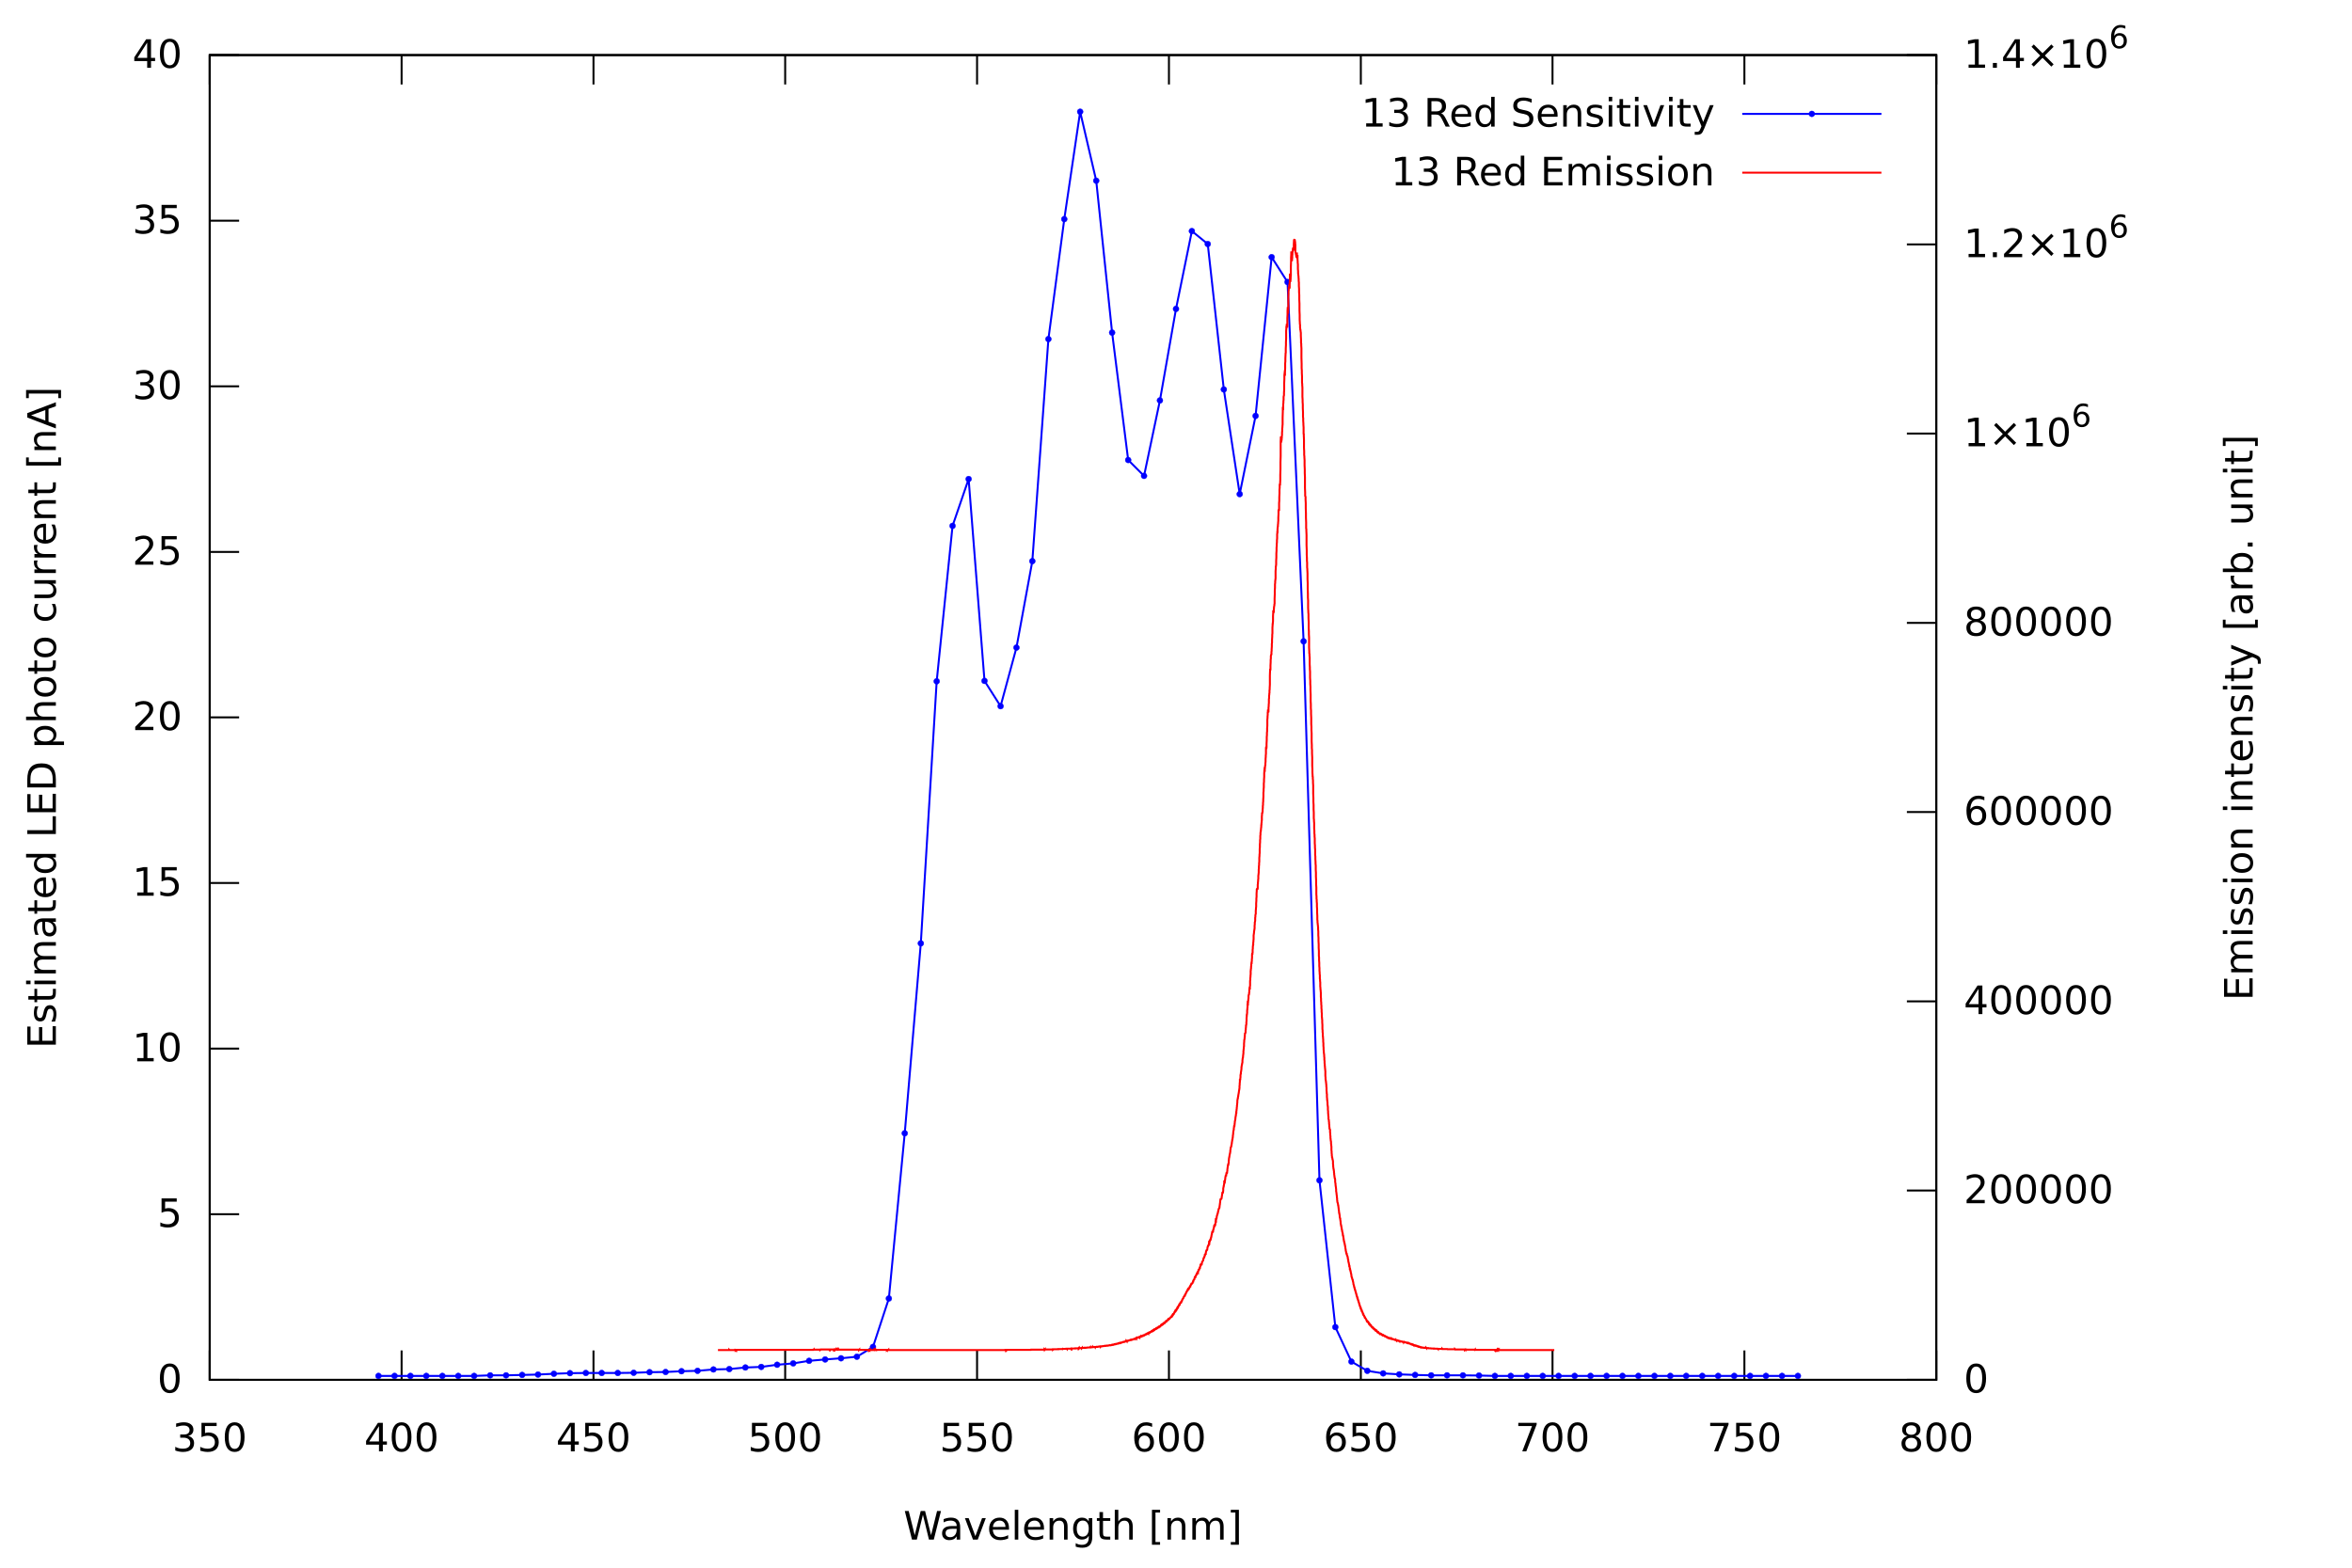
This red LED shows an interesting pattern in the sensitivity curve which I have no explanation for yet, but otherwise behaves as expected.
Chaotic hypothesis: Note that these interesting shapes seem to occur with photo currents above of 10 nA only, corresponding with short junction discharge times. As the halogen lamp is mains AC driven, the flicker of the illumination source could be responsible for this.
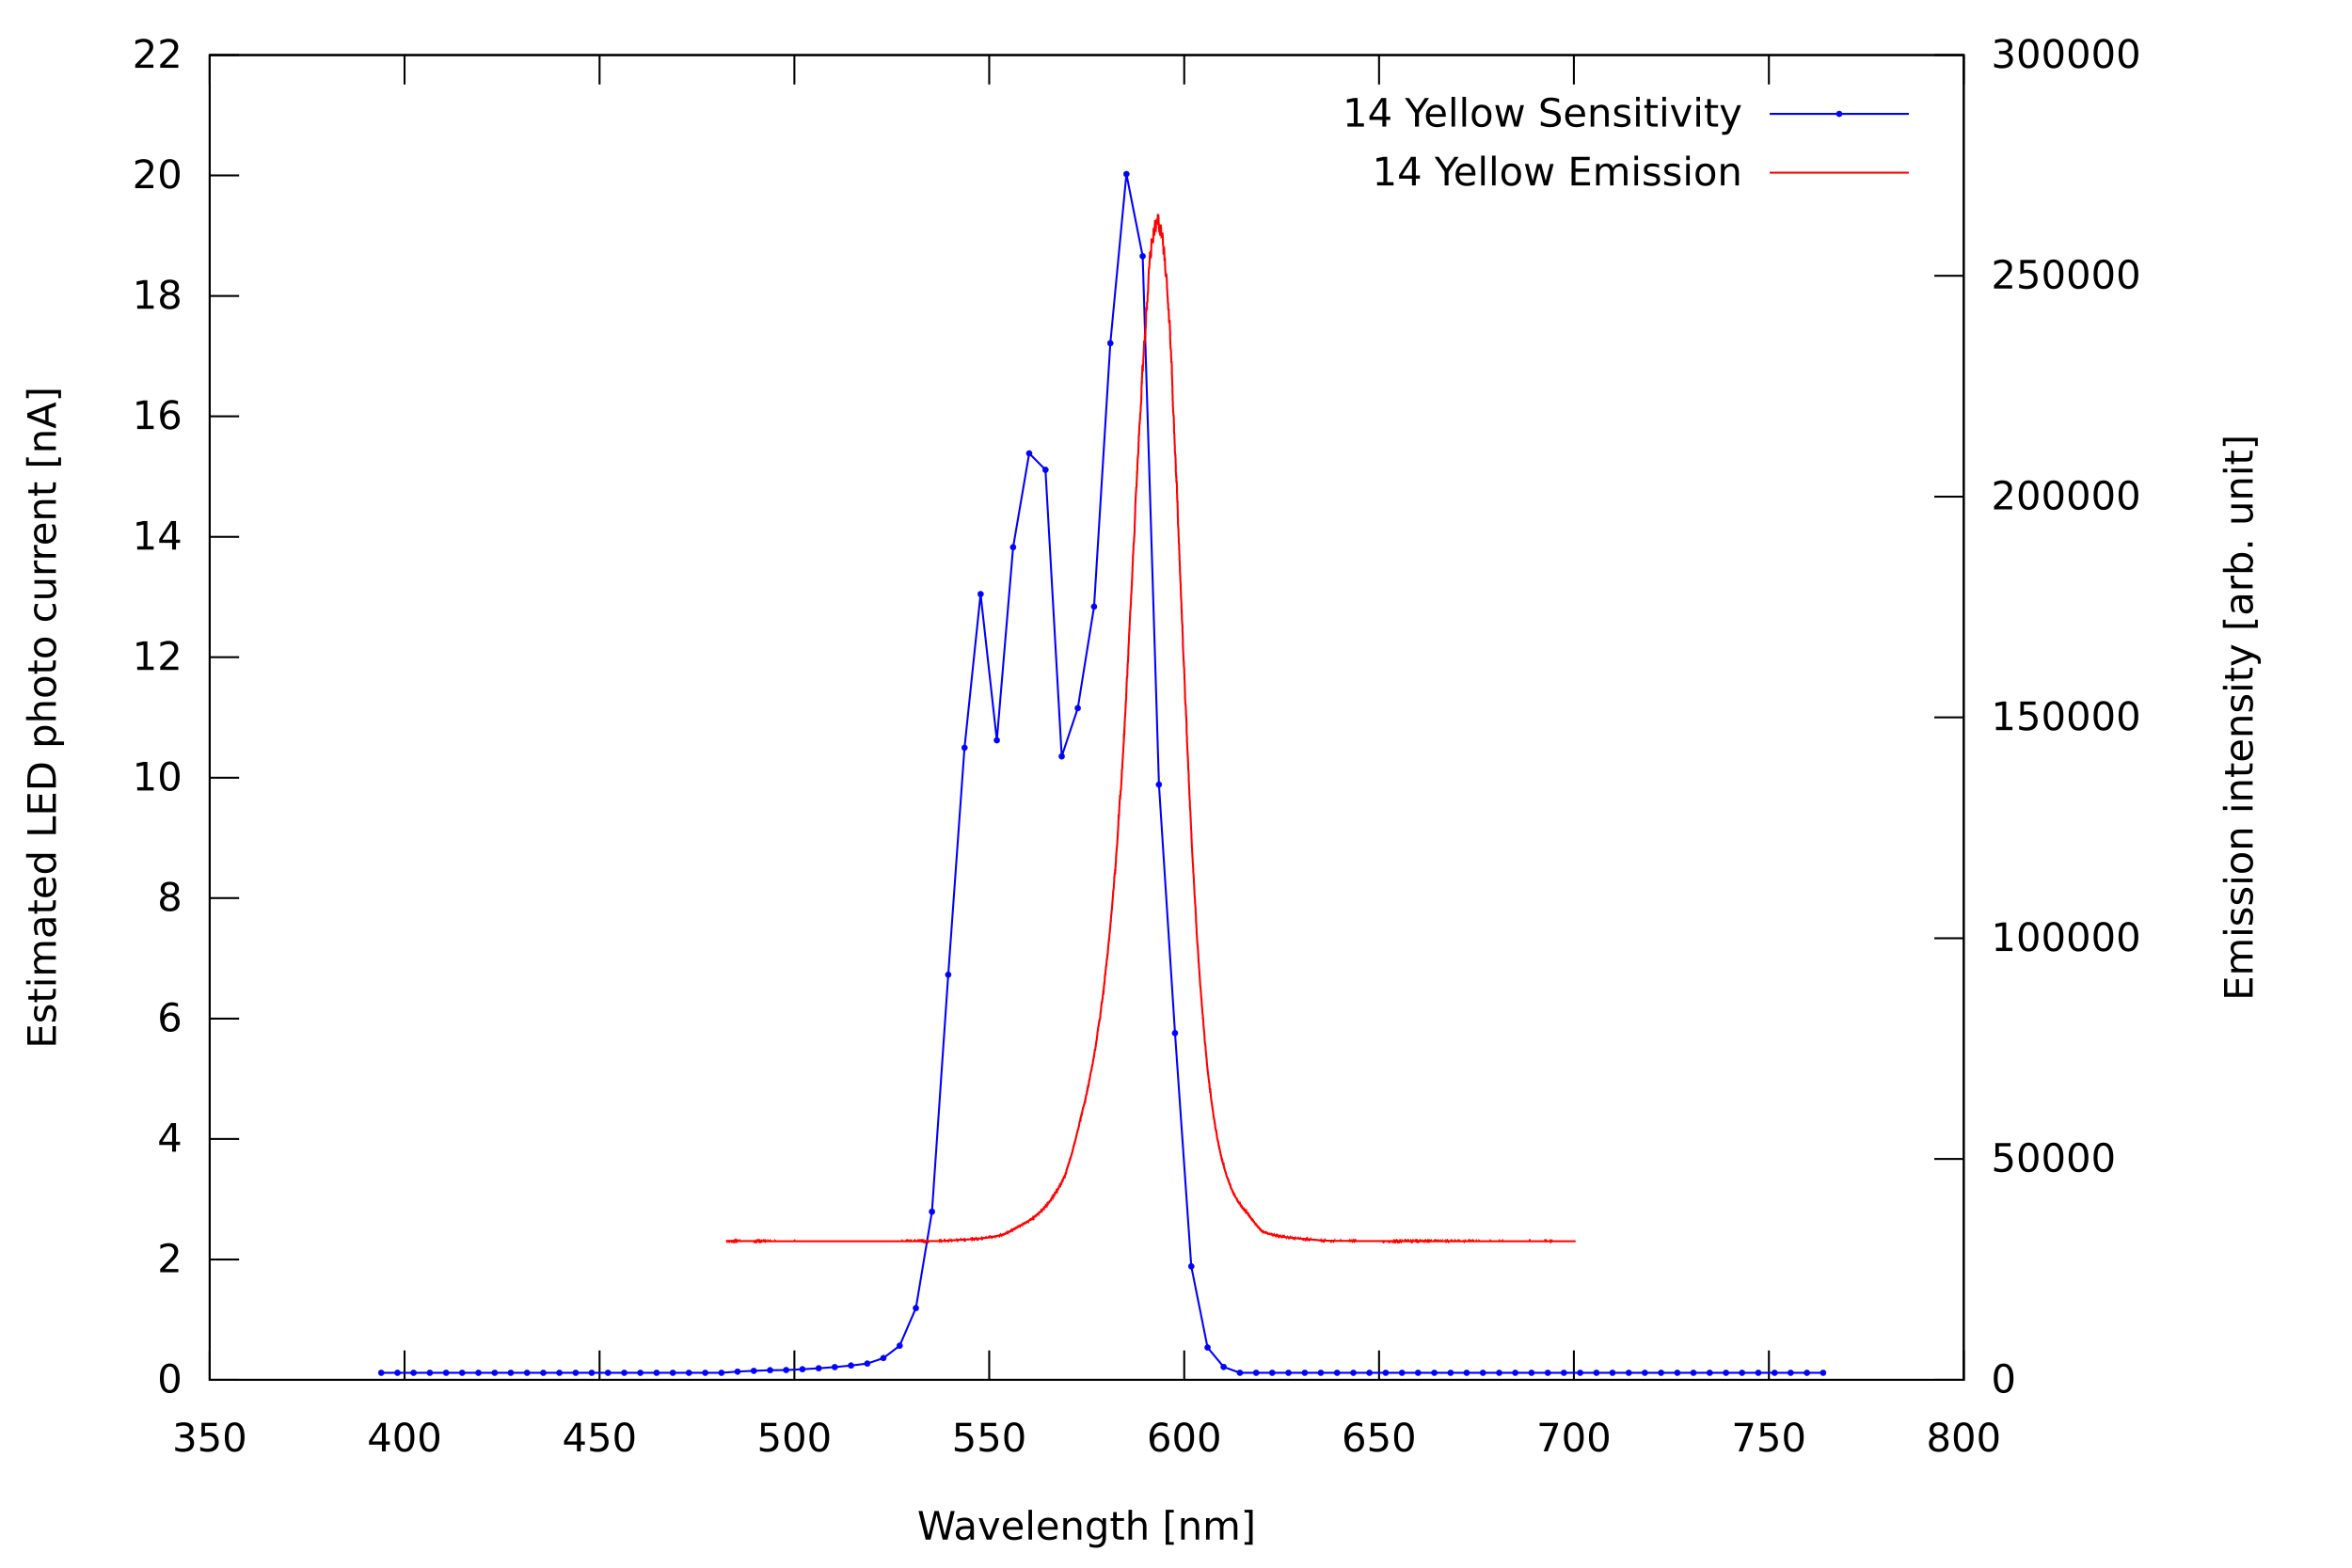
This yellow LED behaves as expected.
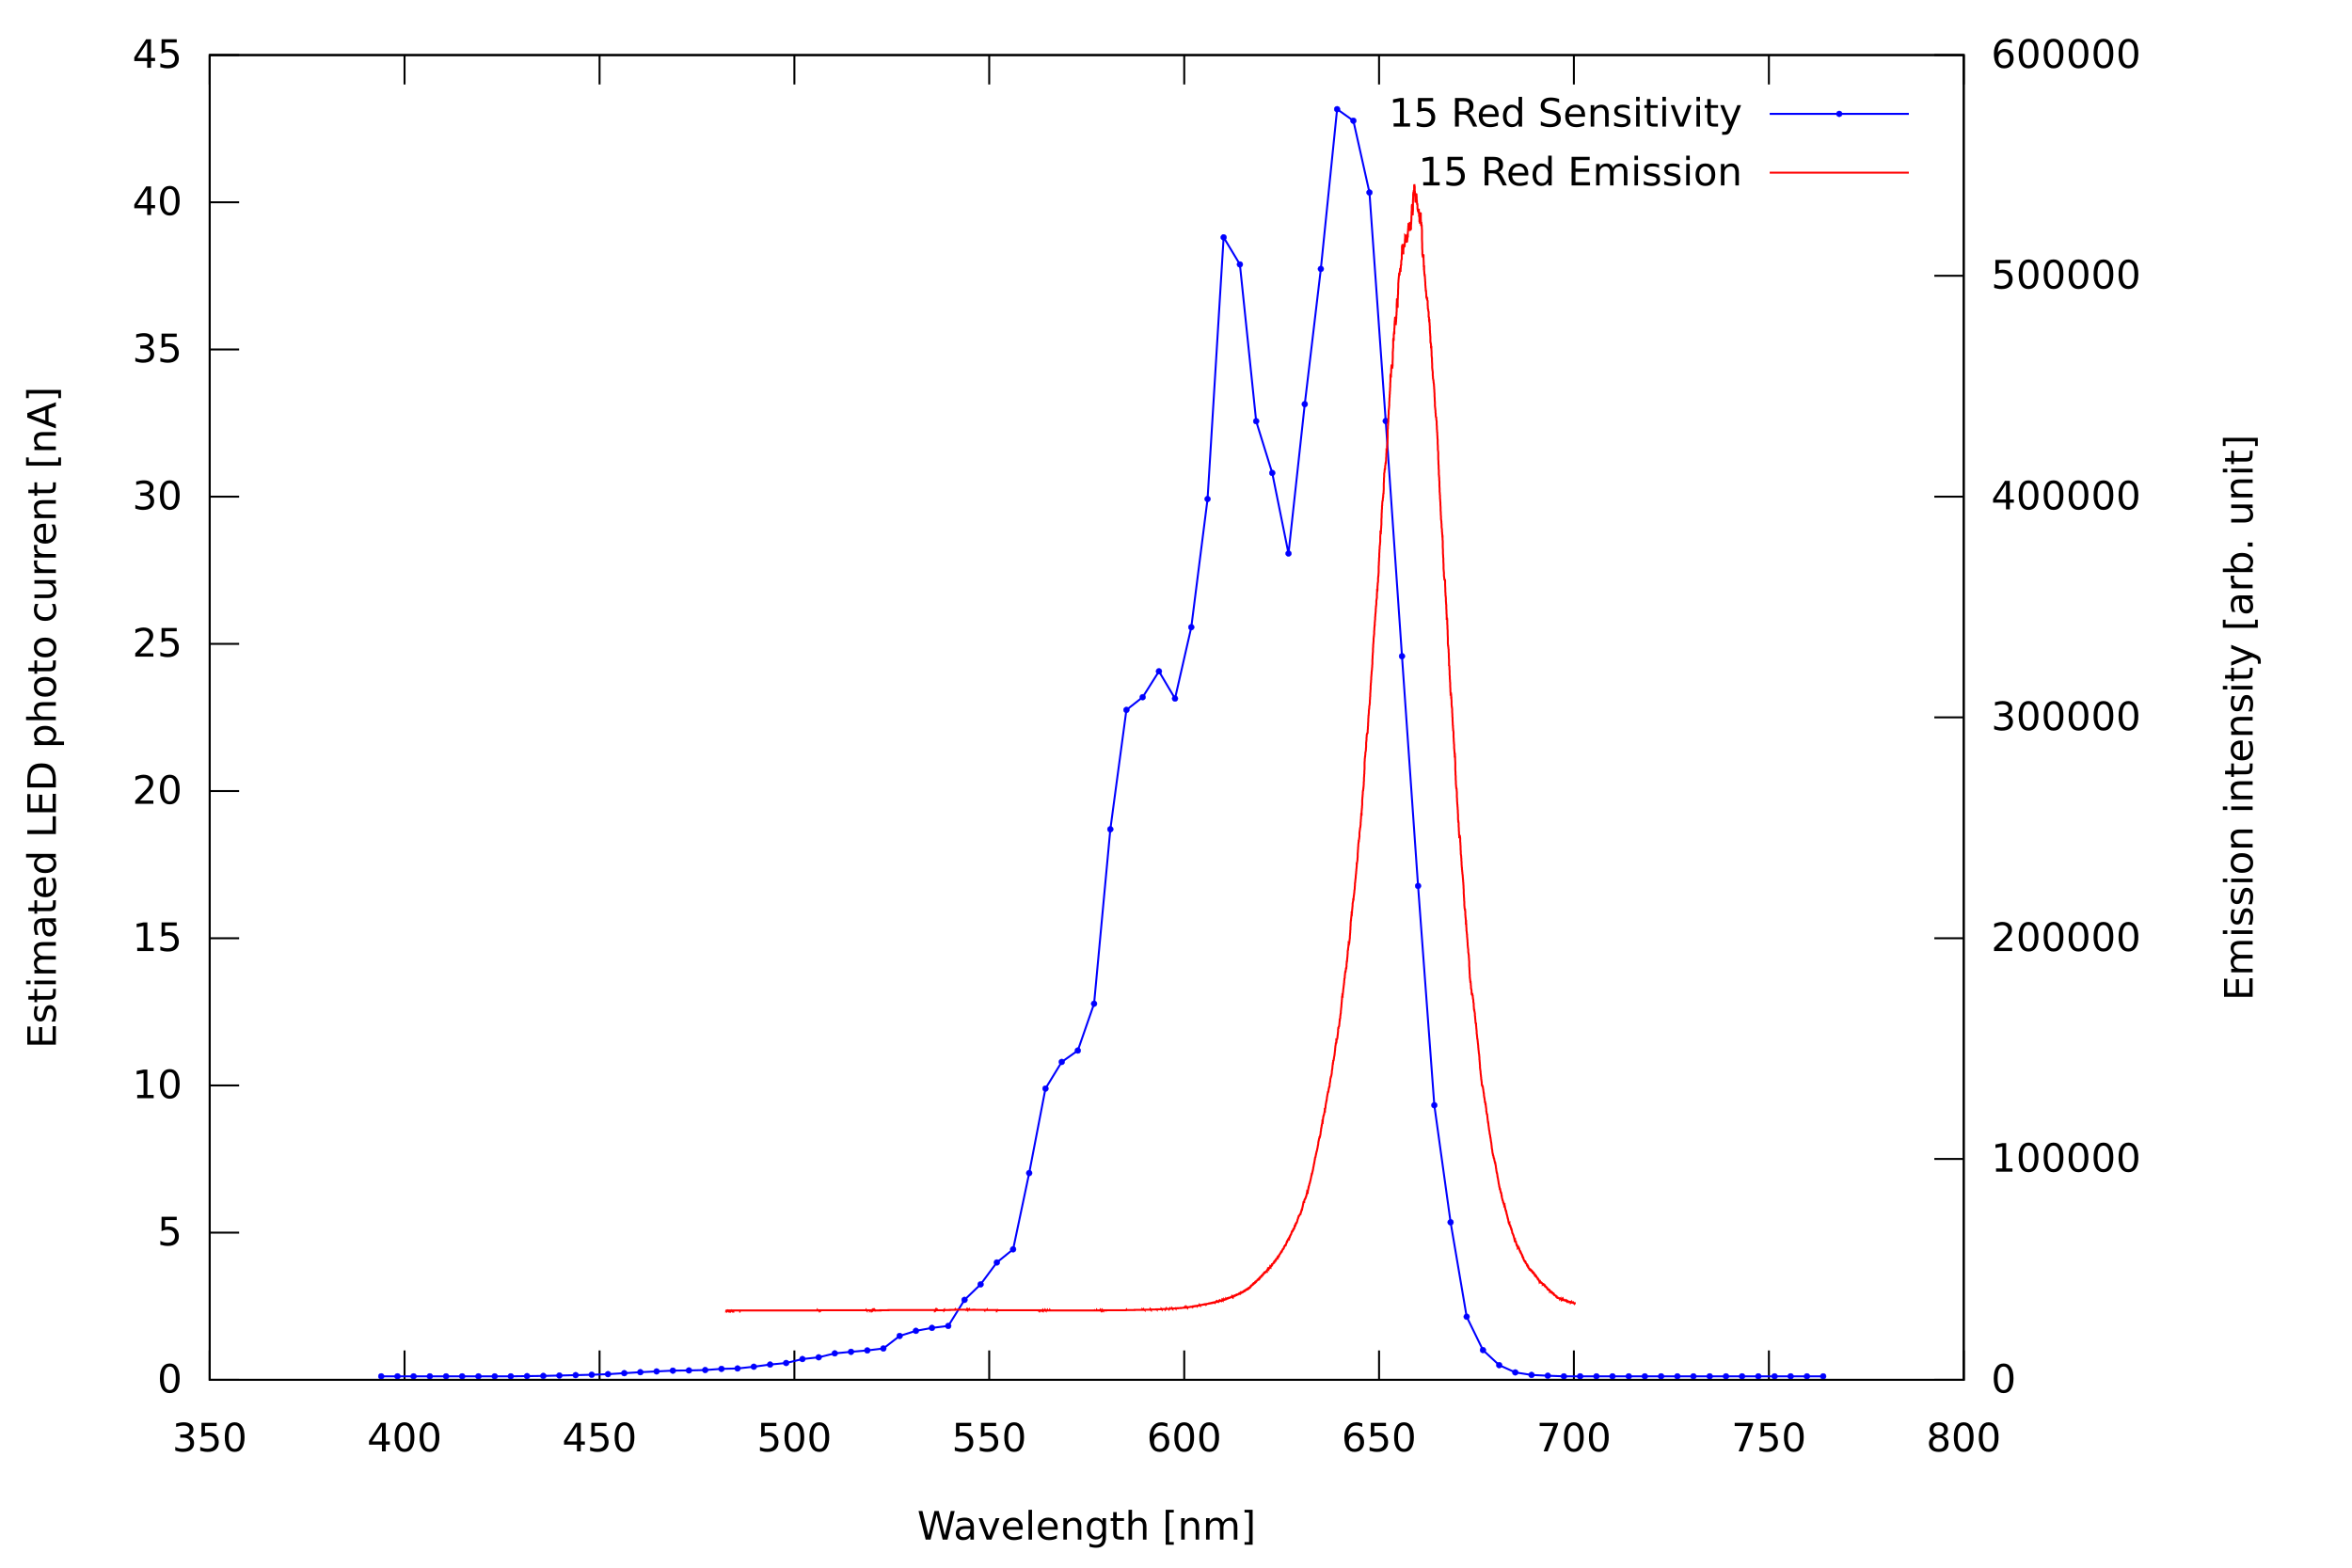
This red LED behaves as expected.
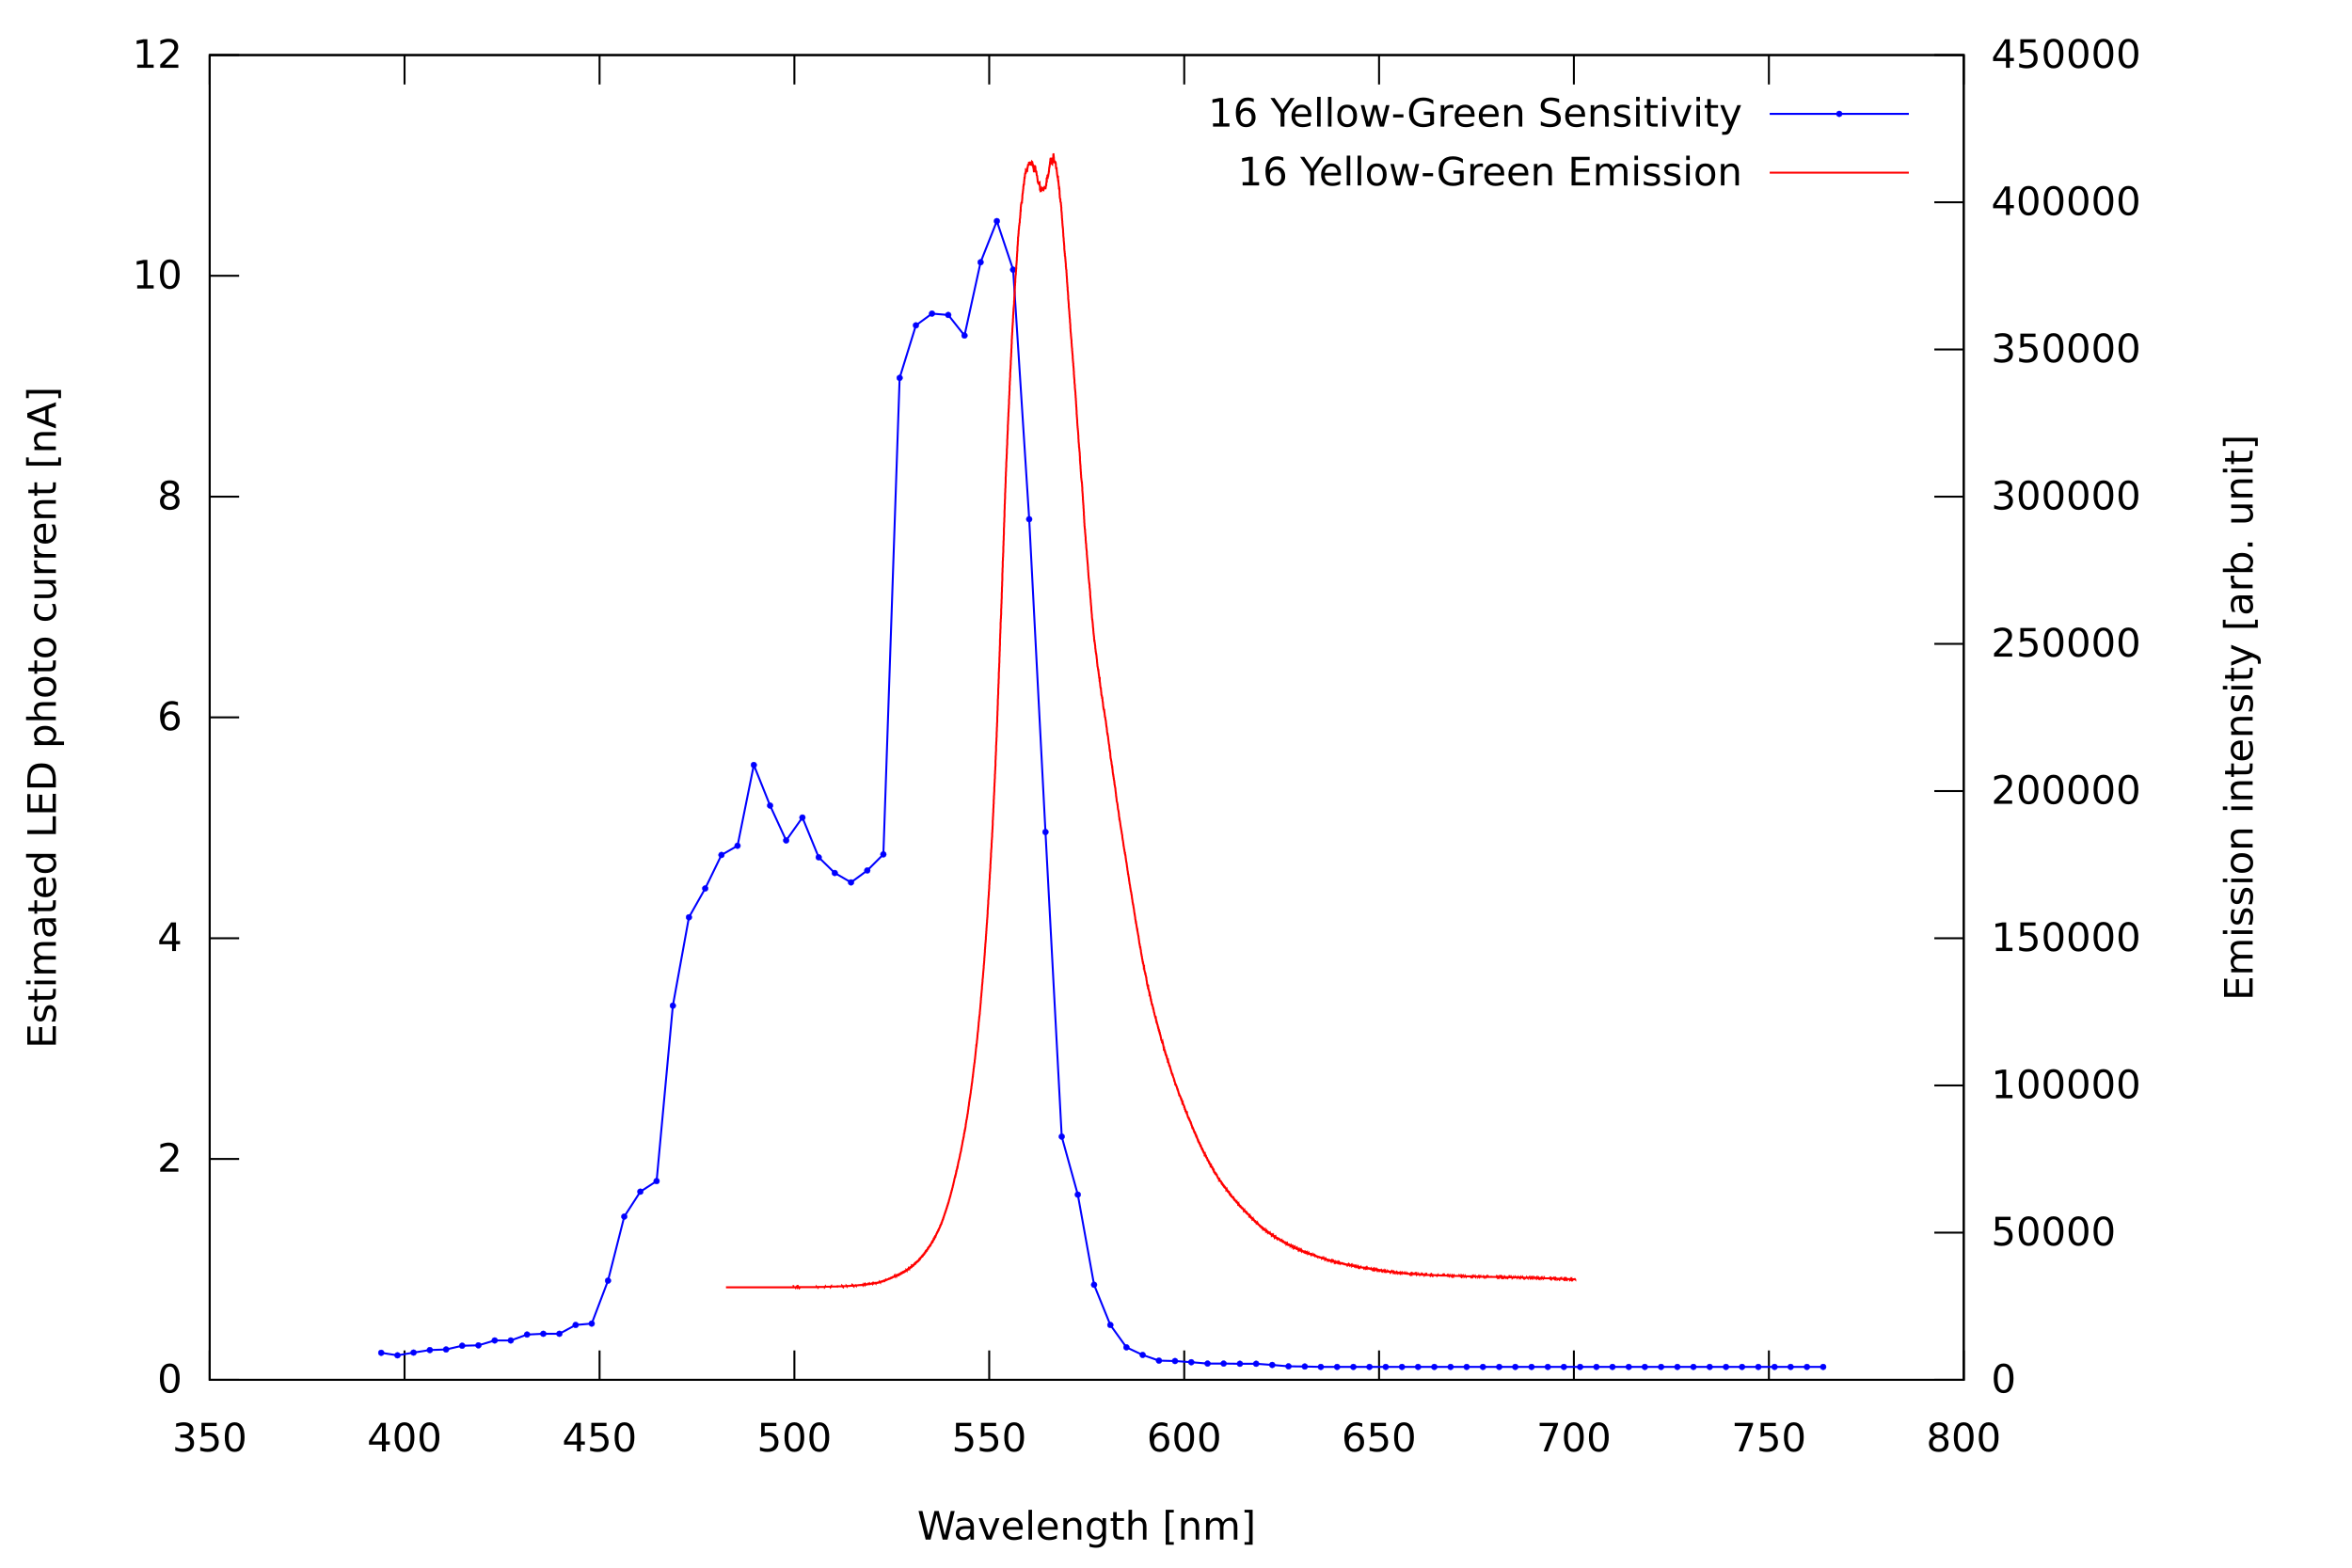
This yellow-green LED shows an additional shoulder in the sensitivity curve between 450 and 500 nm, perhaps due to a mixed material crystal.
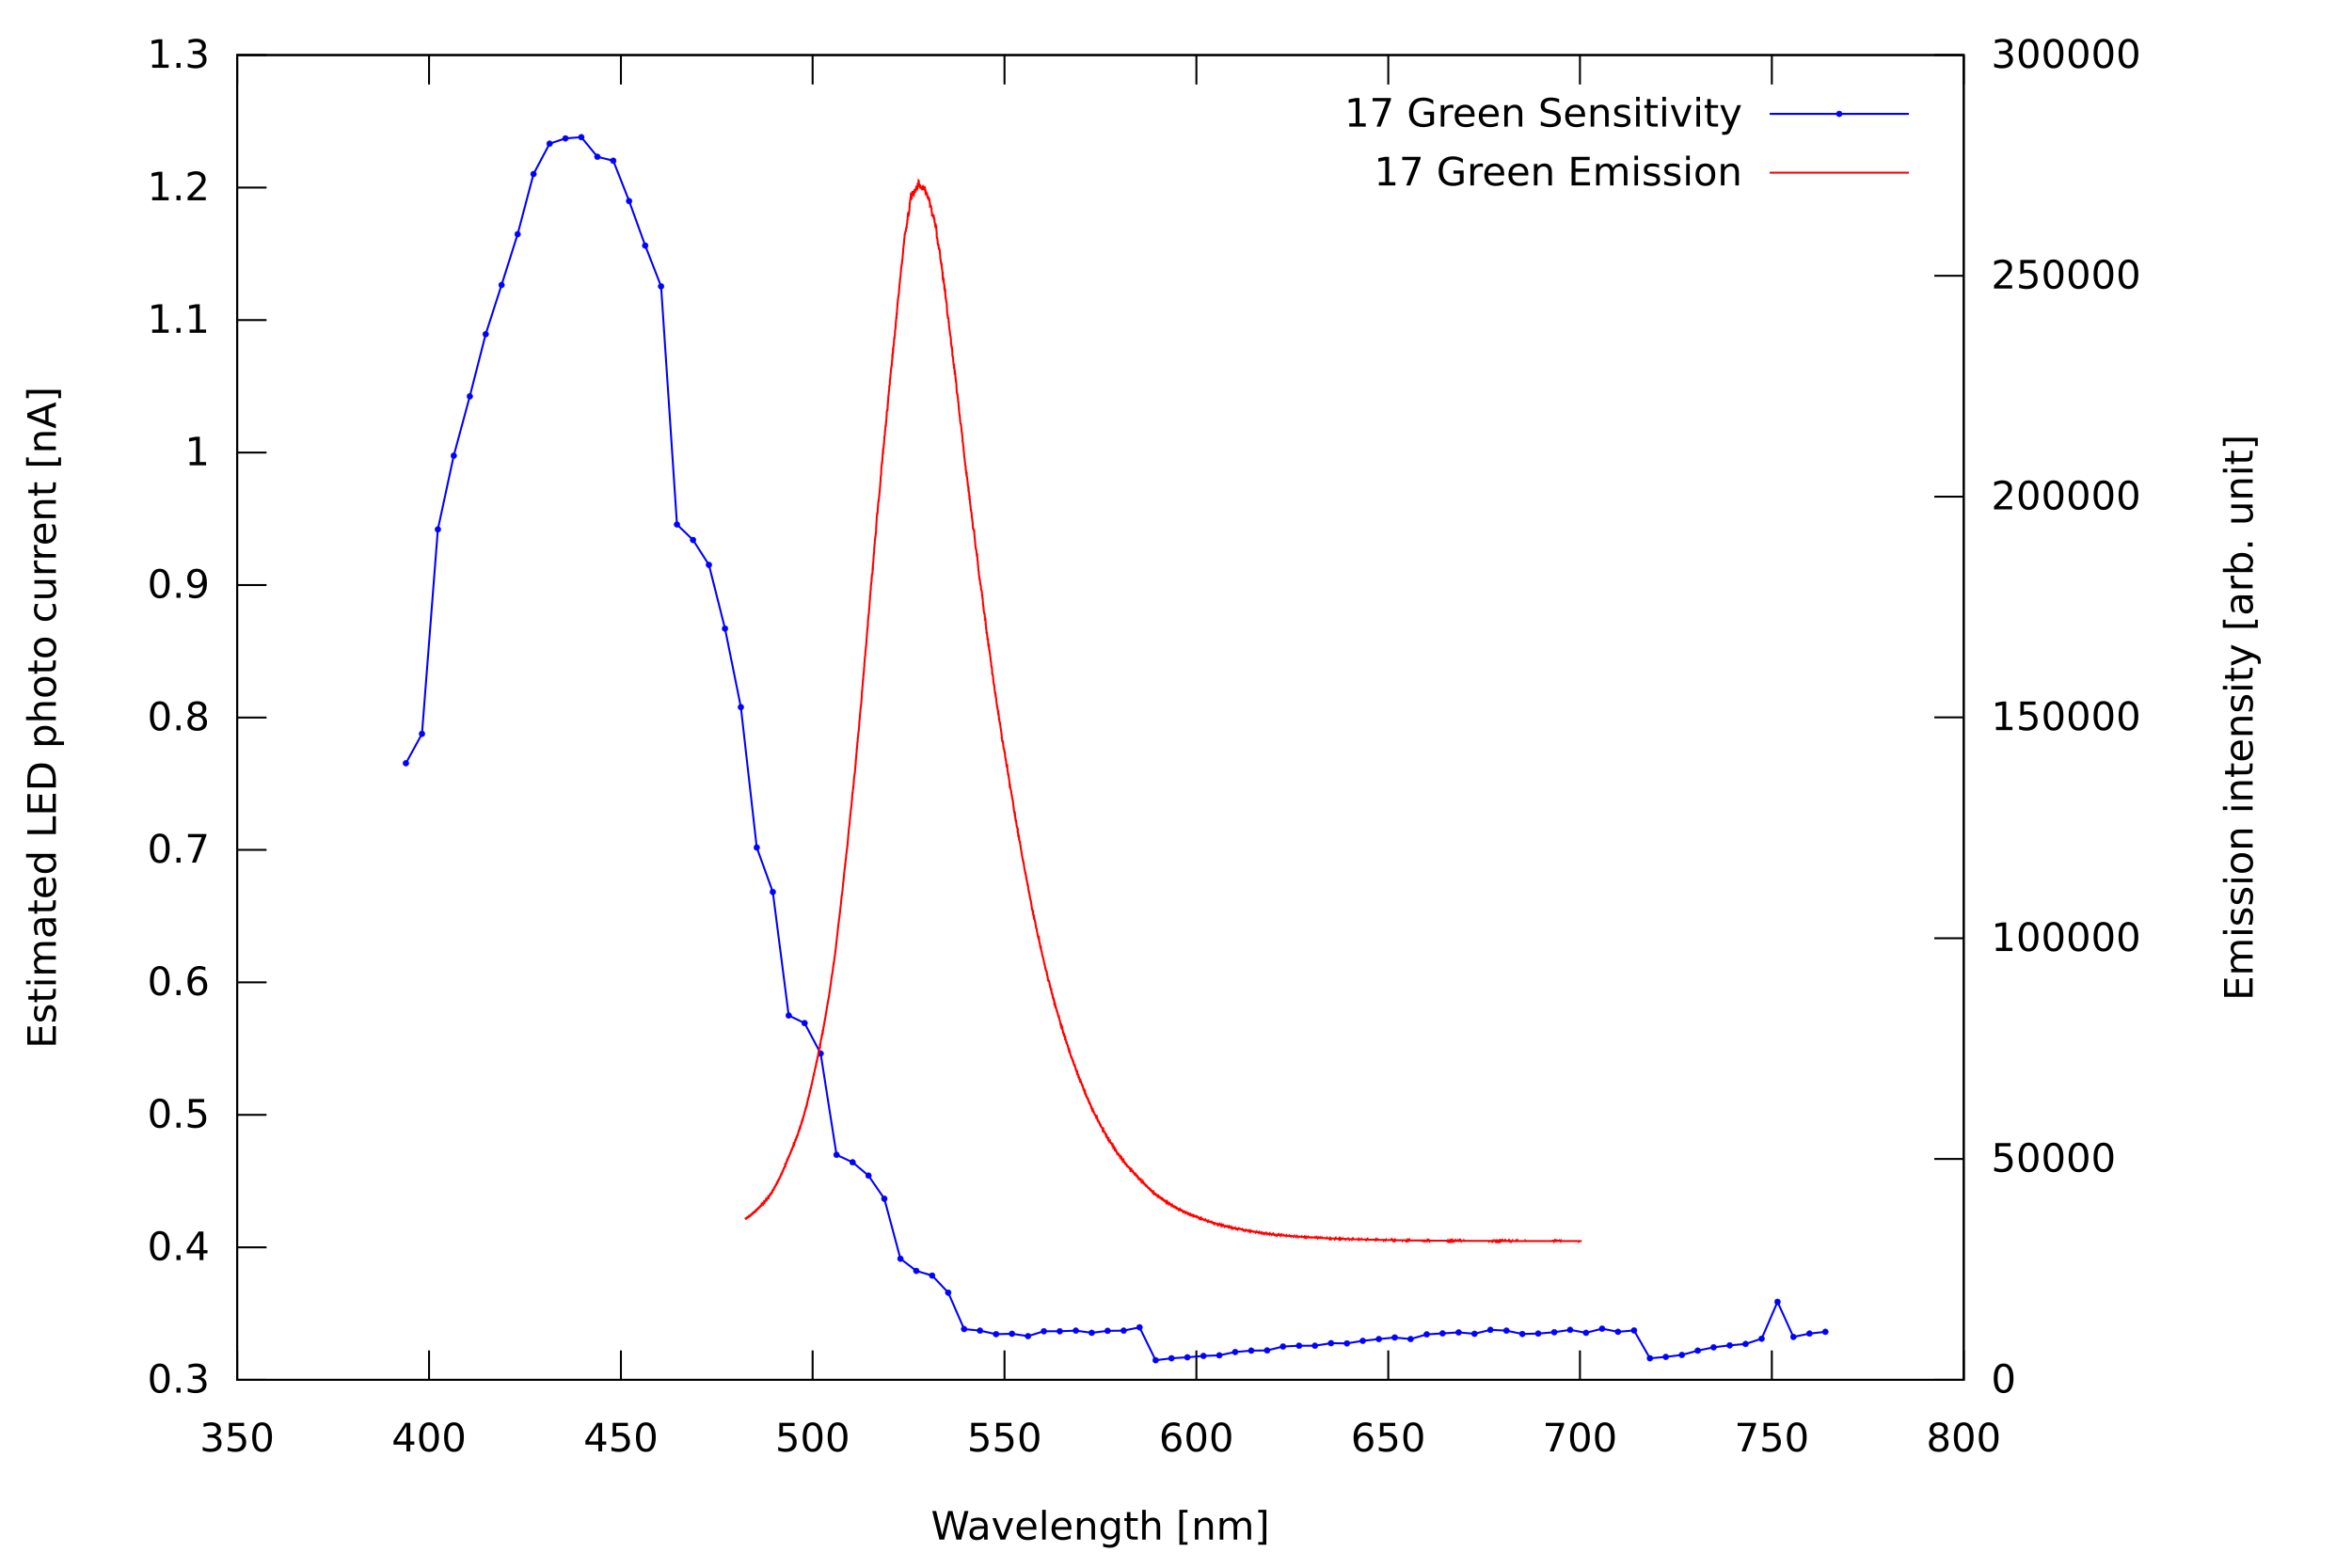
This green LED quite clearly shows the behaviour of an indirect bandgap semiconductor material, with the sensitivity peak shifted far to shorter wavelenghts from the emission peak, having almost no overlap.
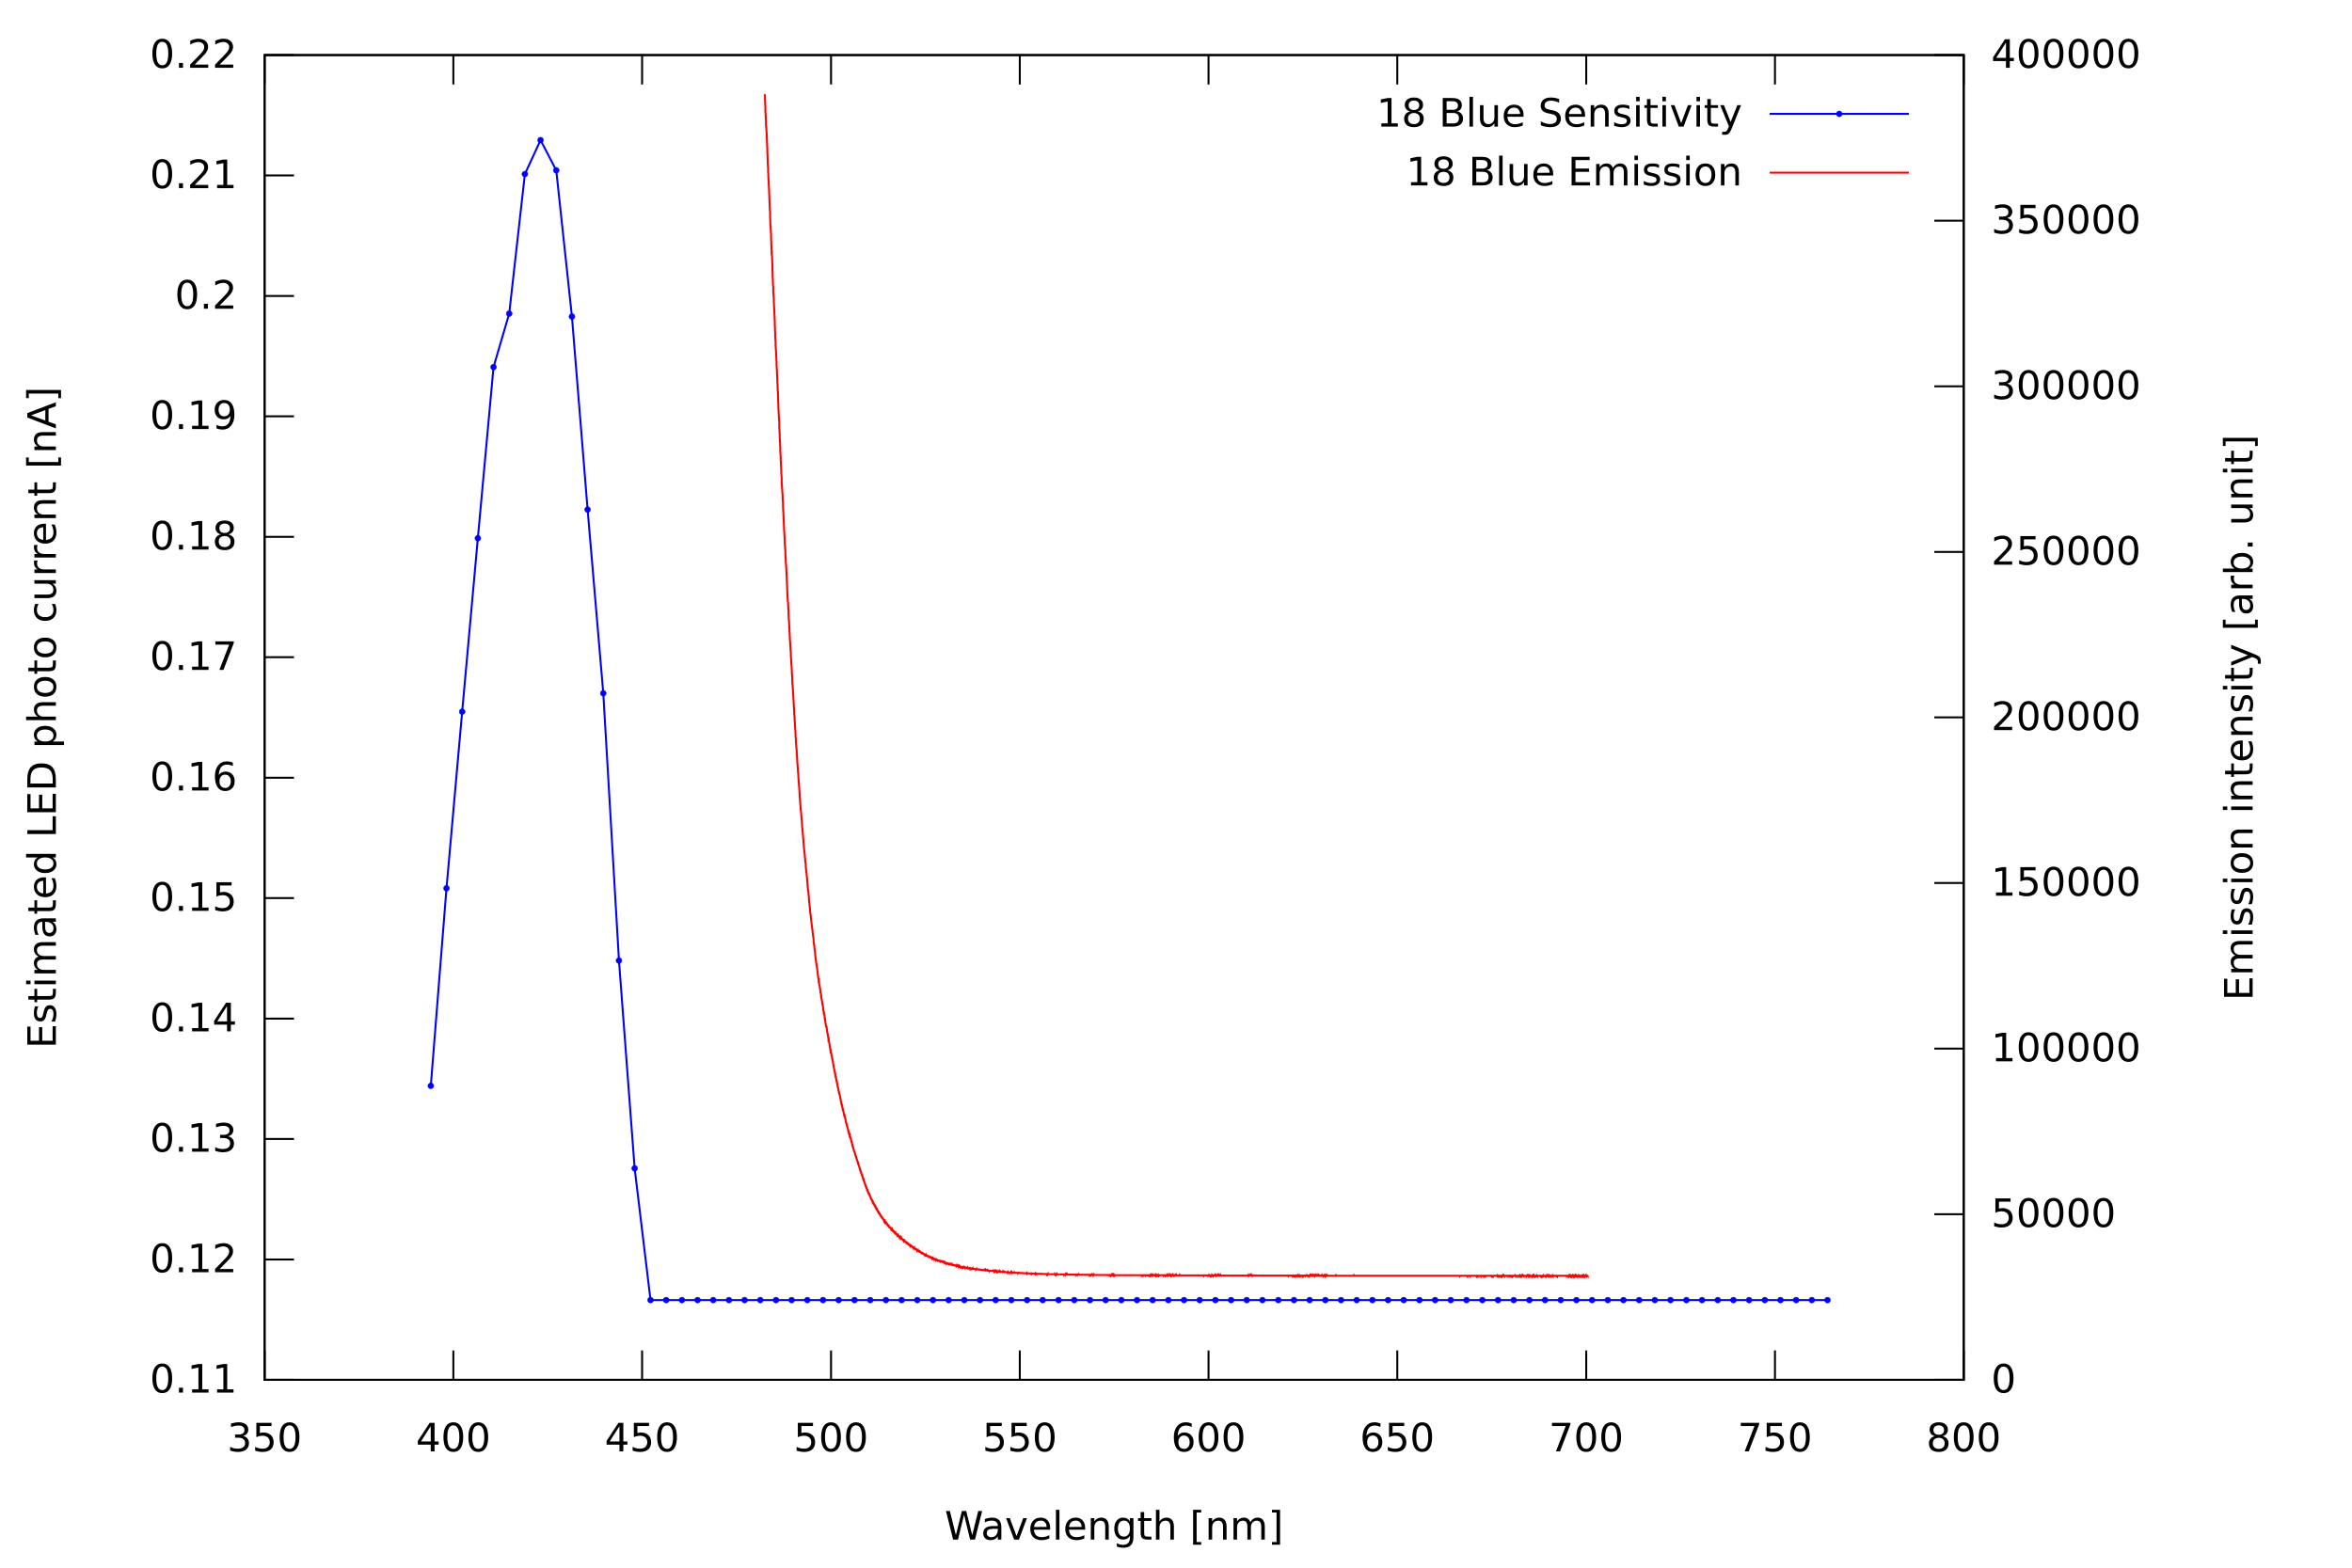
Emission spectrum is clipped due to interference filter in spectrometer, but it looks like an indirect bandgap semiconductor, too. The result does not confirm the finding of the simpler experiment with direct LED illumination which found sensitivity to all wavelength bands, but again, the monochromator output is far weaker than direct illumination with the decorative lamp.
So far, I successfully determined the sensitivity curve of various LEDs.
Clear LEDs mostly show higher photo currents than the ones in diffused and tinted cases.
Ideas for improvements and further experiments:
* Measure known and currently available LEDs in order to build a spectral sensor out of various LEDs with different sensitivity wavelength ranges
* DC driven halogen lamp to eliminate possible artifacts from flicker
* Longer maximum discharge times for greater sensitivity could allow to use smaller slit widths, improving resolution, but at the cost of longer measurement time.
* Average multiple discharge measurements per data point
* Improve mechanical setup for repeatability