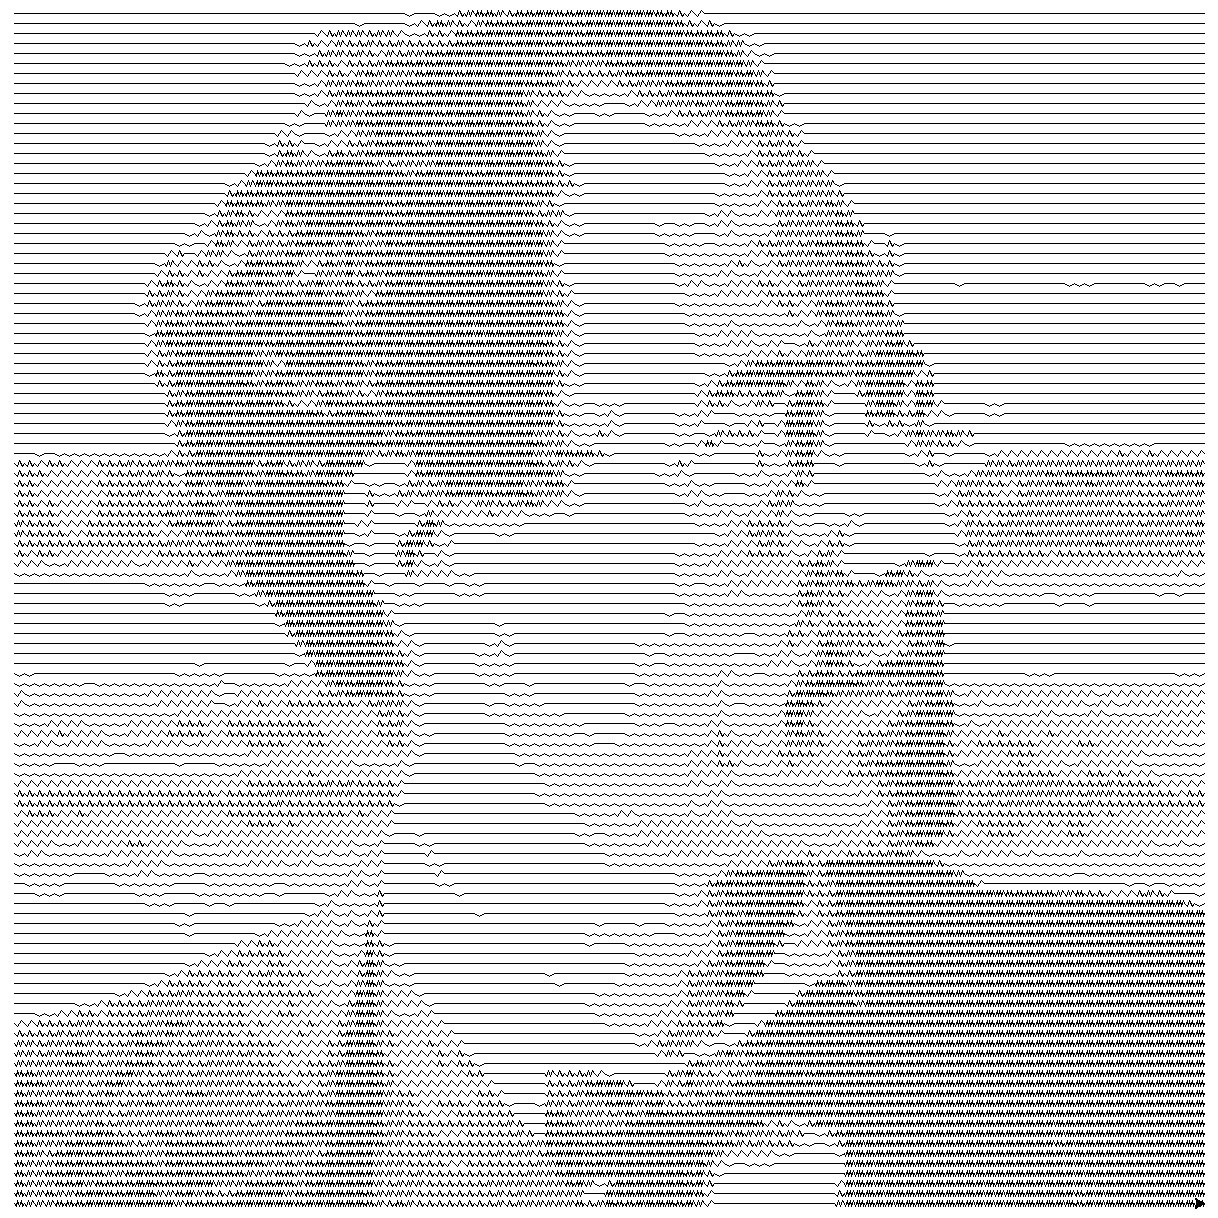
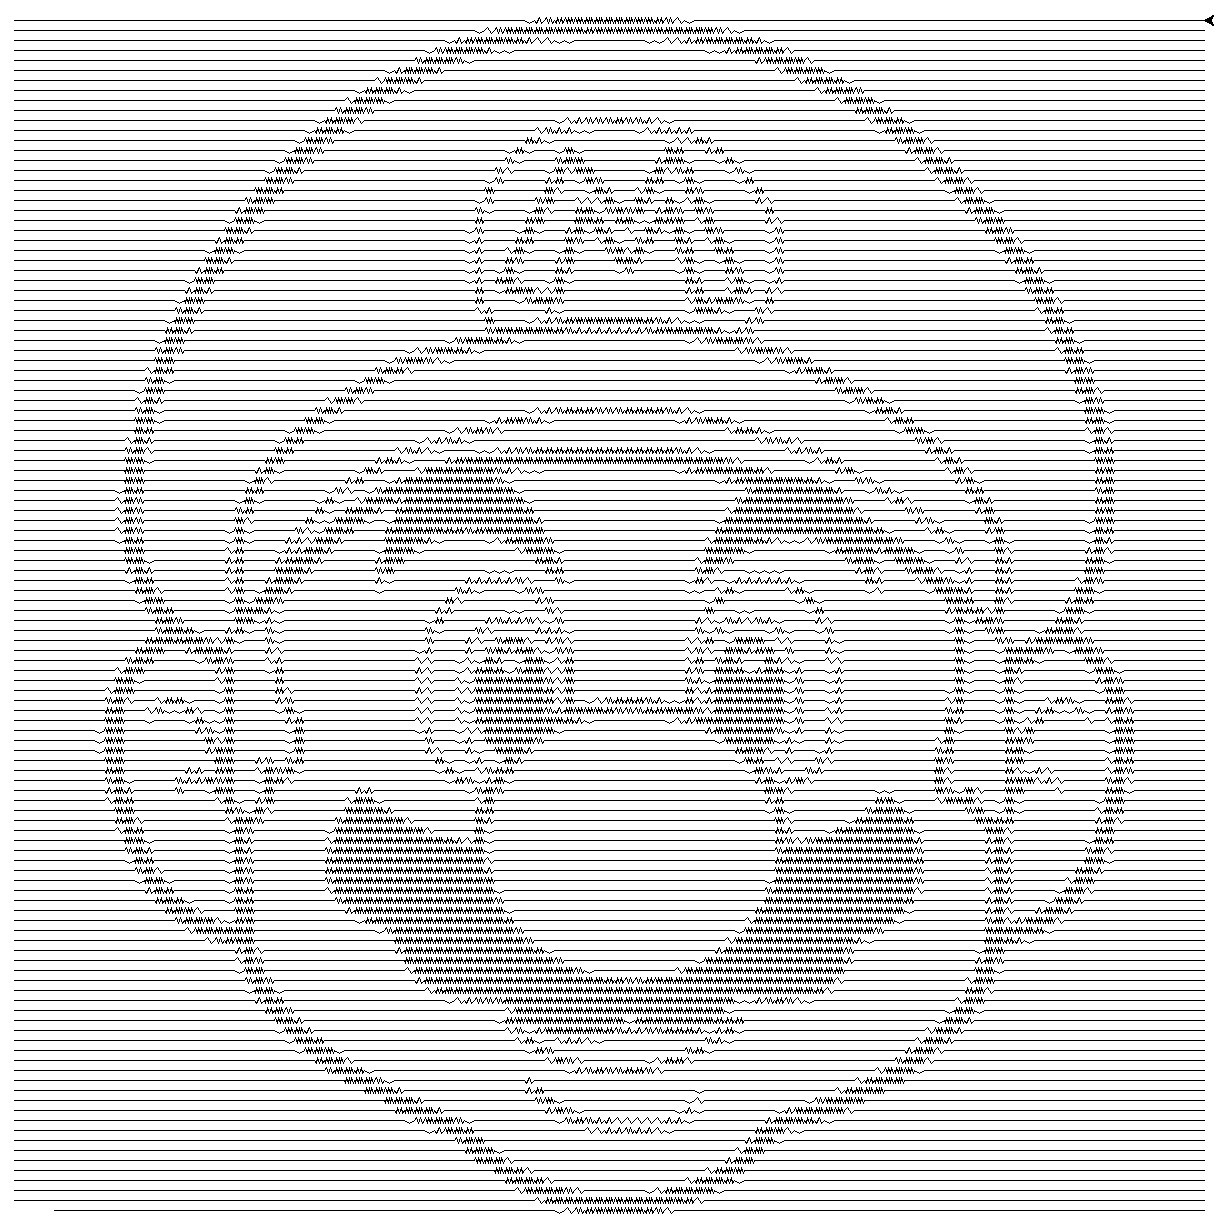
I made two different test images to see how progress is coming along.
Unfortunately these won't actually fit on the bed of the mid-t-bot as a 120mmx120m grid won't leave room for the 8 different levels of zigzag. I'll have to think about how to approach this. Maybe I need to do some zigzag tests on the plotter to find what my max resolution may be.


These show promise but bring up a number of things I need to work on:
- Last zigzag direction needs to be tracked. Currently zigzags always start with an upward stroke, but is last zigzag ended with a downward stroke this means an unsightly V shape.
- Need to work on translating this to work on a spiral pattern. This was a quick and easy proof of concept, but the raster approach negates the use of a plotter. I think spiral will look much cooler while being drawn too
- I'm currenlty pre-processing these in Gimp, converting to grayscale indexed images of 120x120 with 8 color palette, and exporting as .h files. It would be cooler if you could supply an image to Python and it would handle all of this
- I'm still not actually generating g-code. I should probably break out all plotting functions to wrapper scripts which could then could turn on or off the g-code generation as well as trigger the turtle commands
 Mike Szczys
Discussions
Become a Hackaday.io Member
Create an account to leave a comment. Already have an account? Log In.