 Andrei Florian
Project Overview
Saying water pollution today is like shouting out climate change in a high school discourse and getting the looks of everyone bored to their bones of this flamboyant and controversial topic. I learned to look the other way to the guy missing the bin and never bothering to pick up their wrapper and the fumes ejected from factories wherever I go.
We, as humans, are great at hiding in our daily routines, not daring to peek outside, knowing what we are to find if we do. This keeps us going and forces us to look the other way when climate change, world hunger and water pollution are on the news.
But I, as a person, feel the obligation to help make the world a better place, to help us humans grow as a collective and help heal the wounds we inflicted on our world.

Ok, enough with the inspirational talk. Yearly, we dump over 3 million tonnes of trash into the world’s oceans – from companies dejecting their waste products to individuals blind to bins, we all contribute to this jaw-dropping number.
A staggering 80% of water pollution is directly or indirectly caused by humans, making pollution one of the greatest challenges our society has ever faced in its endless expansion.
Agricultural operations are the greatest polluter by far. As our population is growing, we need to feed more and more people. Supply cannot keep up with the demand without advances in fertilisers and antibiotics to ensure that our crops and animals can be produced at maximum capacity. The problem is that over 70% of agricultural waste ends up in oceans.
Hormones, antibiotics, salts, and other dangerous chemicals are ejected by farms daily through fertilisers, manure, and other waste products. These chemicals dramatically pollute the water and can alter or even disintegrate entire ecosystems.

Industrial operations also pose a great threat to the ecosystems in water bodies. Nitrogen, phosphorus, and other heavy chemicals can cause the water body dumped in, to change colour, turbidity or even temperature therefore having a dramatic impact on the ecosystem found there.
These chemicals can also cause algae to bloom out of control leading to dead zones in bodies of water – zones deprived of oxygen where life cannot be supported. It is estimated that there are about 400 dead zones in the world today.
Almost 33% of reef forming corals, sharks, and shark relatives, and 33% of marine mammals are threatened with extinction at present. At least 680 vertebrate species were driven to extinction by human actions since the 16th century, many of these marine species. The list goes on…
And this issue does affect us directly; over 250 million people die yearly due to diseases contracted by drinking dirty water such as cholera and typhus. That is 1 in 32 people (I had to double check that just to be sure). That is a scary figure.

So, what can be done? Well before we get into paper straws and country wide regulations, we need to identify the sources of pollution in streams, lakes and oceans and act on them before they get out of hand.
Water quality monitoring is a relatively new concept. Data collection is done in unstable environments, technologies are often proprietary, and the cost of operation is very high, bringing water quality monitoring out of the reach of even developed countries.
Existing solutions more often than not collect water samples to send to labs for inspection as opposed to collecting the data in the field. This takes longer and incapacitates live tracking of pollution. Modules that do collect data in the field are often large and bulky and lack flexibility, making it a pain to mount them and apply maintenance, on top of this, they often don’t collect sufficient and meaningful data.
But most importantly, they lack IoT connectivity. Devices that do send data to a central location often use proprietary technologies such as XBee and other radio communication methods which do not directly connect online. Adding pain to injury, these implementations are extremely expensive for what they offer.

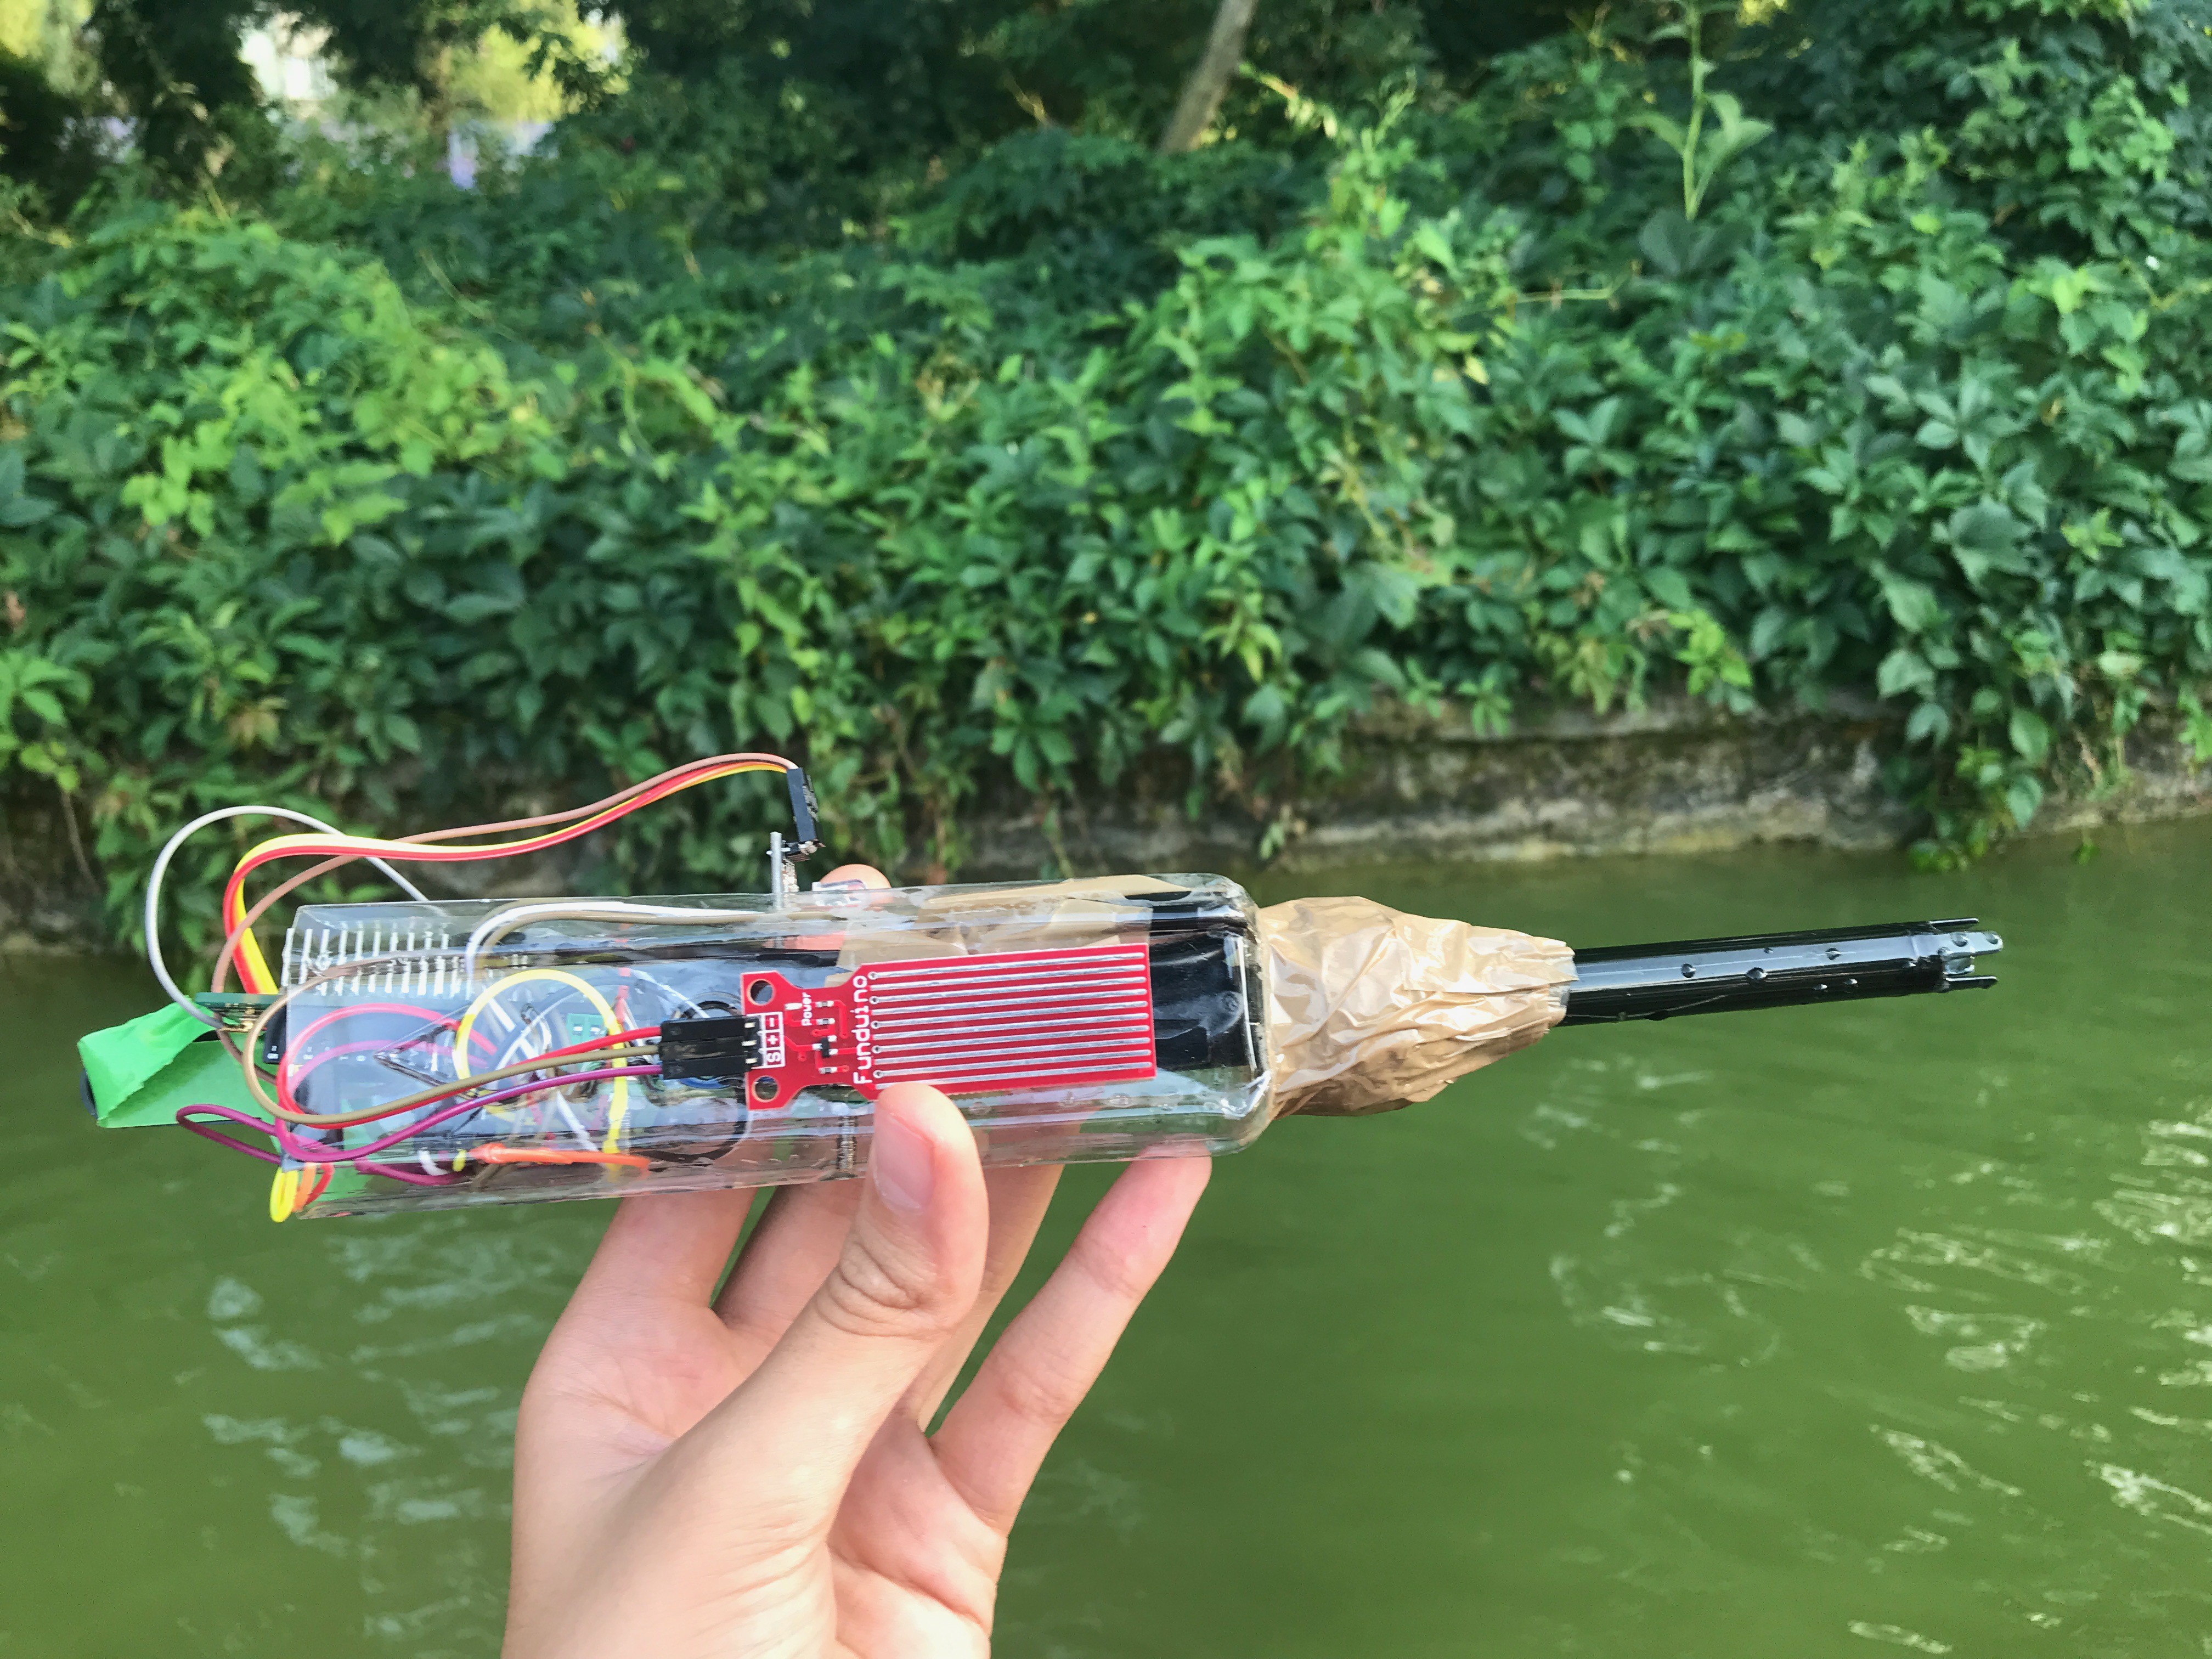
This is where UnifiedWater comes in. Using industry standard sensors and IoT connectivity, UnifiedWater redefines water quality monitoring through a set of distinct features setting it apart from other devices on the market.
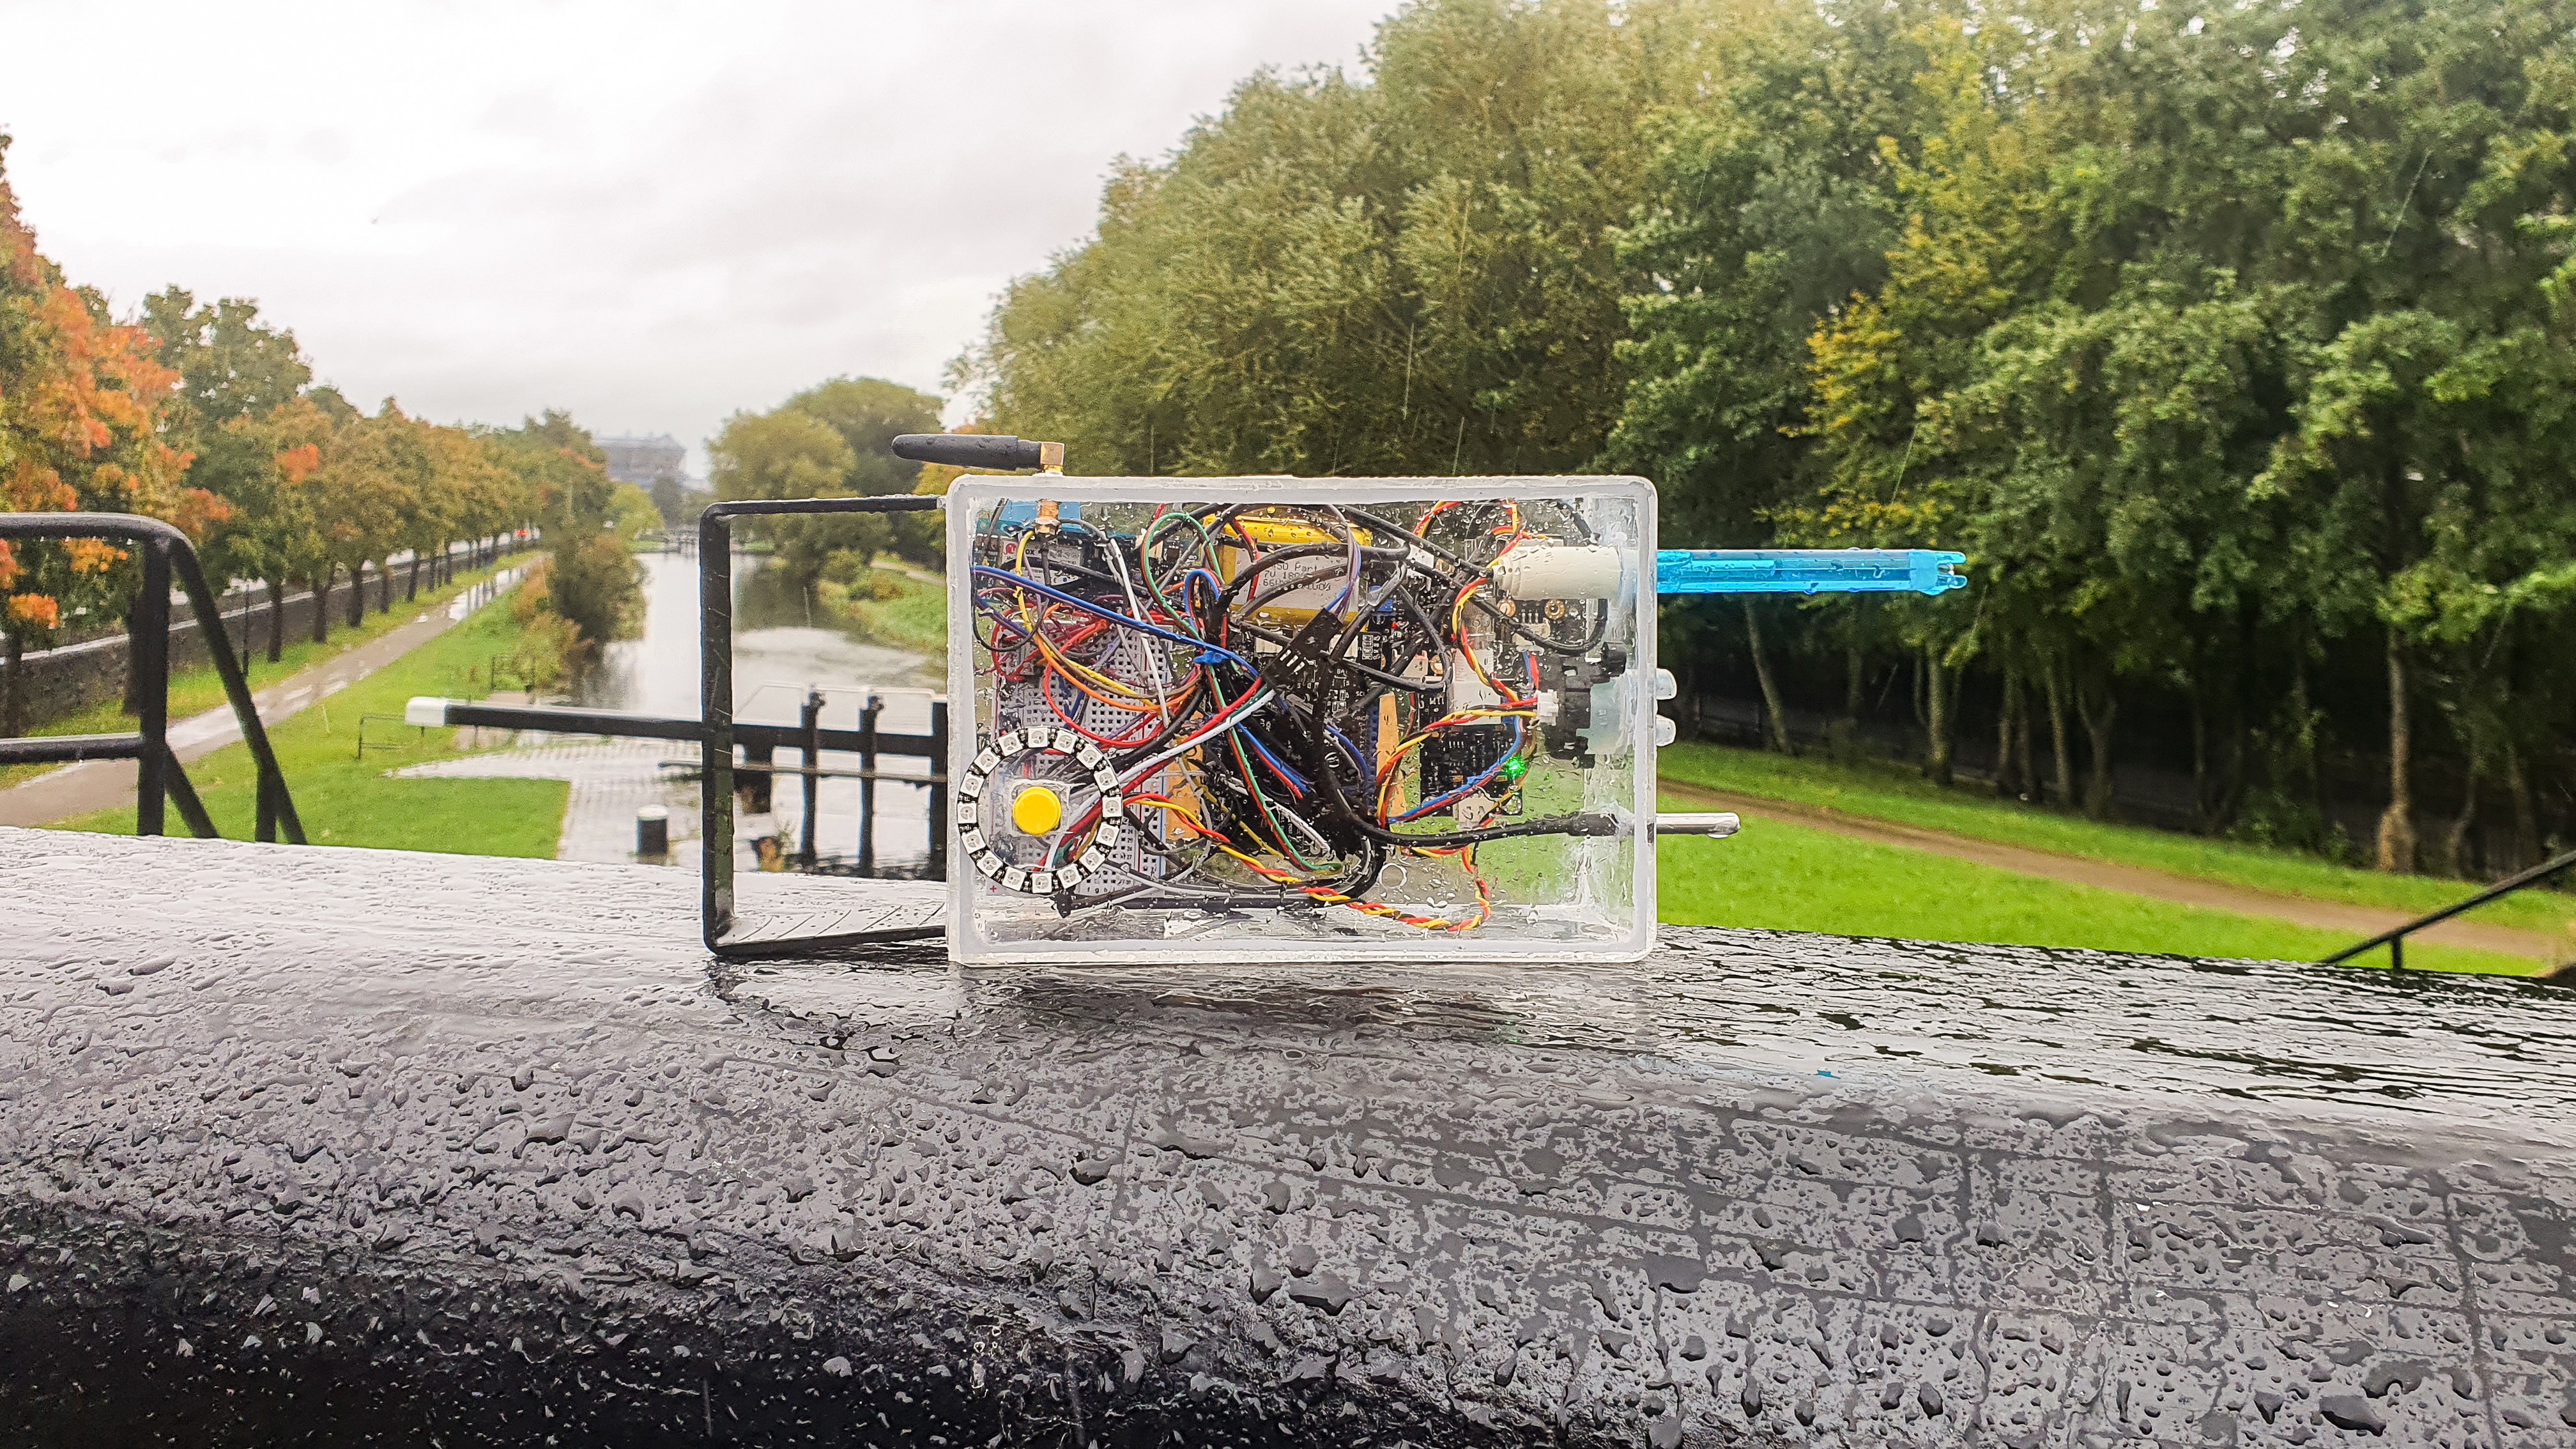
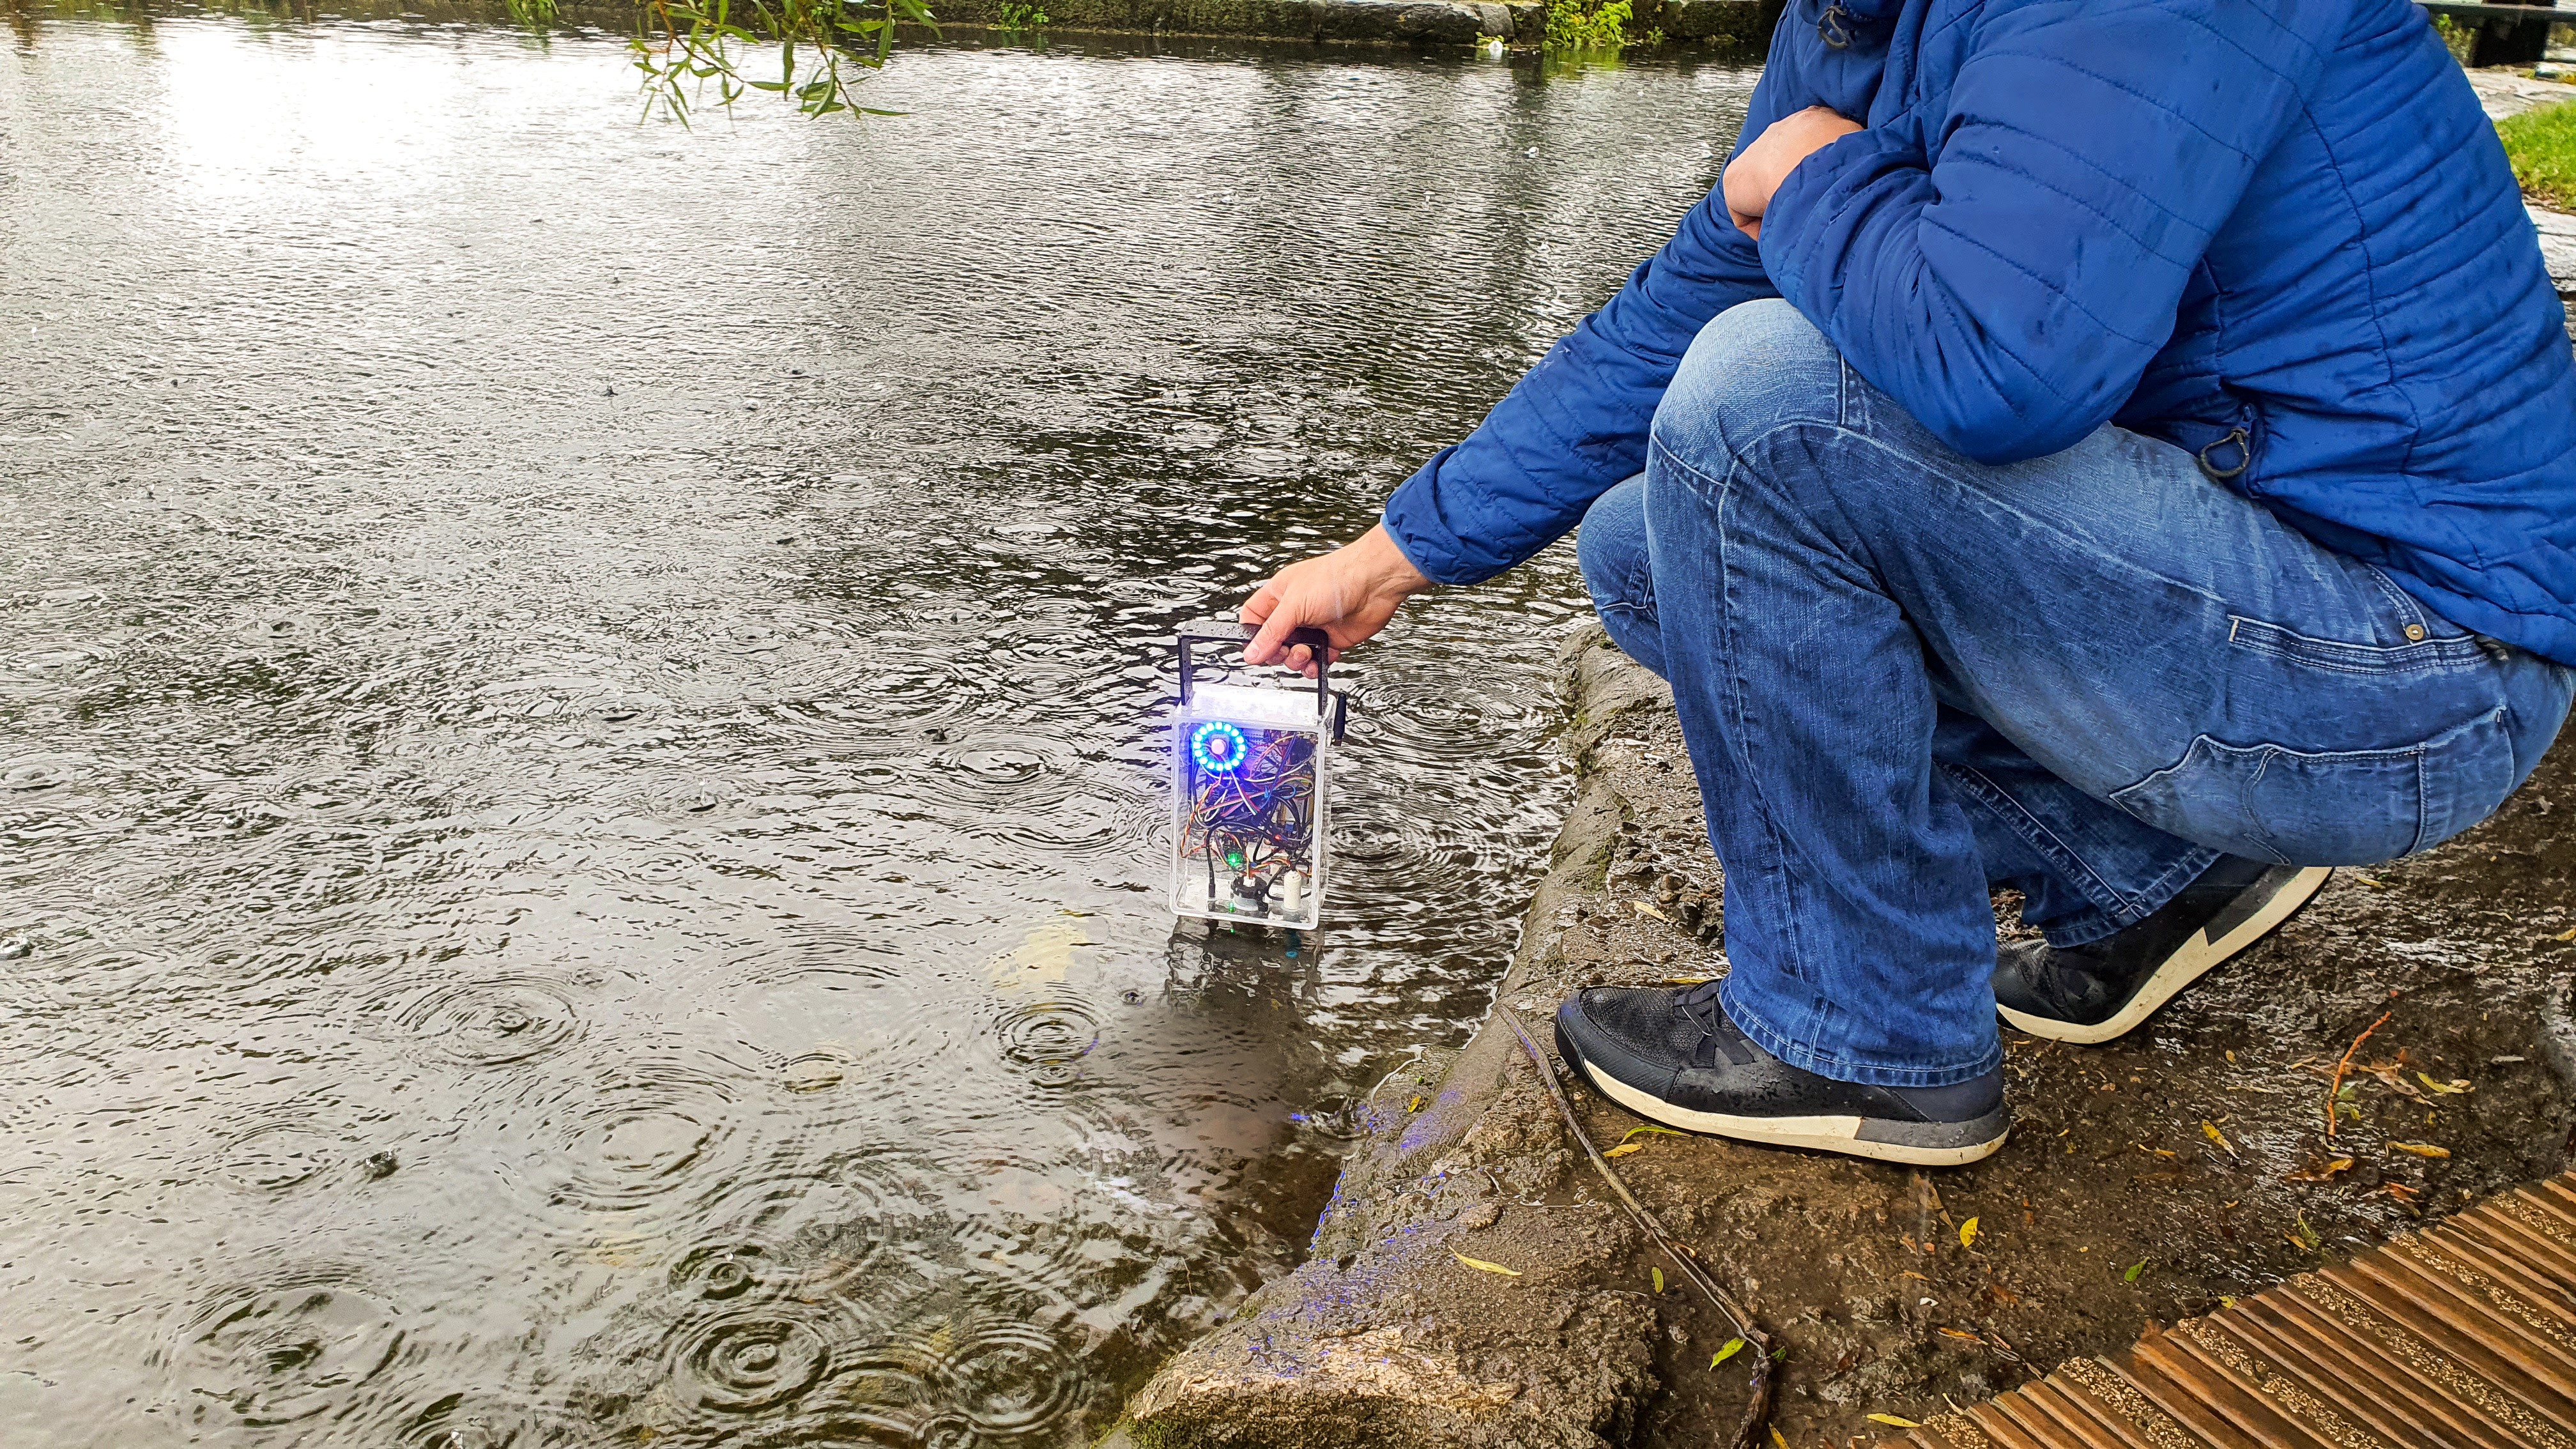
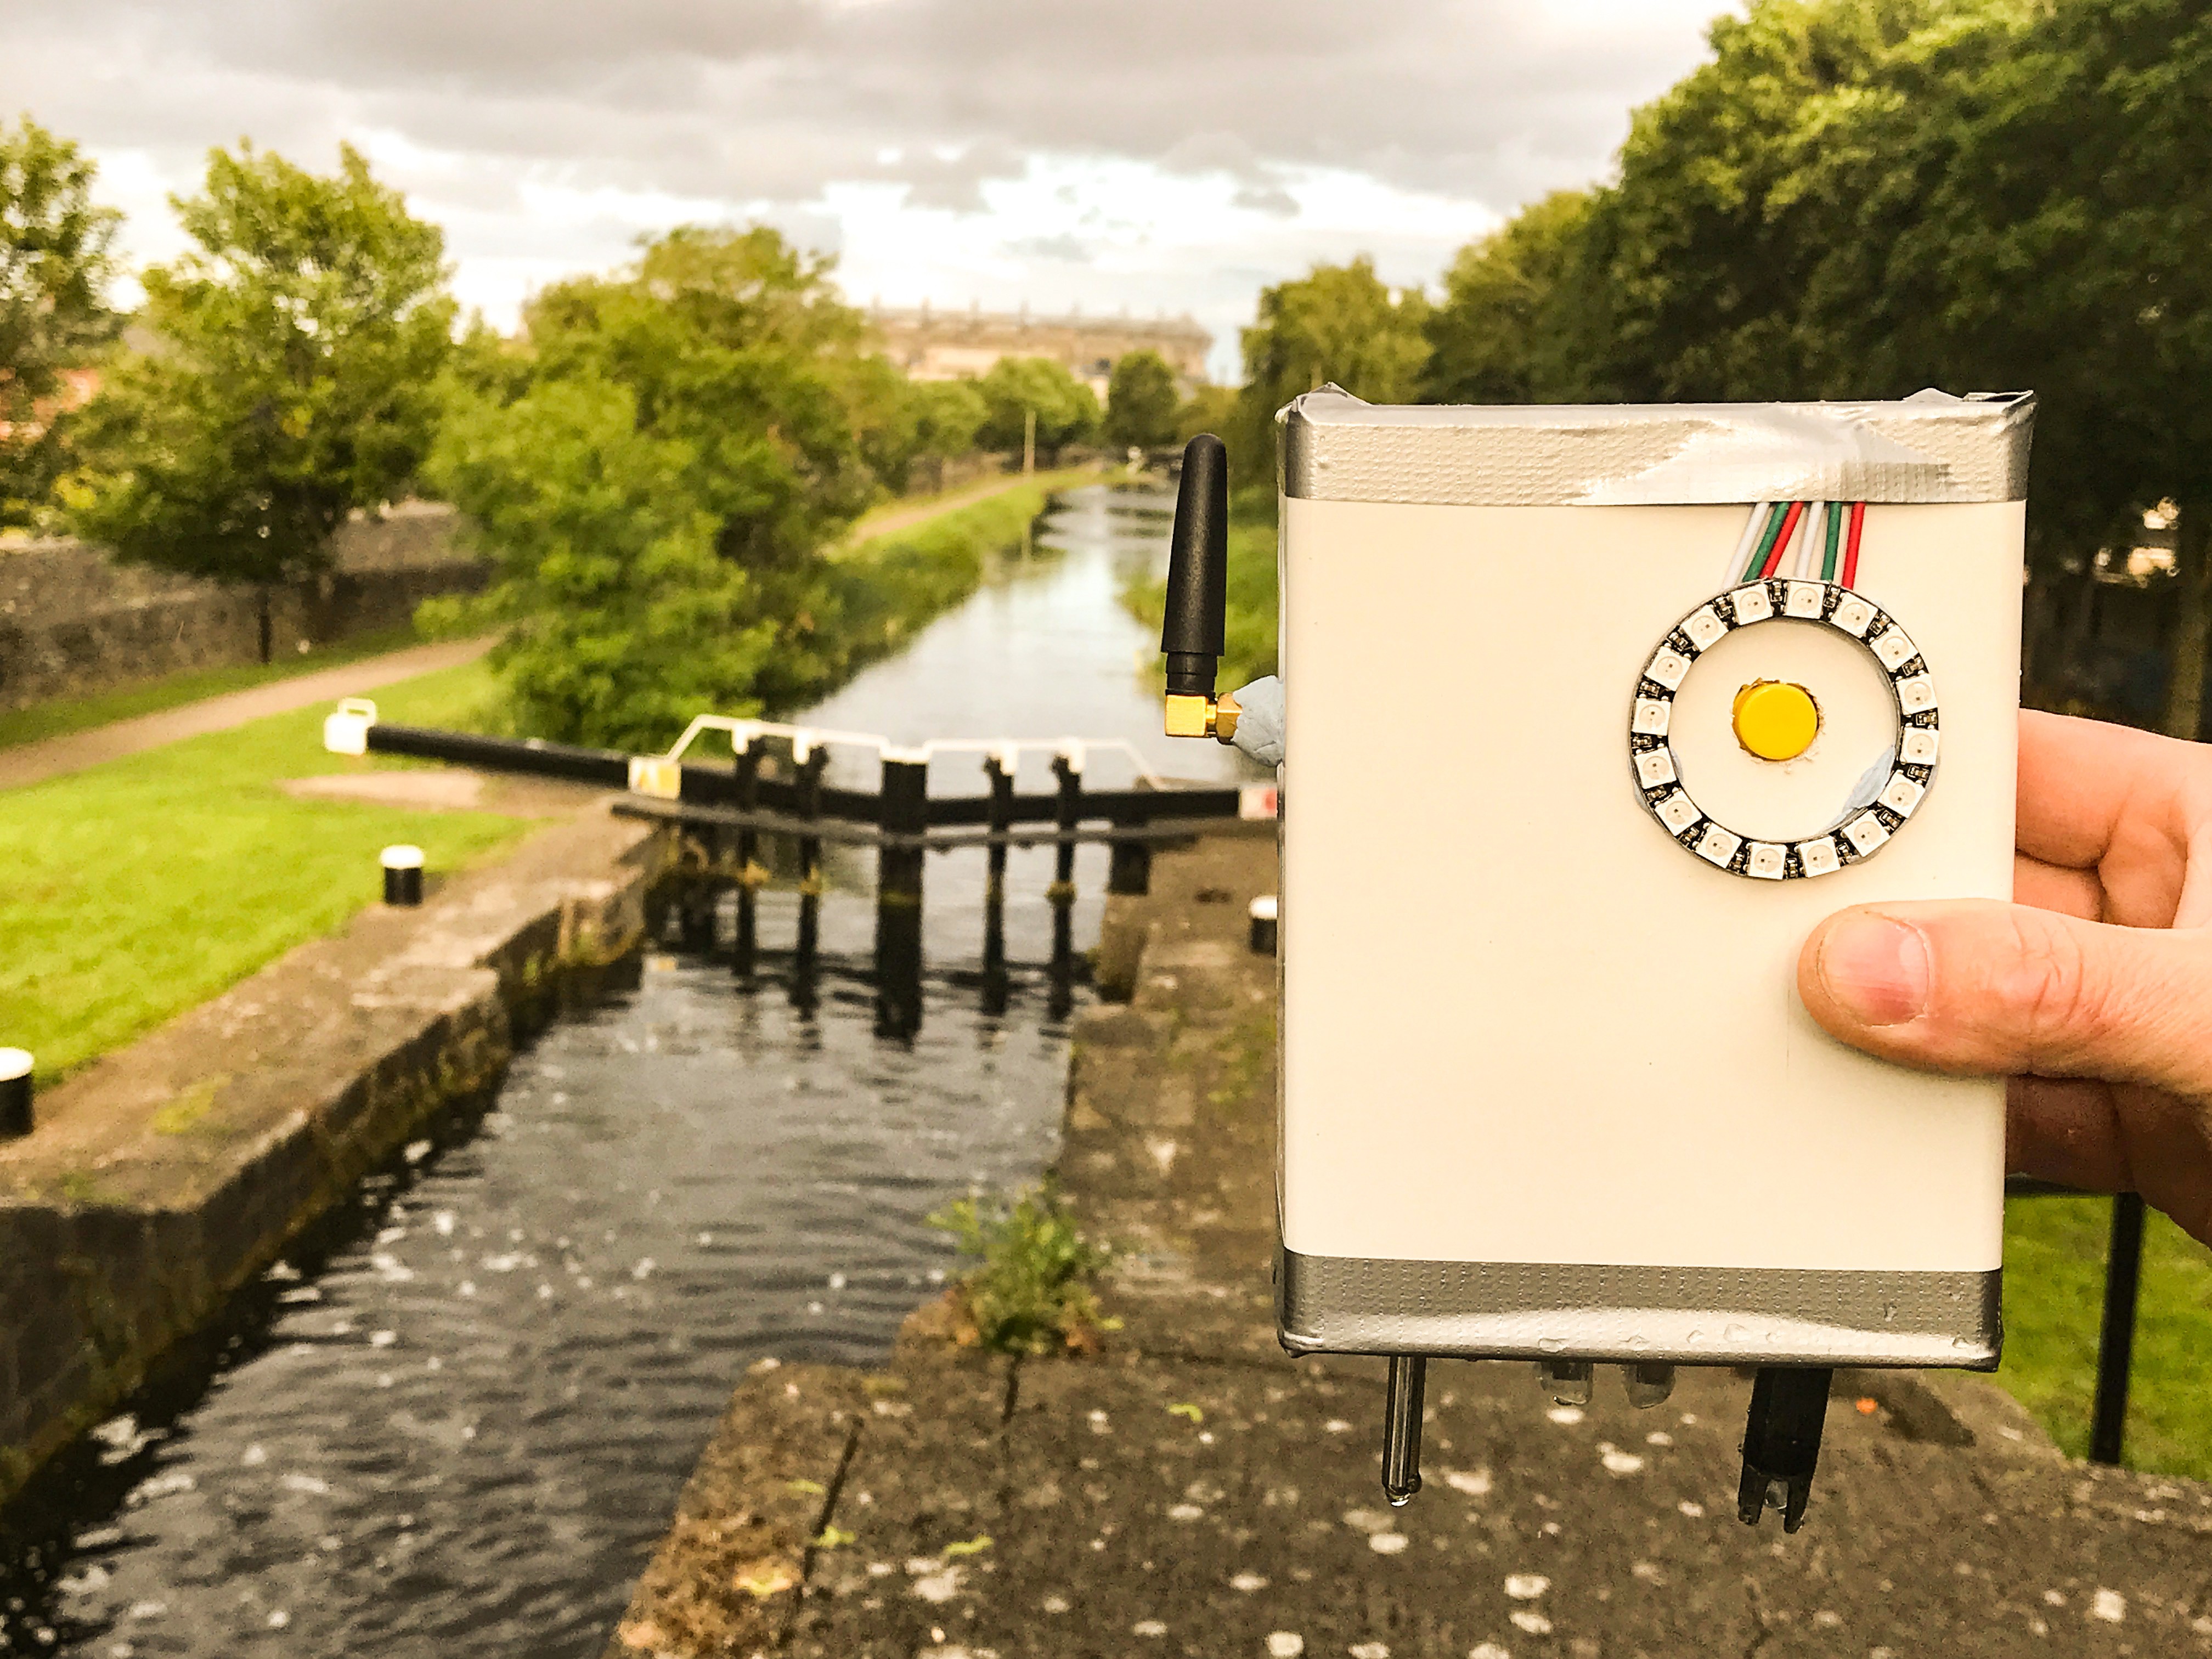
UnifiedWater is a portable, baggable device that can operate in two modes – either as a stand-alone, portable device, or as part of a network of tens or hundreds of fixed devices collecting critical water pollution parameters. UnifiedWater sends all data collected to IoT Central via GSM at defined intervals of time meaning that the device can work anywhere in the world with cellular coverage. The data collected by the device(s) can be monitored and analysed in real time on an online, interactive dashboard using Azure IoT Central anywhere in the world, at any time.
Interacting with the device is essential for longevity and ensuring its functionality. UnifiedWater can be configured remotely using twin properties in IoT Central allowing the authorities, university, or private institution to change the number of samples taken, interval of data collection and many other parameters. This reduces the amount of maintenance required by people on the field dramatically.
By only clicking a button online, the device can transition between enterprise mode (where it works with other devices) and personal mode (where it can be submerged at different points by a surveyor).
The flexibility of the implementation together with the low production cost, scalability, security, sustainability, and high accuracy set UnifiedWater apart from existing competitors. The only way we can make our waters cleaner and save marine species from extinction is by identifying the root causes of pollution by monitoring water quality. Be it in rivers, lakes, or oceans, UnifiedWater is in the front-line combatting water pollution.
GitHub repo - https://github.com/Andrei-Florian/UnifiedWater
Project In-Dept
This section of the publication will go into technical detail regarding the application. The overview section above gave a non-technical overview of the application.
Data Collected
UnifiedWater collects data from multiple sensors to encapsulate the overall quality of the body of water. Measuring water quality is difficult because there are a lot of parameters to look for (from temperature to presence of chemicals). It is not plausible to collect data on every parameter as that would require tens of sensors and significantly impact the device’s battery life and increase costs.
The balance between battery life and data collected has been carefully analysed. I reached the conclusion that the main data points needed are the water temperature, pH (acidity), and turbidity (as well as atmospheric temperature and humidity to be able to contrast them with the water temperature). Below is a table that details the data collected by each sensor and the unit it is measured in.
| Sensor | Data Collected | Units |
| pH Sensor | pH (acidity) of water | pH scale (1 – 14) |
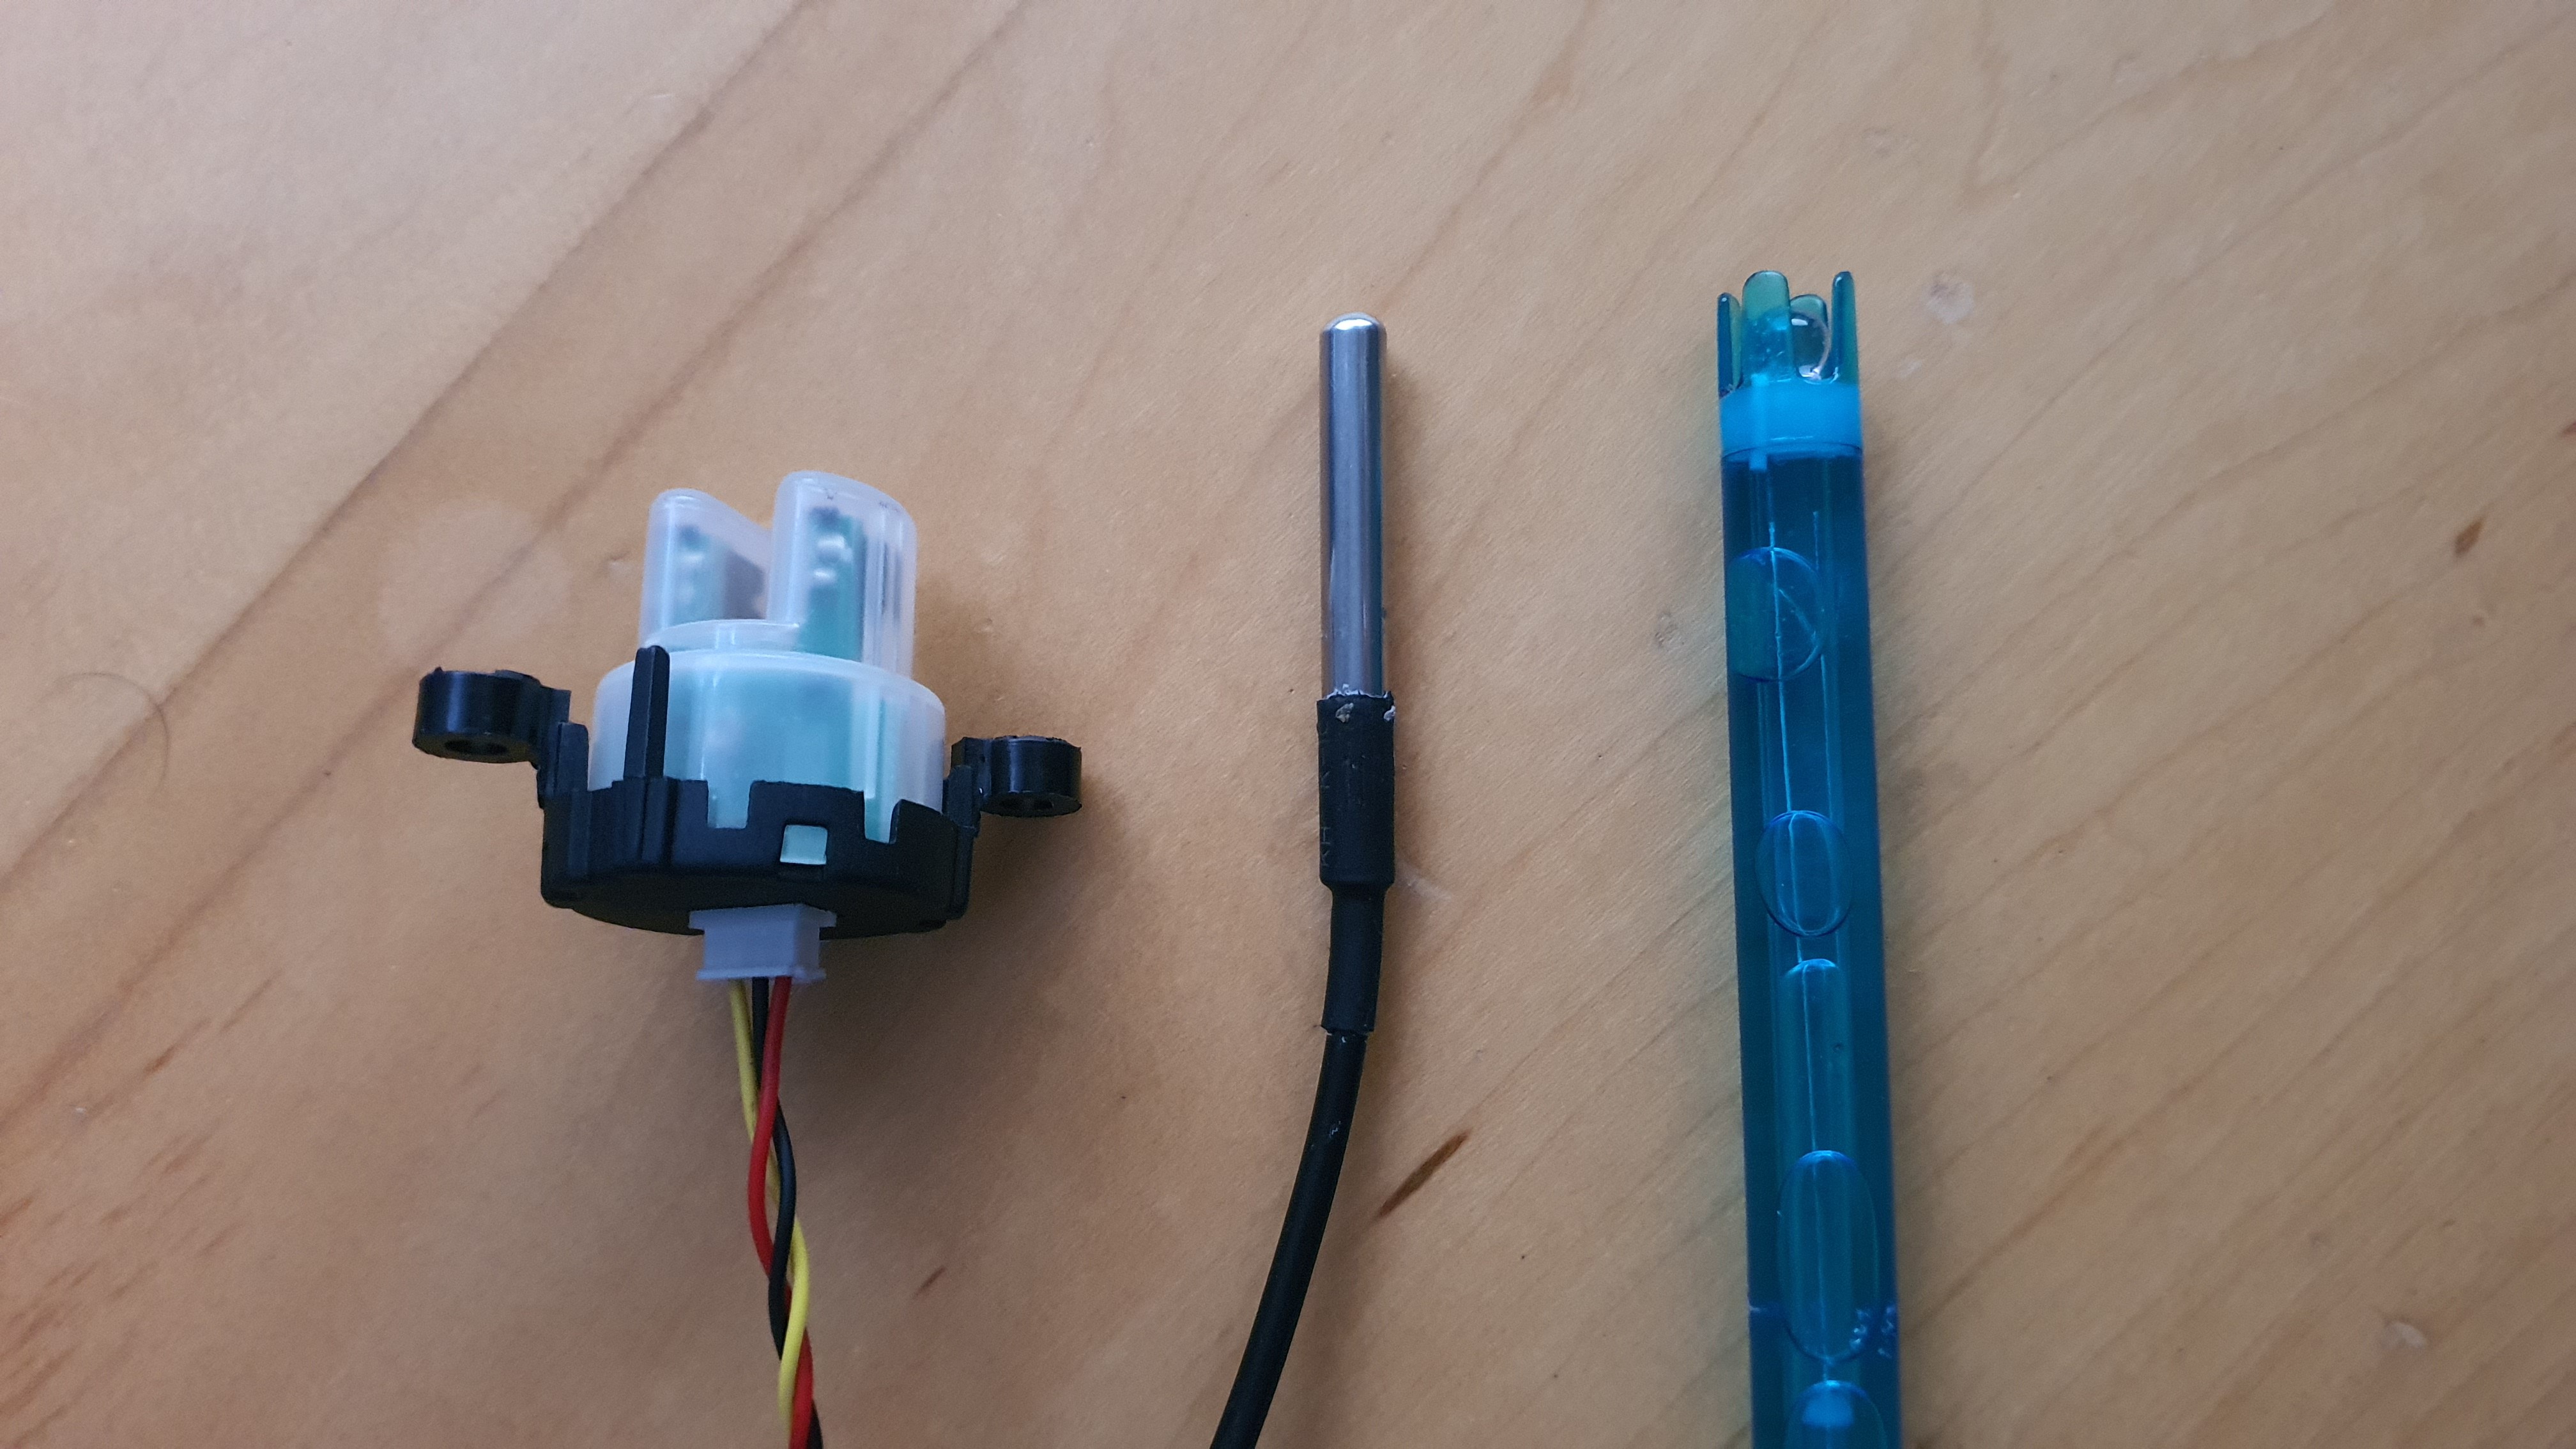
| Water Turbidity Sensor | Amount of suspended, insoluble particles (in mg) in water per litre | NTU (Nephelometric Turbidity Units) |
| Water Temperature Sensor | The temperature of the water (2cm below surface) | Degrees Celsius |
| GY 21 Temp and Humidity Sensor | Temperature and humidity of atmosphere | Degrees Celsius and percentage respectively (where water is 100%) |
All the data collected is relevant and significant in measuring the overall quality of the water. As previously mentioned, a balance between volume of data and battery life must be reached. It would not make sense to only measure temperature and humidity (as this data does not mean much on its own) but nor would it make sense to include many more sensors as that would impeach the battery life of the device and exponentially increase costs.
Optimal Sensor Values
The optimal values vary greatly by circumstance. This is especially valid for the pH of the water. For example, the average pH of a river is 7.4 while an ocean is around 8.1. If a river that in month x had a pH of 7.5 and in month 2x had 5.6, then it is plausible to say that it was polluted with an acidic substance such as phosphorus fertiliser. This measurement is very significant to deduce the overall quality of the water.
It is easier to judge the water turbidity value. Turbidity is measured by shining a beam of light through a water sample at 90 degrees and measuring the intensity of the scattered light. The light is blocked by insoluble particles suspended in the water, hence the more particles suspended, the greater the turbidity. Turbidity is measured in NTU (Nephelometric Turbidity Units), this measures the quantity of insolubles in water (in milligrams) per 1 litre of water.
Drinking water has a turbidity of anywhere between 0 and 4 ntu. The more polluted the water is with dirt, debris, manure, and/or human waste, the higher the turbidity. Water turbidity is essential for getting the overall water quality.
Finally, the water temperature reading is useless without the atmospheric temperature reading to contrast to (and vice versa). Very seldom are both temperatures the same (the smaller the body of water, the more similar they are). Usually, large bodies of water (seas, oceans) are warmer than the atmosphere during the winter and colder during the summer (because of water’s heat absorption).
But a recent Harvard University study has directly linked differences between water and atmospheric temperature to oxygen levels in the body of water. Oxygen becomes lighter when heated and becomes heavier when cooled. Using this logic, if the water is warmer than the atmosphere directly above it by a considerable amount (2 degrees up), the oxygen will leave the body of water by slowly rising. Note that if the atmospheric temperature is greater, the opposite effect will not take place.
Bodies of water are home to a vast quantity of life, if they were to be deprived of oxygen, their volume would decrease due to the area not being able to maintain the same volume of life. This means that species may be reduced in size and even endangered and migrations could take place.
Calibrating the Sensors
All sensors offer precise readings and are suitable for long term exposure. It is recommended that all sensors be replaced every 12 to 16 months of staying in the field to ensure their precision.
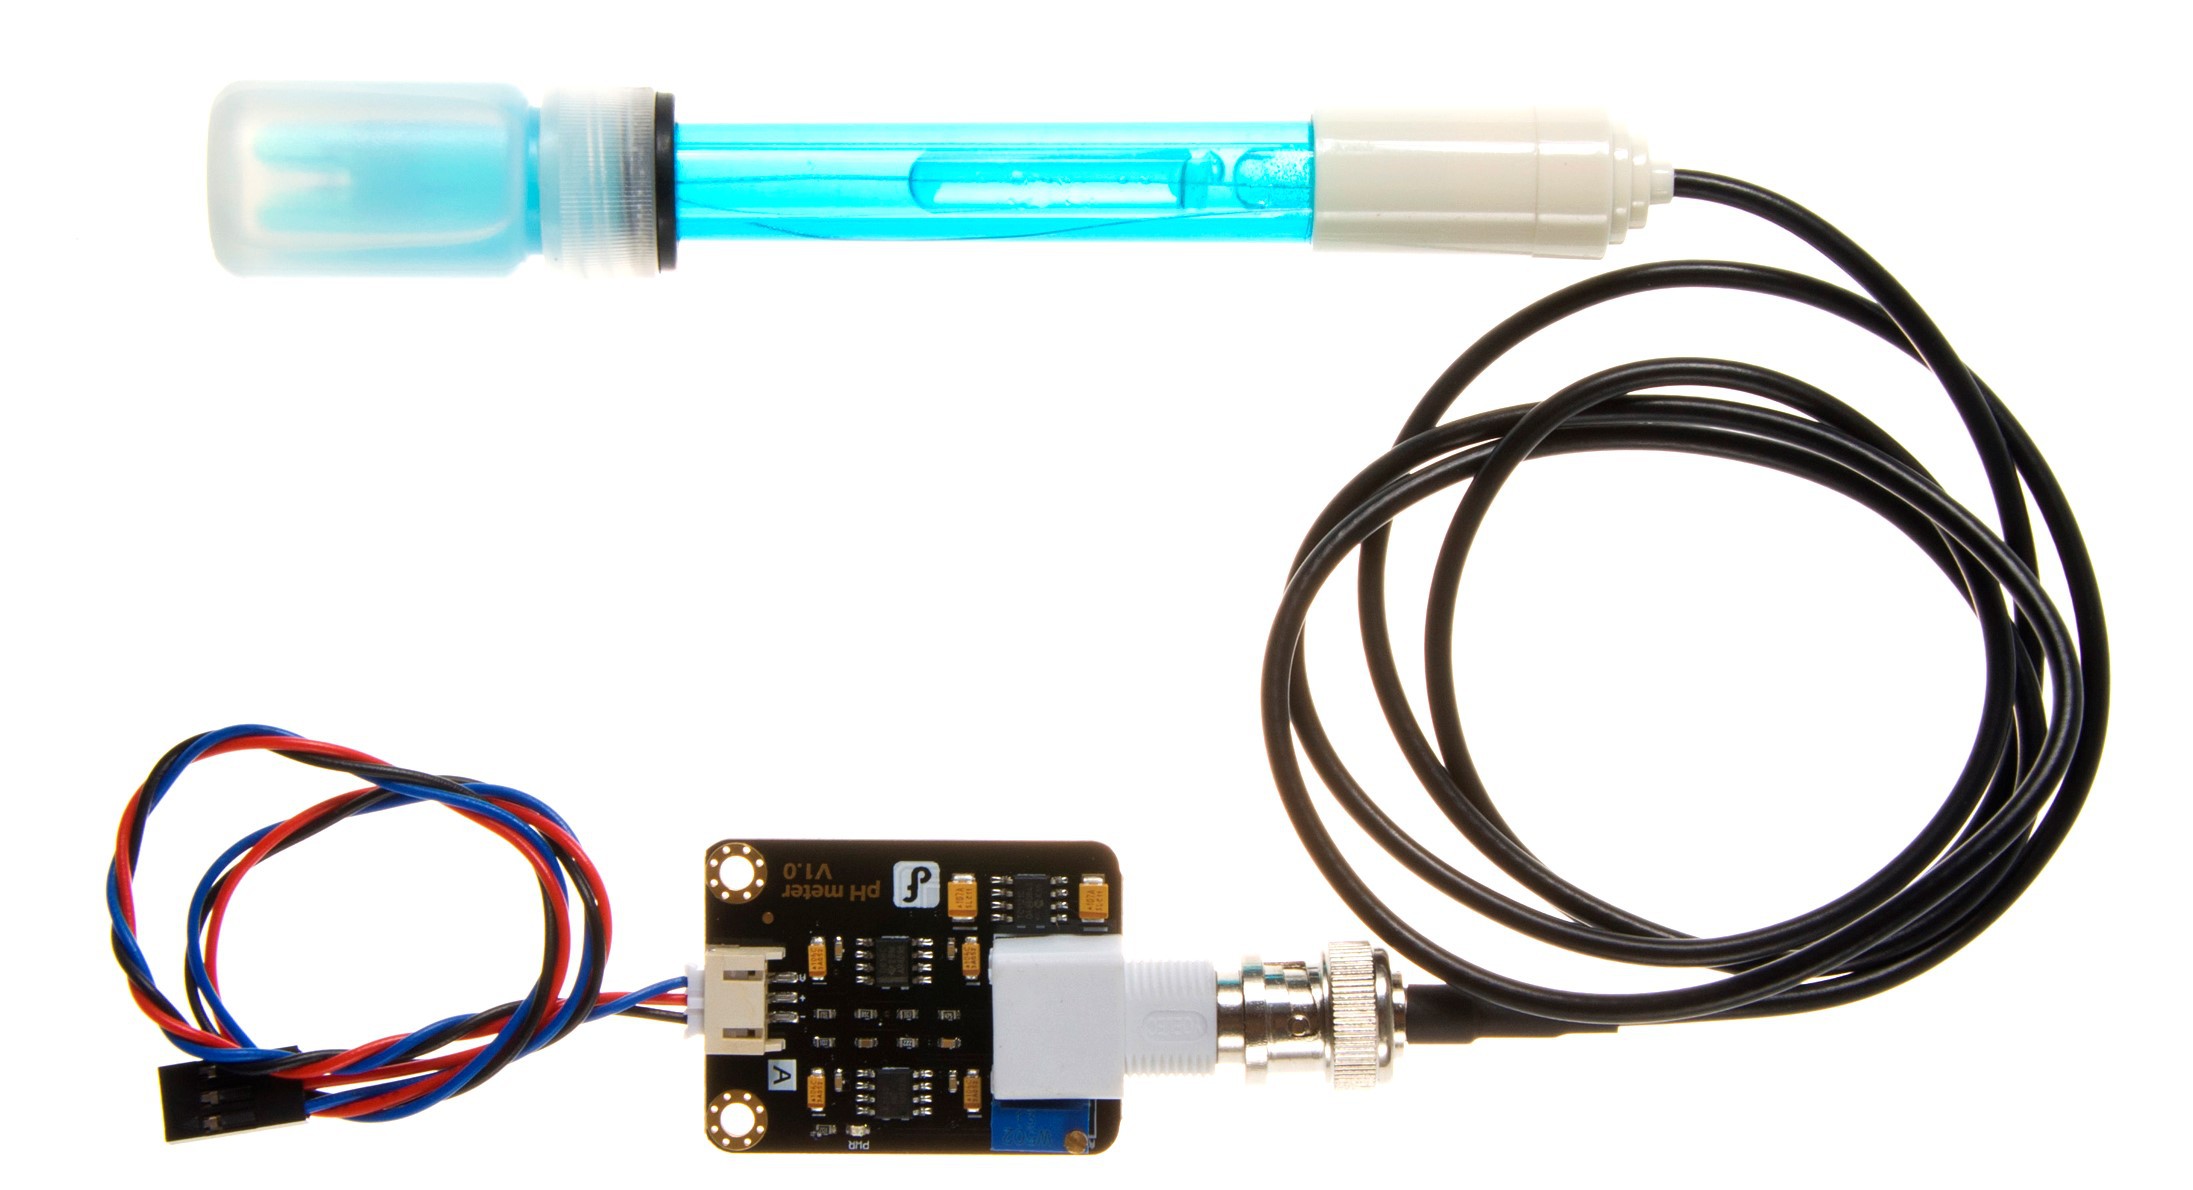
All sensors come calibrated out of the box bar the water pH sensor. It is essential that this sensor is calibrated every 5 to 6 months to ensure its precision. The steps below reflect the recommendations provided by DF Robot.
- Clean the probe and ensure it is dry.
- Place the tip of the probe in the small container it comes with filled with distilled water (pH 7).
- Change the phCalibration variable found in UnifiedWater/configure.h to 0.
- Wait for around 10 minutes, run the code, and see what value the device posted to IoT Central for pH.
- Set the variable phCalibration to the difference between 7 and the value sent.
Processing the Data
The device collects the data from the sensors at an interval of time defined by the user in IoT Central (see lower down for details). The device will query data from the pH sensor and turbidity sensor a defined number of times at intervals of 1 second to eliminate any outlier data and average the values (this exponentially increases the precision of the readings).
The data is then stored locally until it is sent to IoT Central thereafter being deleted.
Device Modes
This section will detail the two operating modes of the device. As previously mentioned, the device can operate in two modes making it extremely flexible under multiple use cases. These modes are described below.
Personal Mode
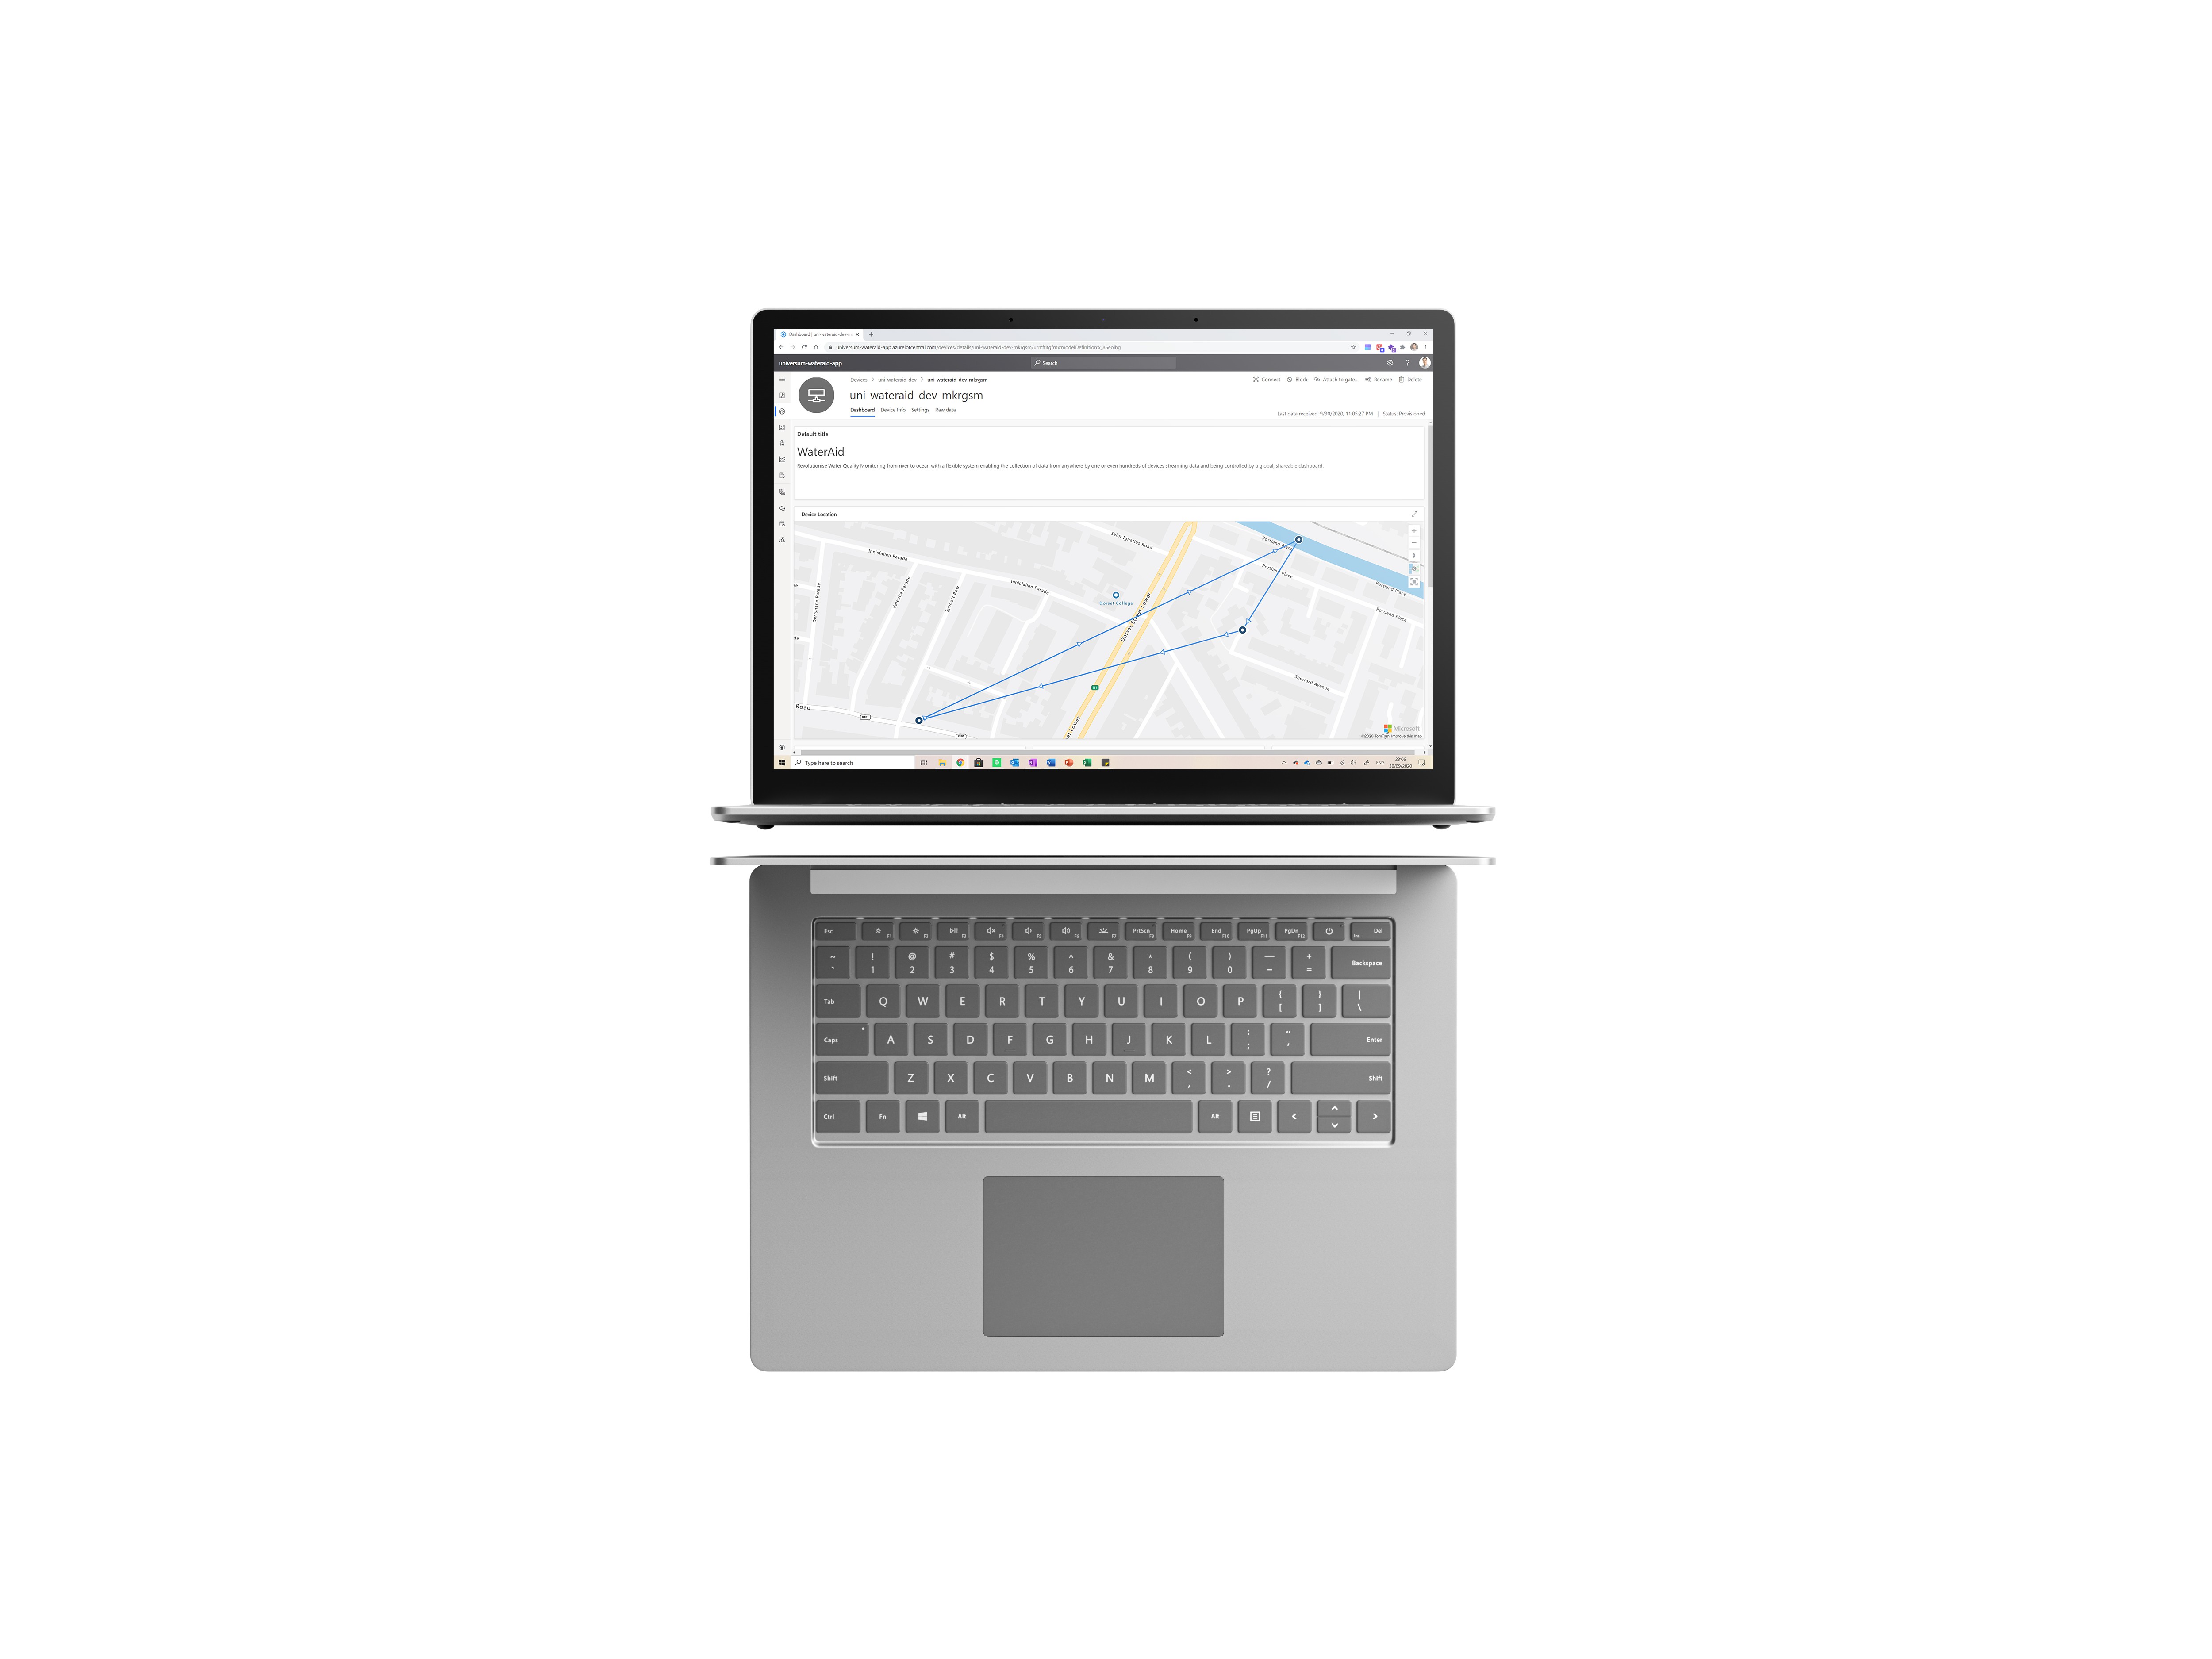
This is what sets the project out from its competitors. In personal mode, the device can be carried around by a surveyor as opposed to being fixed in a location. The surveyor can submerge the sensors in water, press a button and collect the data from the specific point. The data is then sent to the backend tied with the geolocation of the reading and potted on a map.
This mode is very useful because it allows multiple points along a stream, sea, or ocean to be measured with a single device. The device can be attached to a boat for example and set to take samples at periods of time, hence tracking the water quality as the boat sails and sending it to the cloud via GSM.
The device can also be manually handled by a surveyor tasked with collecting water quality readings at different points on a stream for a monthly report. The surveyor would travel the stream monthly, submerging the device at different points.
The use cases are endless. Multiple teams could be sent with such devices after an oil leak to see where the effects are worse and prioritise action. The device can be taken on a hiking trip to see if water in streams is drinkable.
This allows for inexpensive, robust monitoring whenever it is needed.
Enterprise Mode
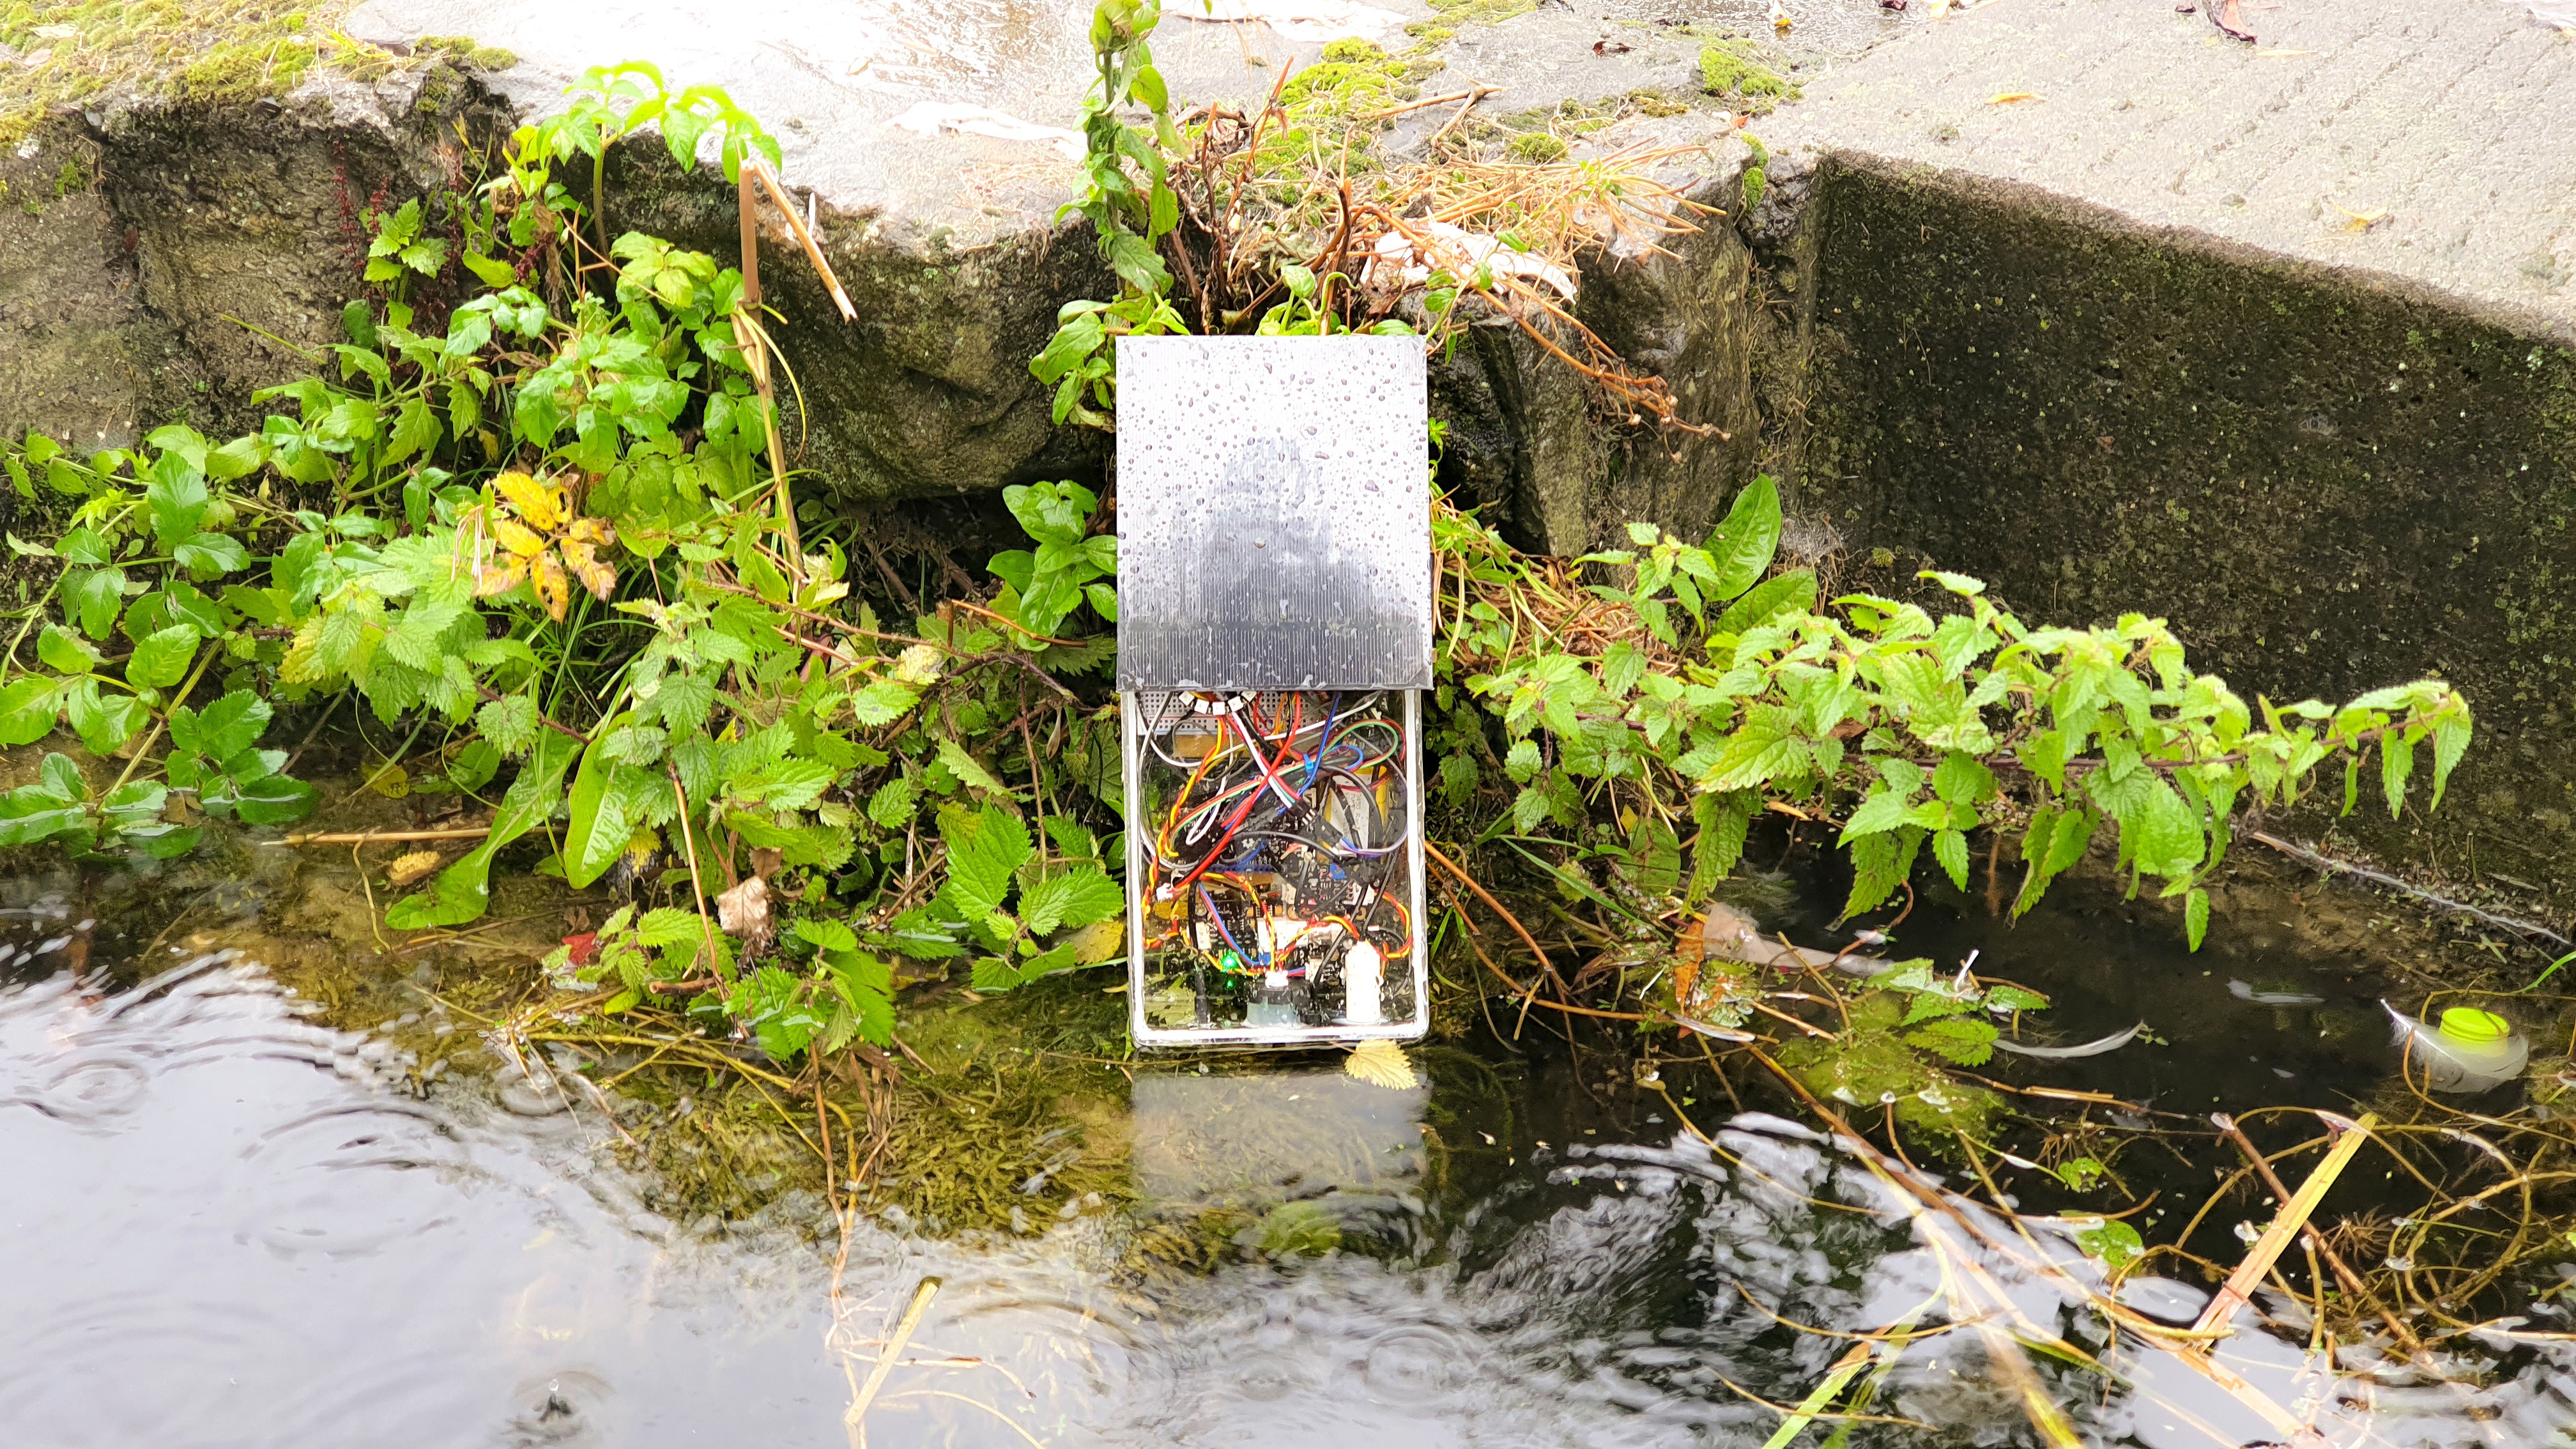
Enterprise mode allows for the device to be fixed in a specific location and collect data and send it to the cloud at defined intervals of time. Tens or hundreds of devices can be fixed at different points along a stream, sea, or dock to measure the water quality in those respective places.
The data from all devices can be visualised as a whole or individually in the dashboard. This mode has endless use cases. A series of devices can be implemented temporarily along a polluted stream to identify the exact point where the pollution originates and take action. Devices can be placed along a dock where boats are parked to ensure that none pollute the sea and discover potential leakages before they damage the fauna and flora in the area.
This allows for industry grade efficiency and big data collection allowing authorities and corporations to precisely keep track of pollution in real time in any body of water.
Changing between modes
The best part is that the device’s mode can be changed from the backend with the press of a button. Therefore, if a device has been in personal mode and authorities need it to be fixed in a location because the reading there was anomalous and they wish to investigate, all they have to do is press a button and the device will switch from collecting data when instructed to collecting at adjustable intervals of time.
Getting the Geolocation and Time
The device uses GNSS to get its location. Because it operates on GSM, the module also allows it to query the precise location from the cell tower. Note that the device is aware of its location both in personal and enterprise mode but only reports it to IoT Central in personal mode (because it is fixed in enterprise mode).
The device is also aware of the time by synching its onboard RTC to satellite time every time it reboots. This ensures that the device is always aware of the current time for signing certificates for IoT Central and parsing data.
Note that if the geolocation from the cell tower is not precise, a GPS module can be attached to the device (adding only €5 to the BOM). This will offer pinpoint accuracy at all times.
User Feedback
The device is equipped with a neopixel ring (which is 16 LEDs arranged in a circle). This ring is used for feedback in personal mode so the surveyor can keep track of what the device is currently doing. Below is a table with the significance of different LED colours.
| LED Position/Colour | Significance |
| Loading white | Device is booting up and preparing everything |
| Loading blue | Device is collecting sensor data |
| Fast load blue then wait | Acknowledgement that the button is pressed, and device should be placed in water |
| Loading green | Device is sending data to IoT Central |
| Loading purple | Device is receiving twin changes from IoT Central |
| Flashing/Loading Red | Device error. If flashing or staying red, reboot device and try troubleshooting by connecting to computer and turning the serial monitor on. |
GSM and Hologram
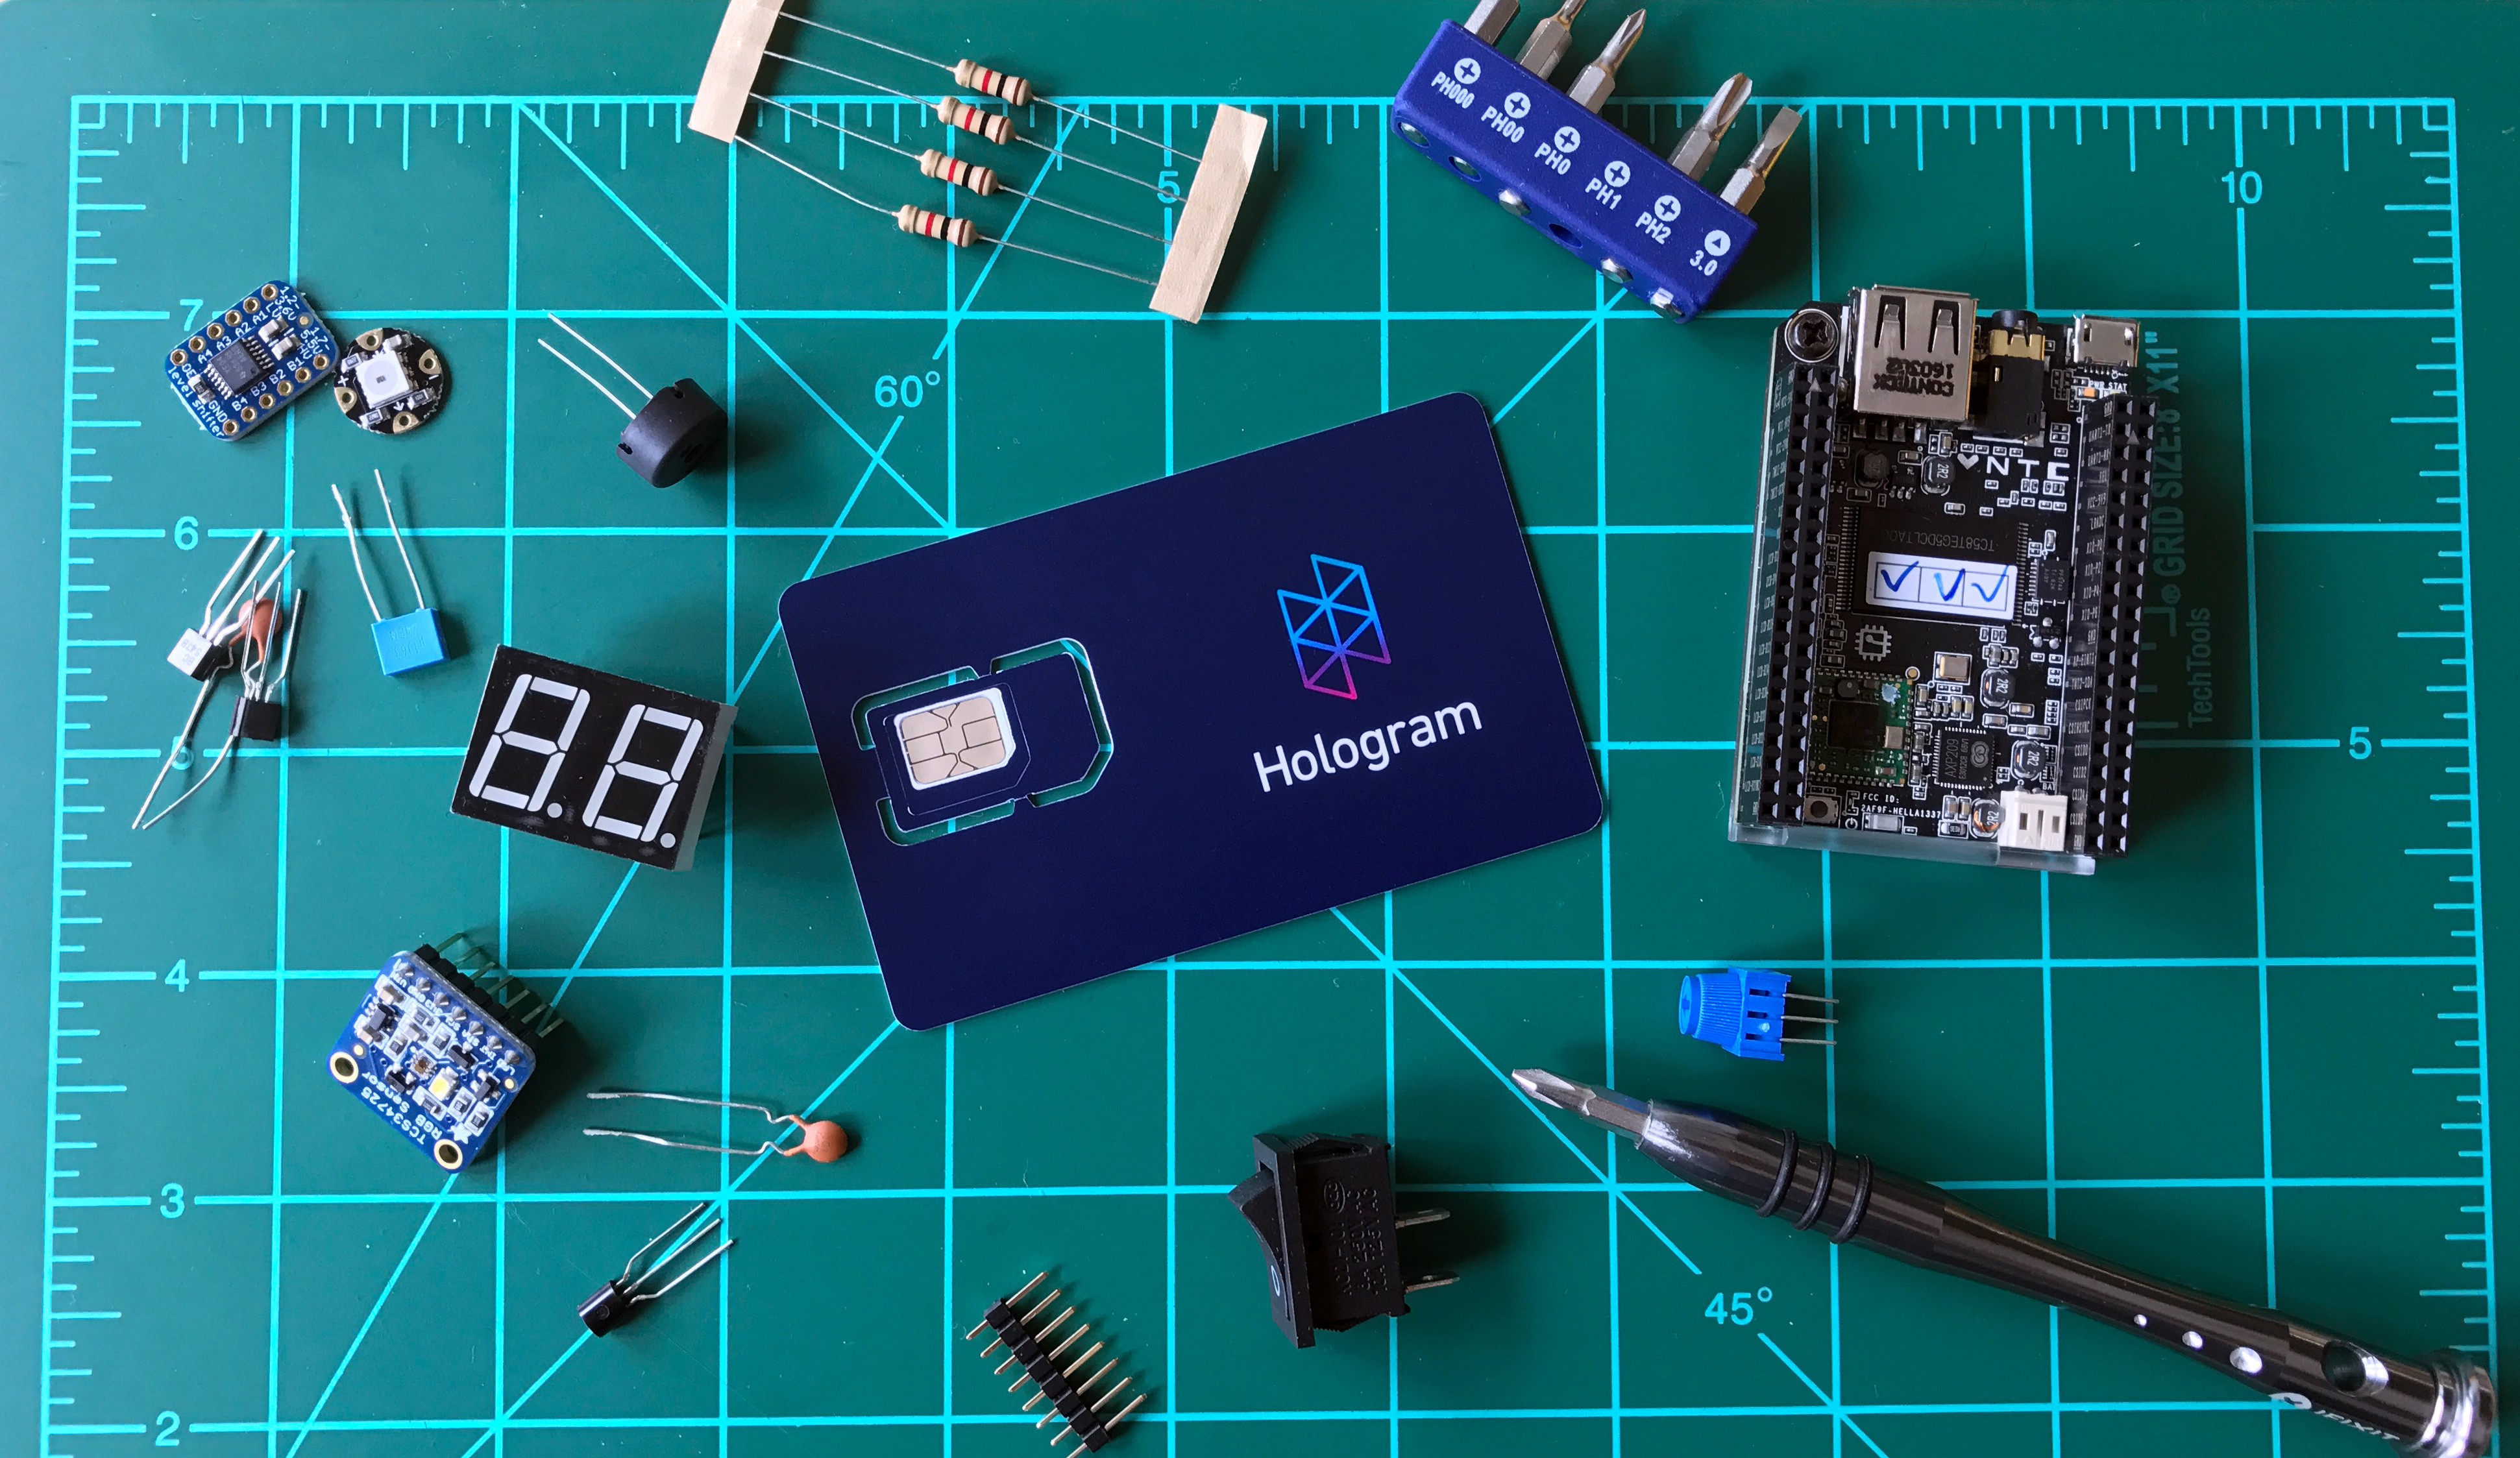
GSM connectivity is used in the case of the project because of its wide availability across the majority of the world. This allows the project to work in most areas without a problem. Hologram was chosen as the sim provider because of the monitoring it allows in the backend. You can see exact usage of data as well as precise and affordable billing. The service also scales very well.
Azure IoT Central
When refactoring the project, the largest change I decided to make was use IoT Central. I did this for a wide range of reasons. IoT Central is industry standard when it comes to IoT management in the cloud and is created by Microsoft. This service is extremely reliable and can handle vast quantities of data streamed by thousands of devices, the services also scale very well and are very cost effective.
The standard pack comes with 2 free devices (with $0.40 per device thereafter) and 5,000 messages (with $0.015 per thousand messages thereafter). Hence, monitoring a long river with 100 devices would cost only €40 a month to operate in IoT Central.
The other reason IoT Central is so great is device twins. These are parameters that are synced in the cloud and on the device. They are different from telemetry data – which is sensor data reported by the device to the cloud because both the device and backend sync the values between them.
Sending Telemetry to IoT Central
In enterprise mode, there are different timers set for collecting and sending telemetry to the backend. The device sends all messages to the backend in JSON messages and encrypts them using bit64 encryption.
In personal mode, the device will send the sensor readings and geolocation as telemetry directly after the data was collected. The table below shows the data sent as telemetry and in which mode it is sent.
| Data Sent | Mode Sent in |
| Atmospheric Temperature | Both |
| Atmospheric Humidity | Both |
| Device Geolocation | Only in personal |
| Water pH | Both |
| Water Temperature | Both |
| Water Turbidity | Both |
All communication is based on libraries provided by Microsoft for Arduino devices to connect to IoT Central. All libraries are open source.
Sending Properties to IoT Central

Device properties are different from telemetry data. These are pieces of information about the software or firmware of the device that are being sent to the backend. Twin properties are a special type of properties which are changeable by the user in the dashboard. These properties are then synced with local variables on the device enabling remote control over different device parameters. A table of all device twins and their roles on the device is below.
| Twin property | Role |
| Device Mode | Allows the user to switch between enterprise and personal mode remotely by clicking a button |
| Telemetry Send Interval | The interval at which data collected by the device is sent to the backend |
| Data Collection Interval | The interval at which the device collects data (not applicable in low power mode) |
| Property Send Interval | The interval at which the device sends twin properties and location accuracy readings to the backend (not applicable in low power mode) |
| Sample Value | The number of times the pH sensor and turbidity sensor are queried at an interval of 1 second when the device is collecting data (see above for explanation) |
This improves the device’s autonomy because these critical parameters can be set in the backend without the need of persons interfering with devices on the field. This is particularly helpful if vast quantities of devices are being used because instead of having to go out and manually flash different code on these devices in the field, the values can be set via a computer in seconds.

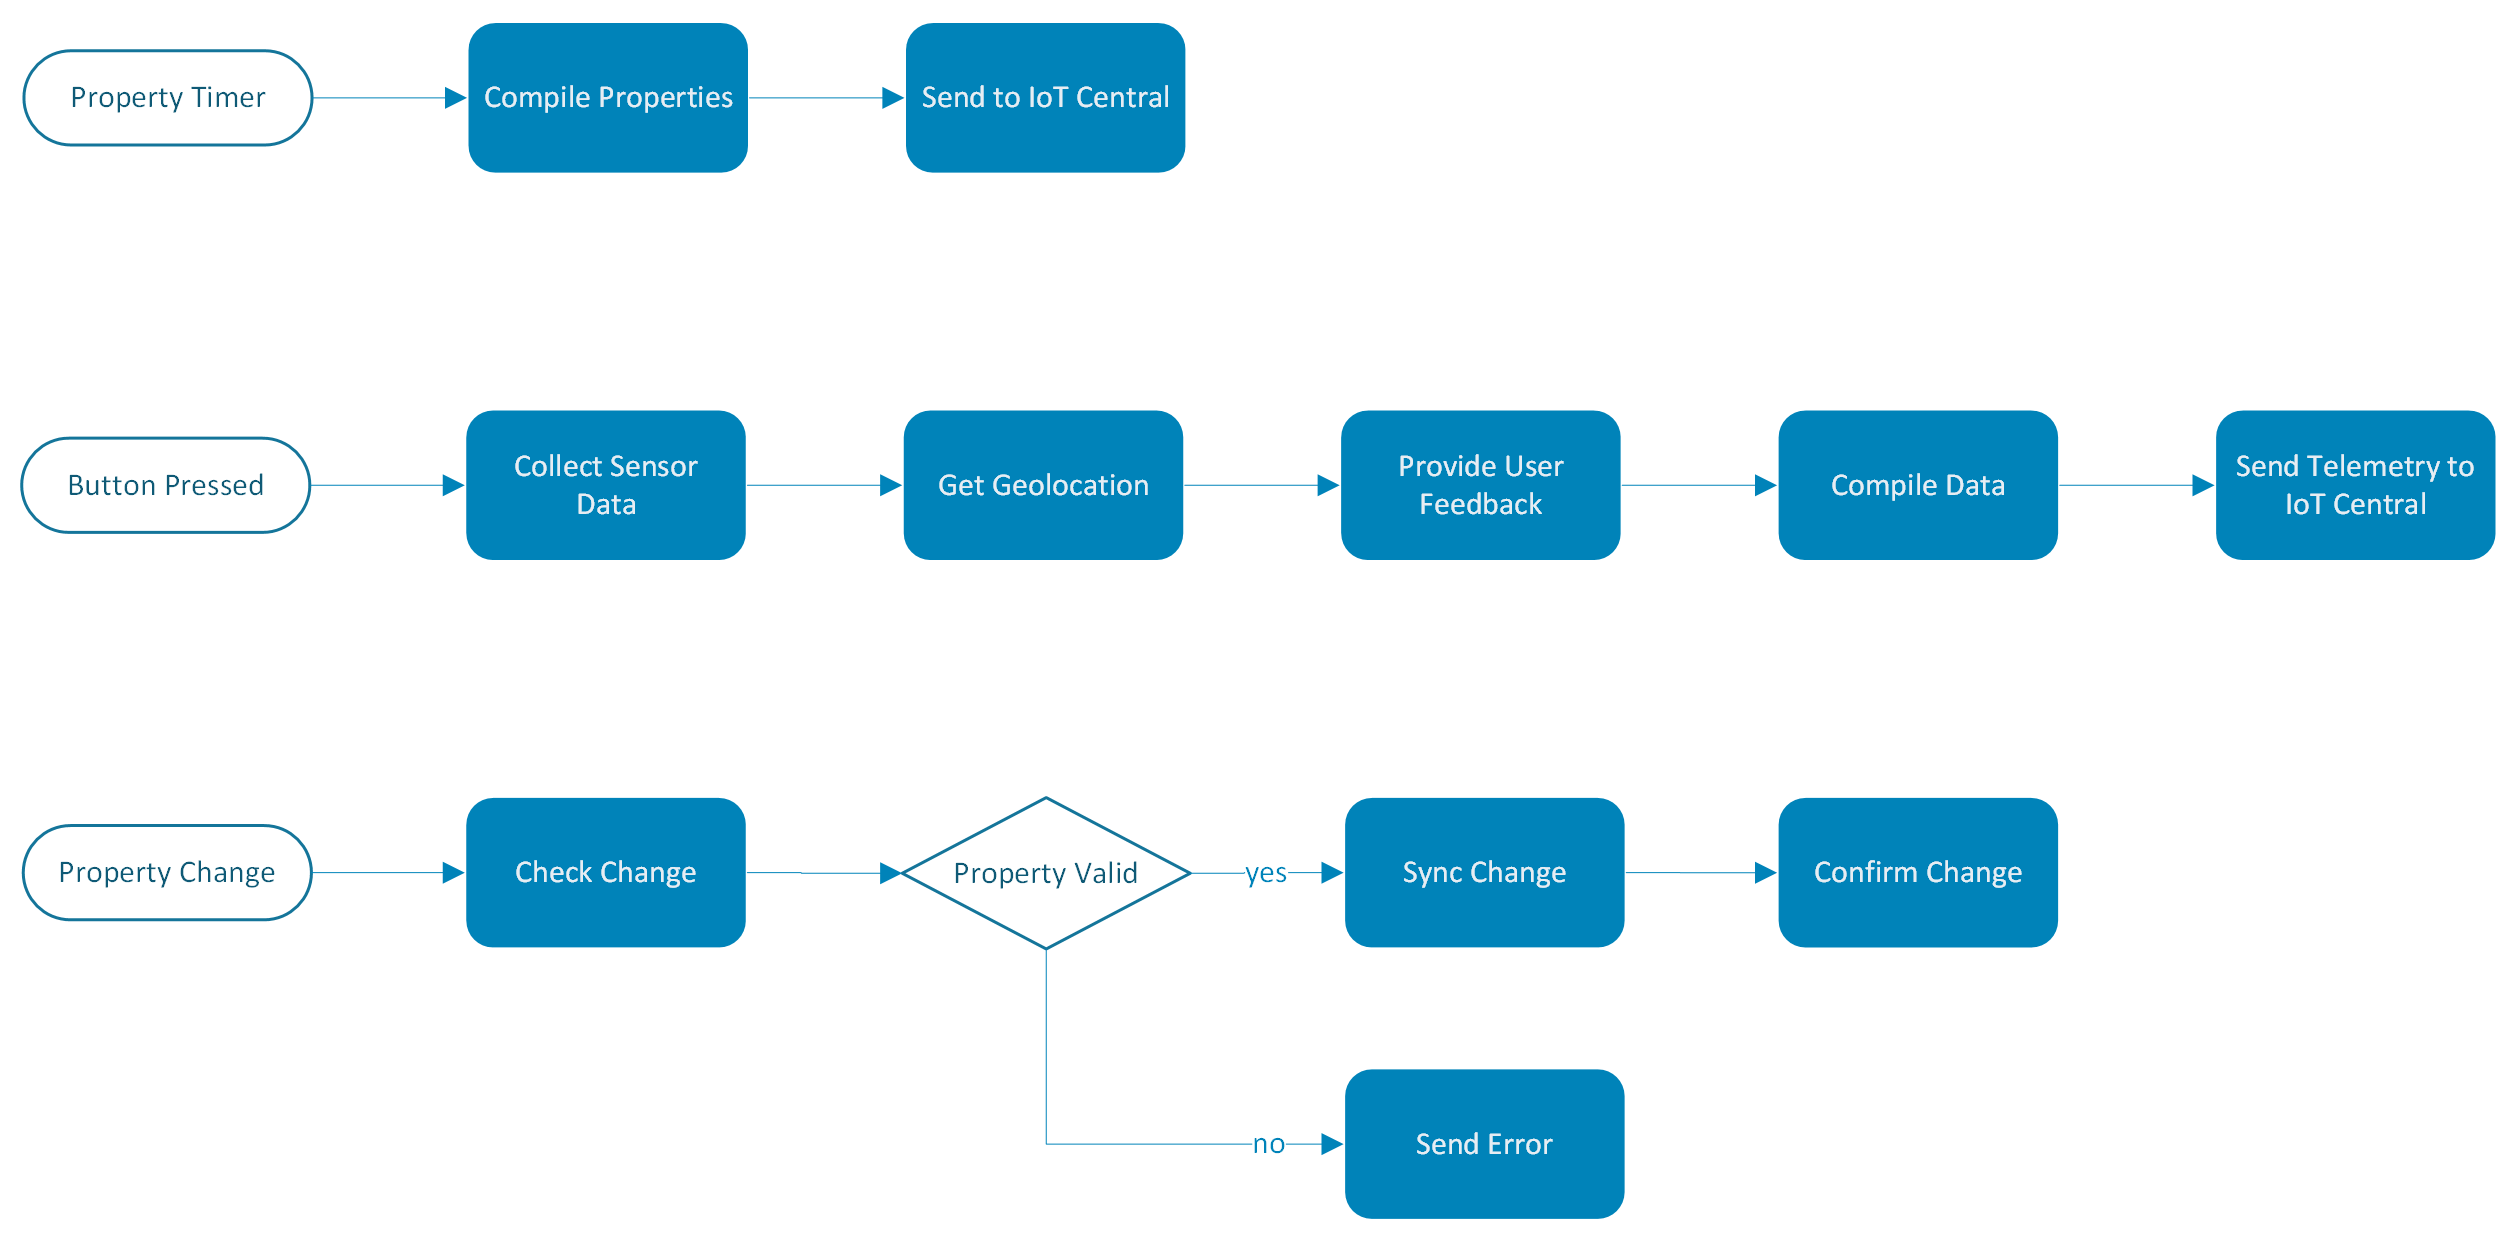
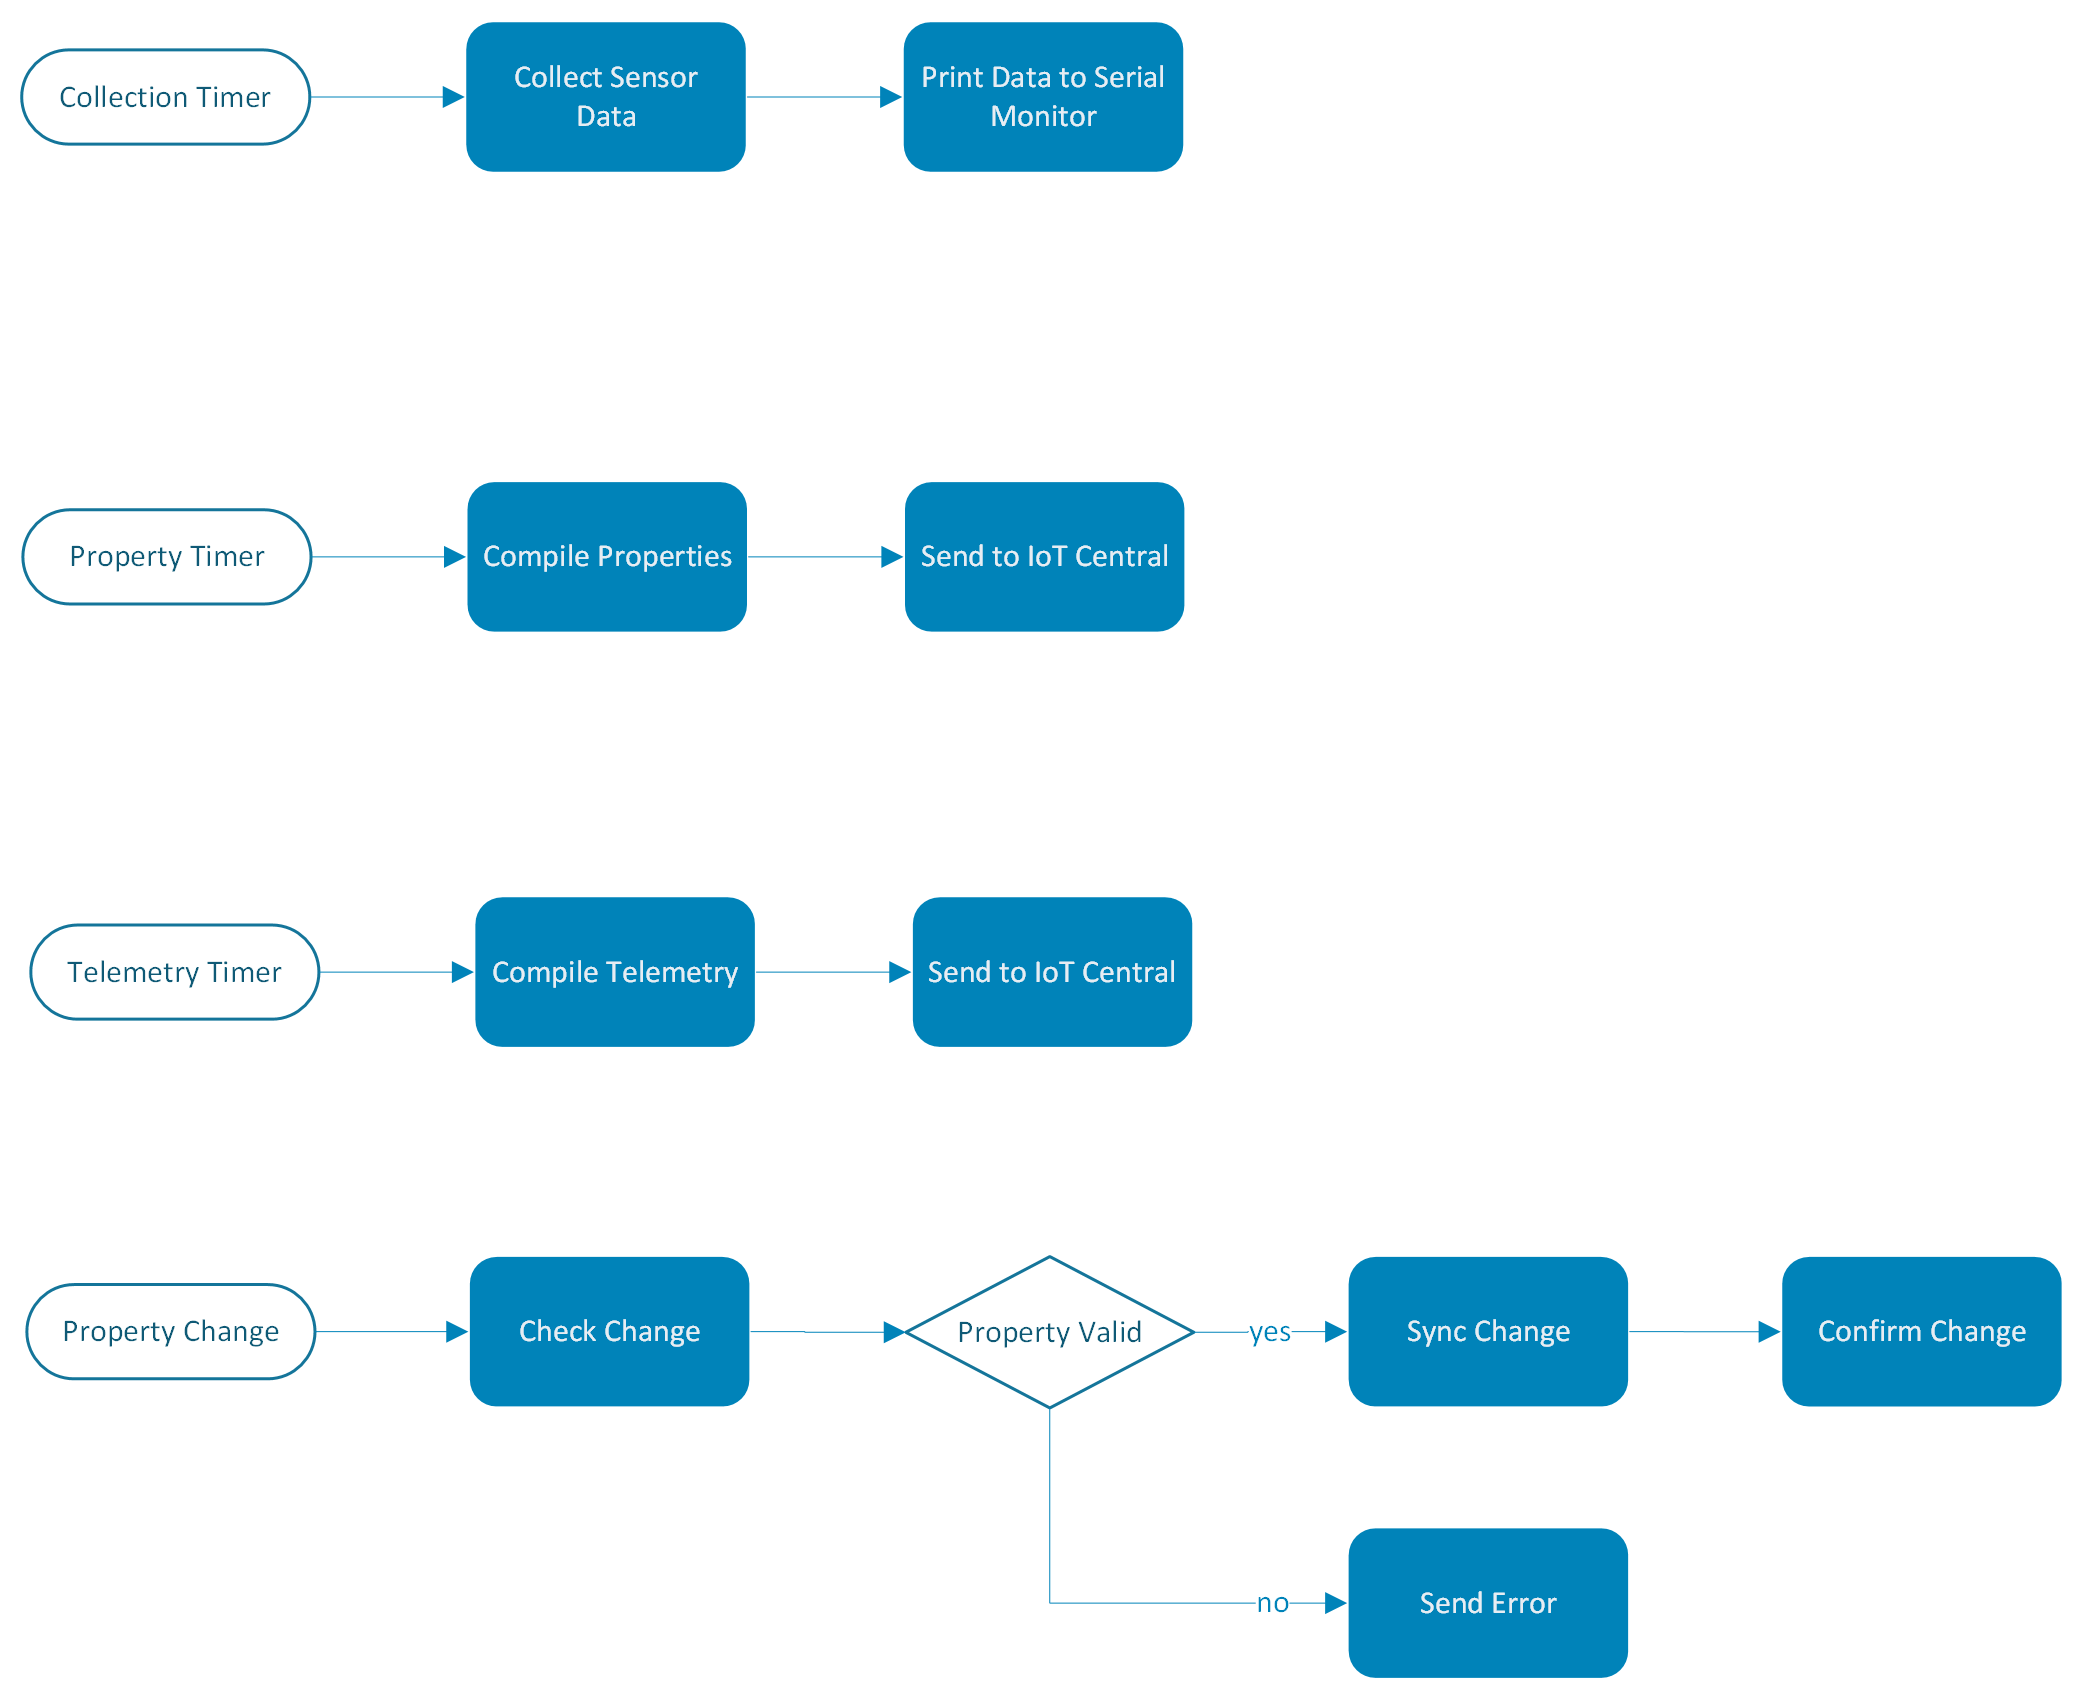
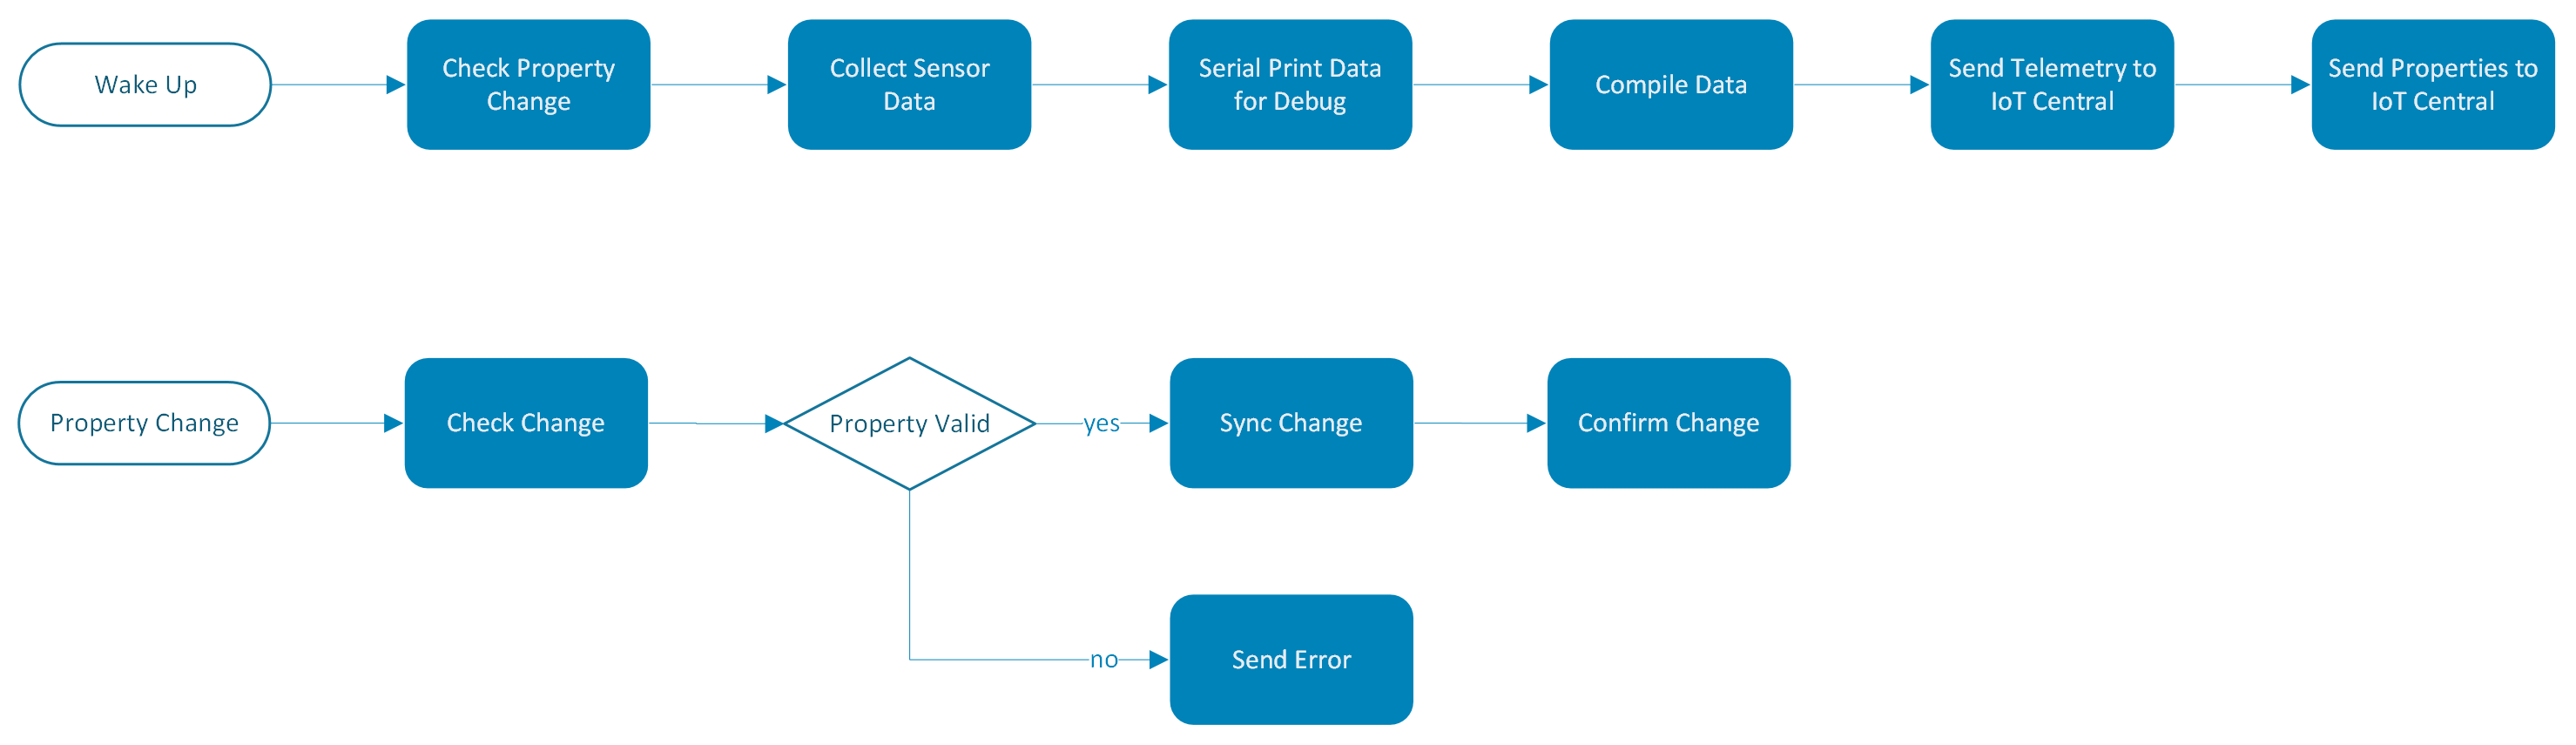
The diagram above shows the way these properties are changed. As seen above, the device will check if there is a change in a twin property at all times (unless in low power mode). When a change is received, the device will check to ensure that the change is valid (for example the correct data type and not too large to hold as a local variable). If the change is valid, it will send back an acknowledgement confirming the change (the change will then show up as applied in the dashboard). If there was an error, an error message will be sent back, and the change will be marked as not confirmed.
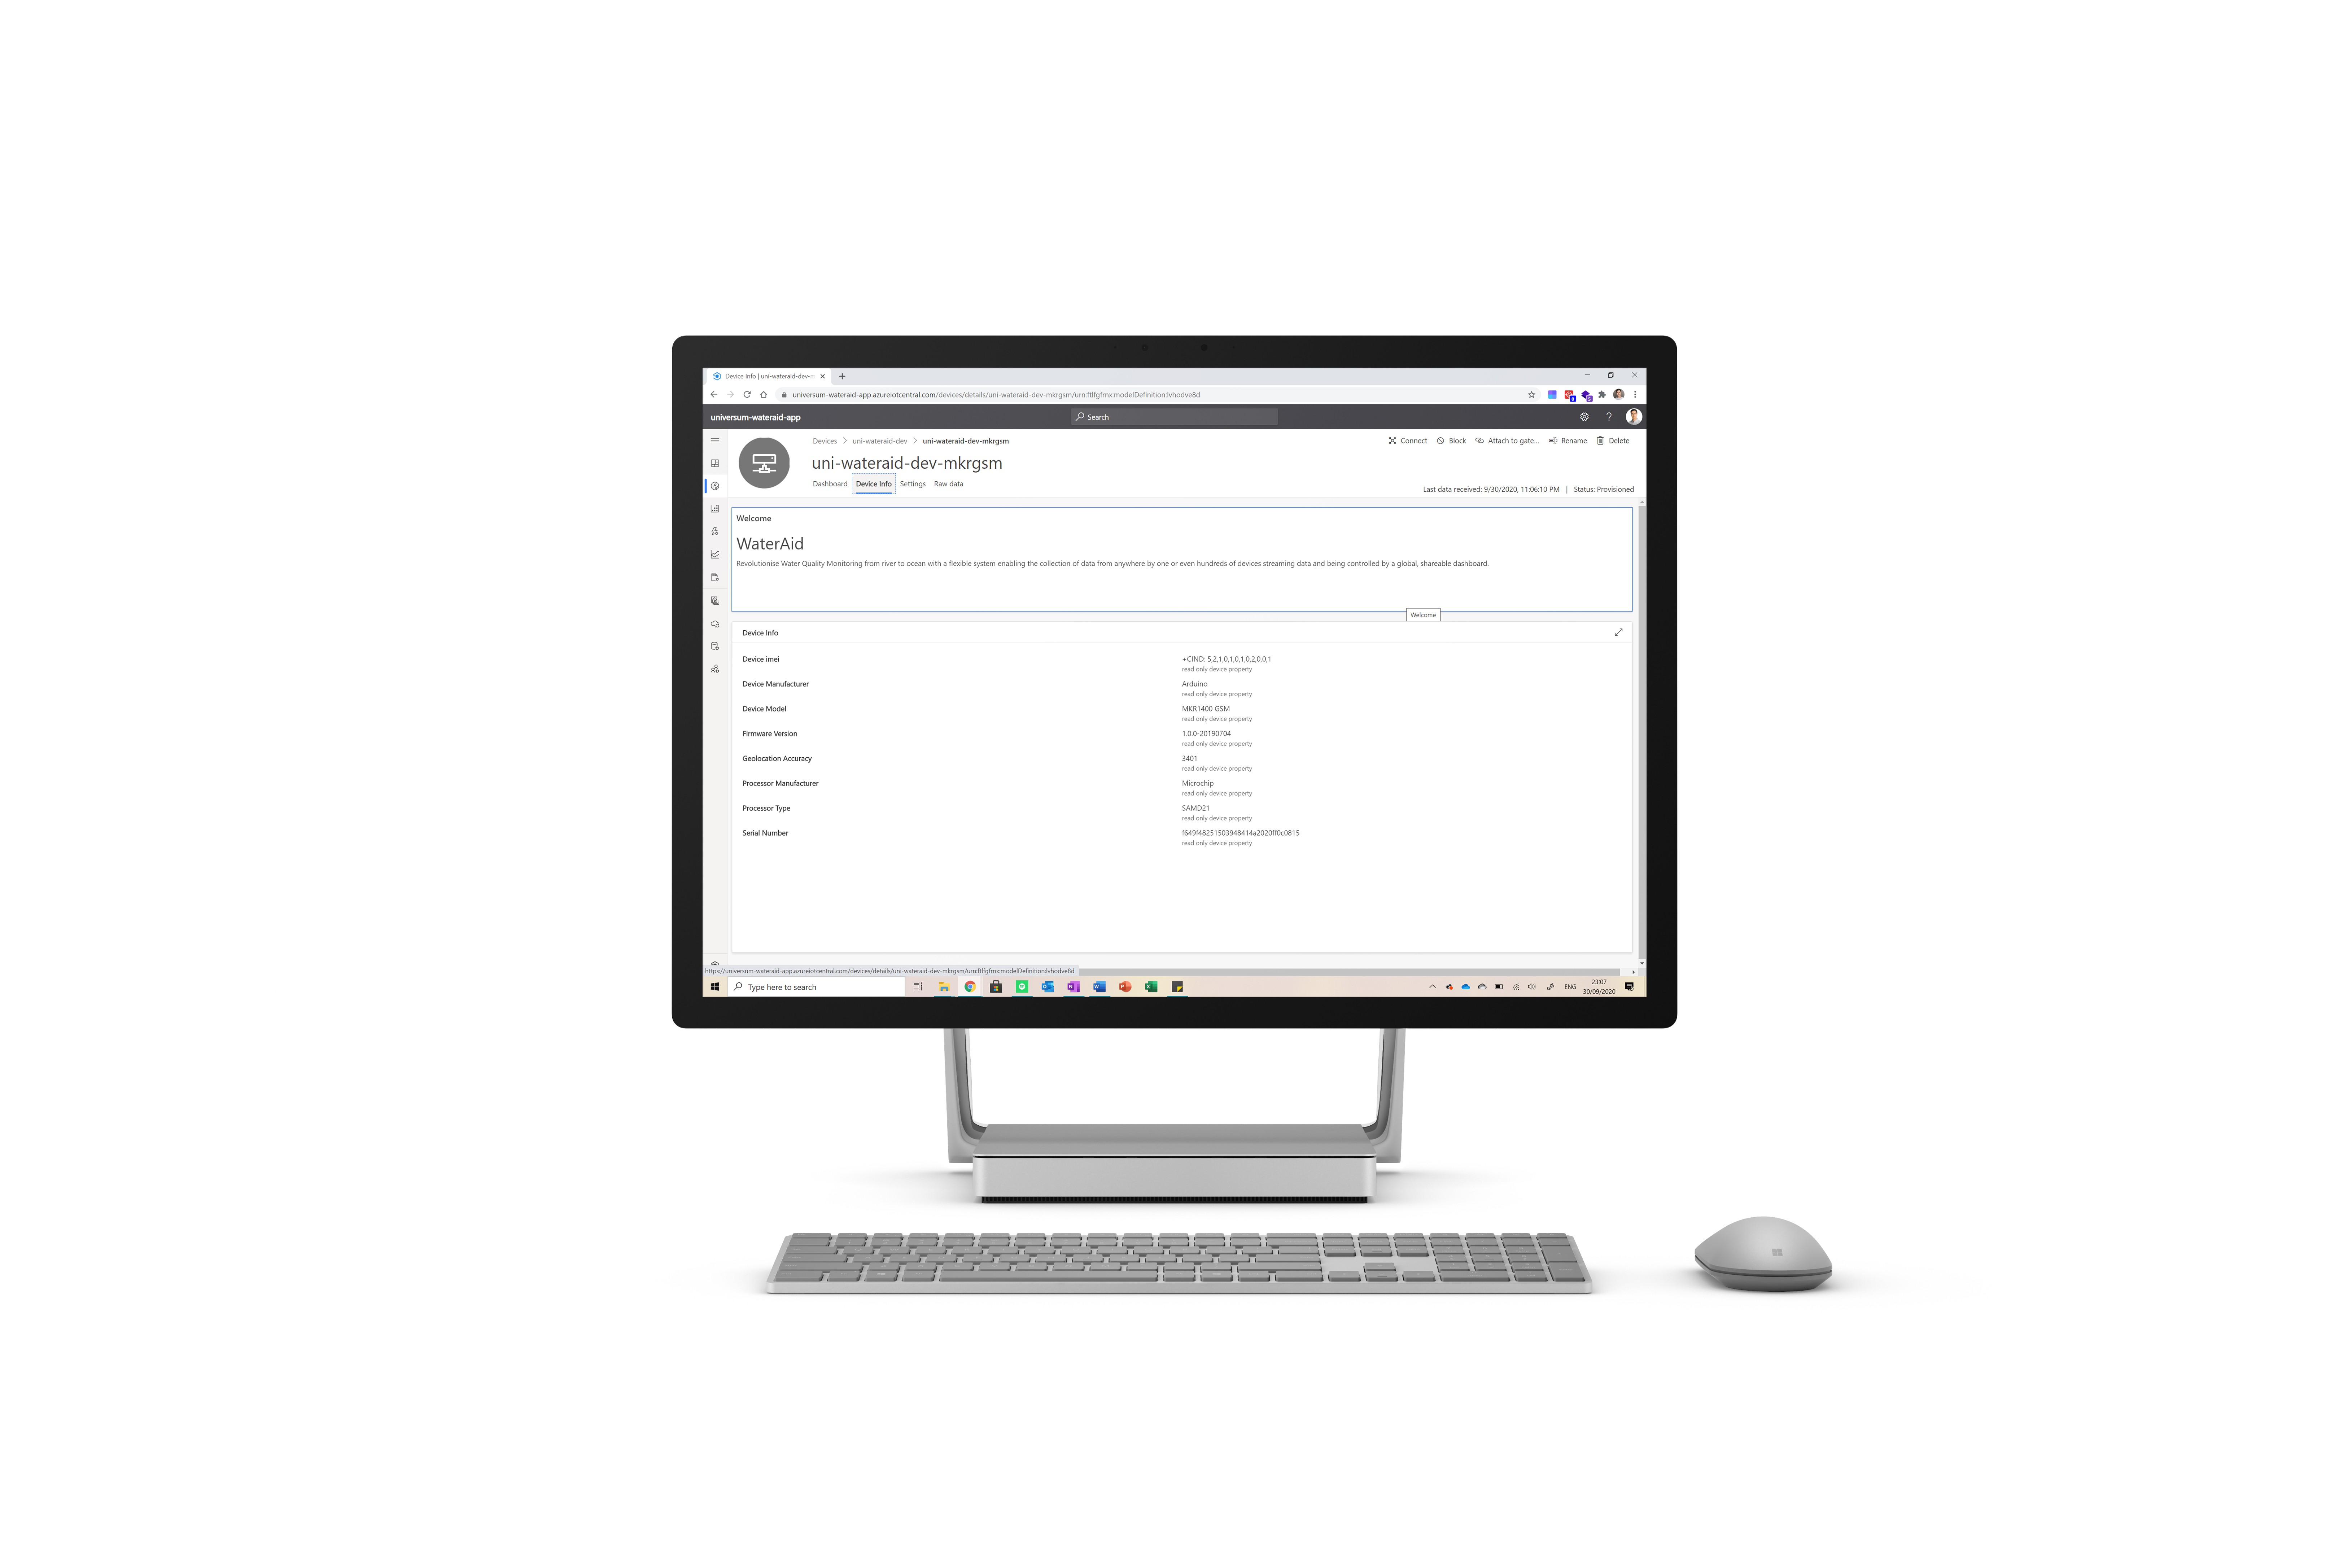
The device also sends constant properties when it boots up. It will send information about the device such as its IMEI, model version and firmware version. This allows the users to view credentials of every device in the backend with the click of a button.
When booting up, the device will sync all its local variables with properties in IoT Central and confirm the setting. This ensures that the device retains the same settings even after restarting or receiving a software update.
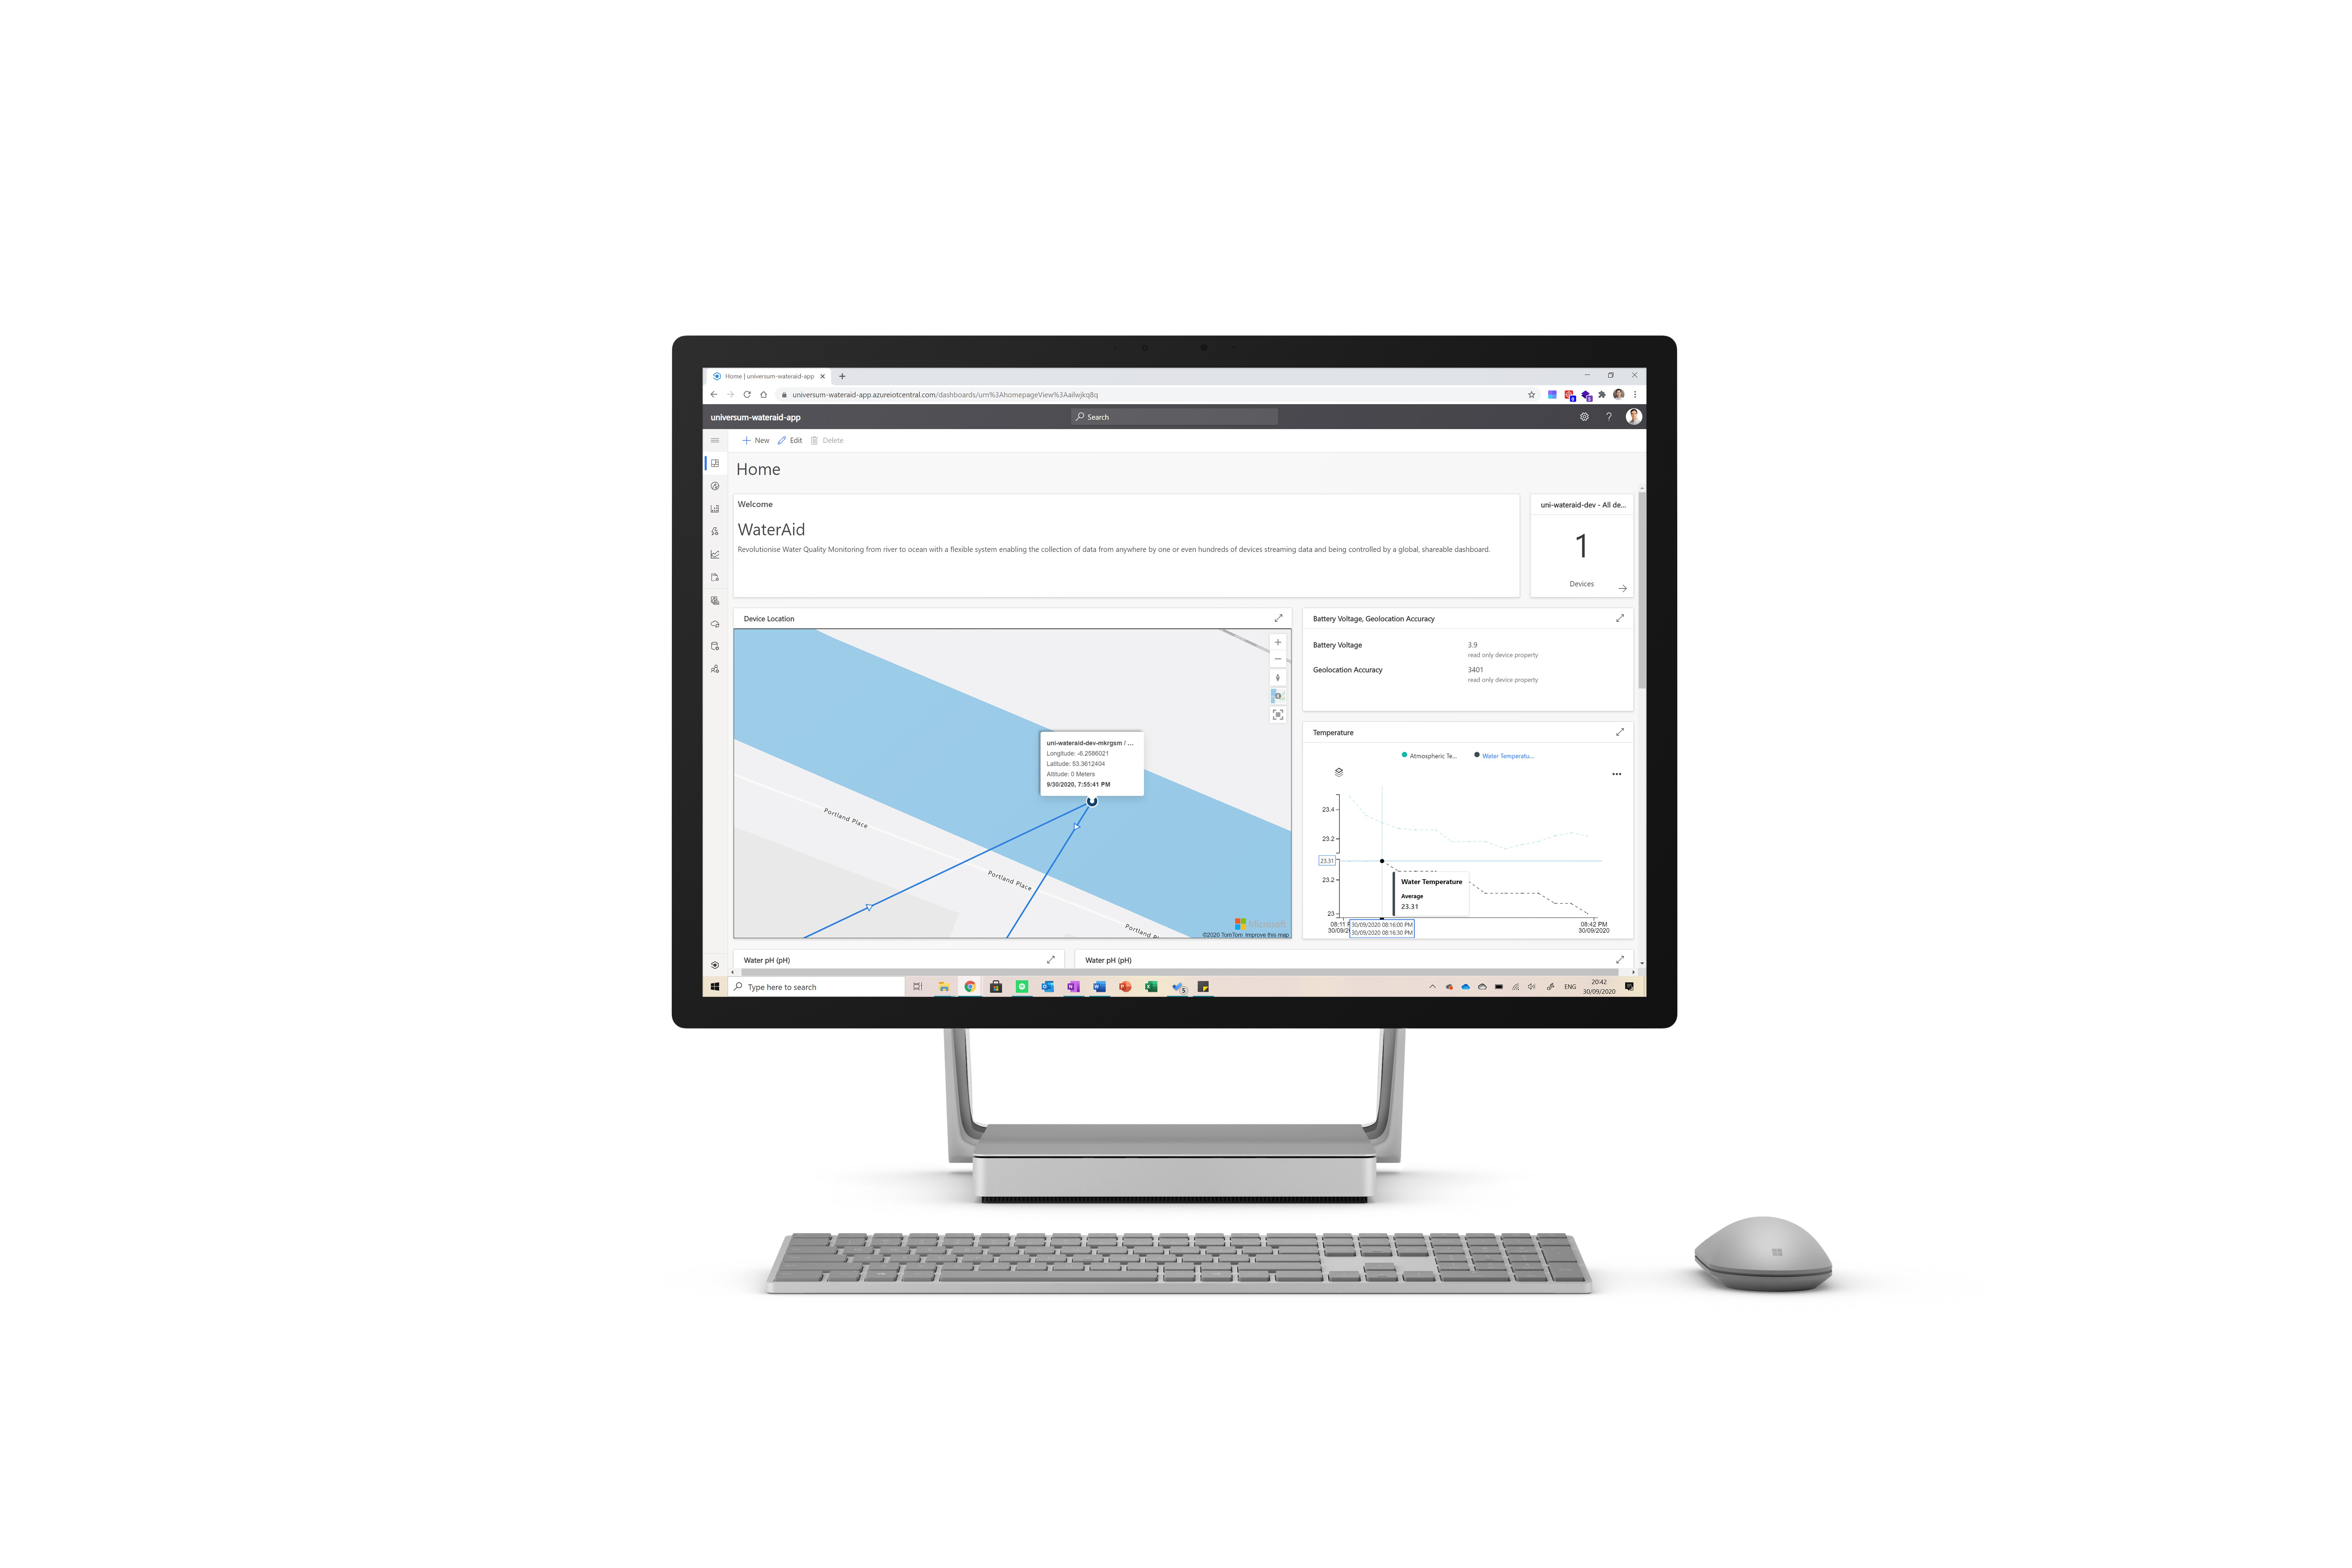
The Dashboard and Device Dashboard
There are two dashboards in the backend to which the users have access to. Note that different roles can be assigned to members allowing them to view only certain sections, control their ability to change twins and prevent them from viewing device details.
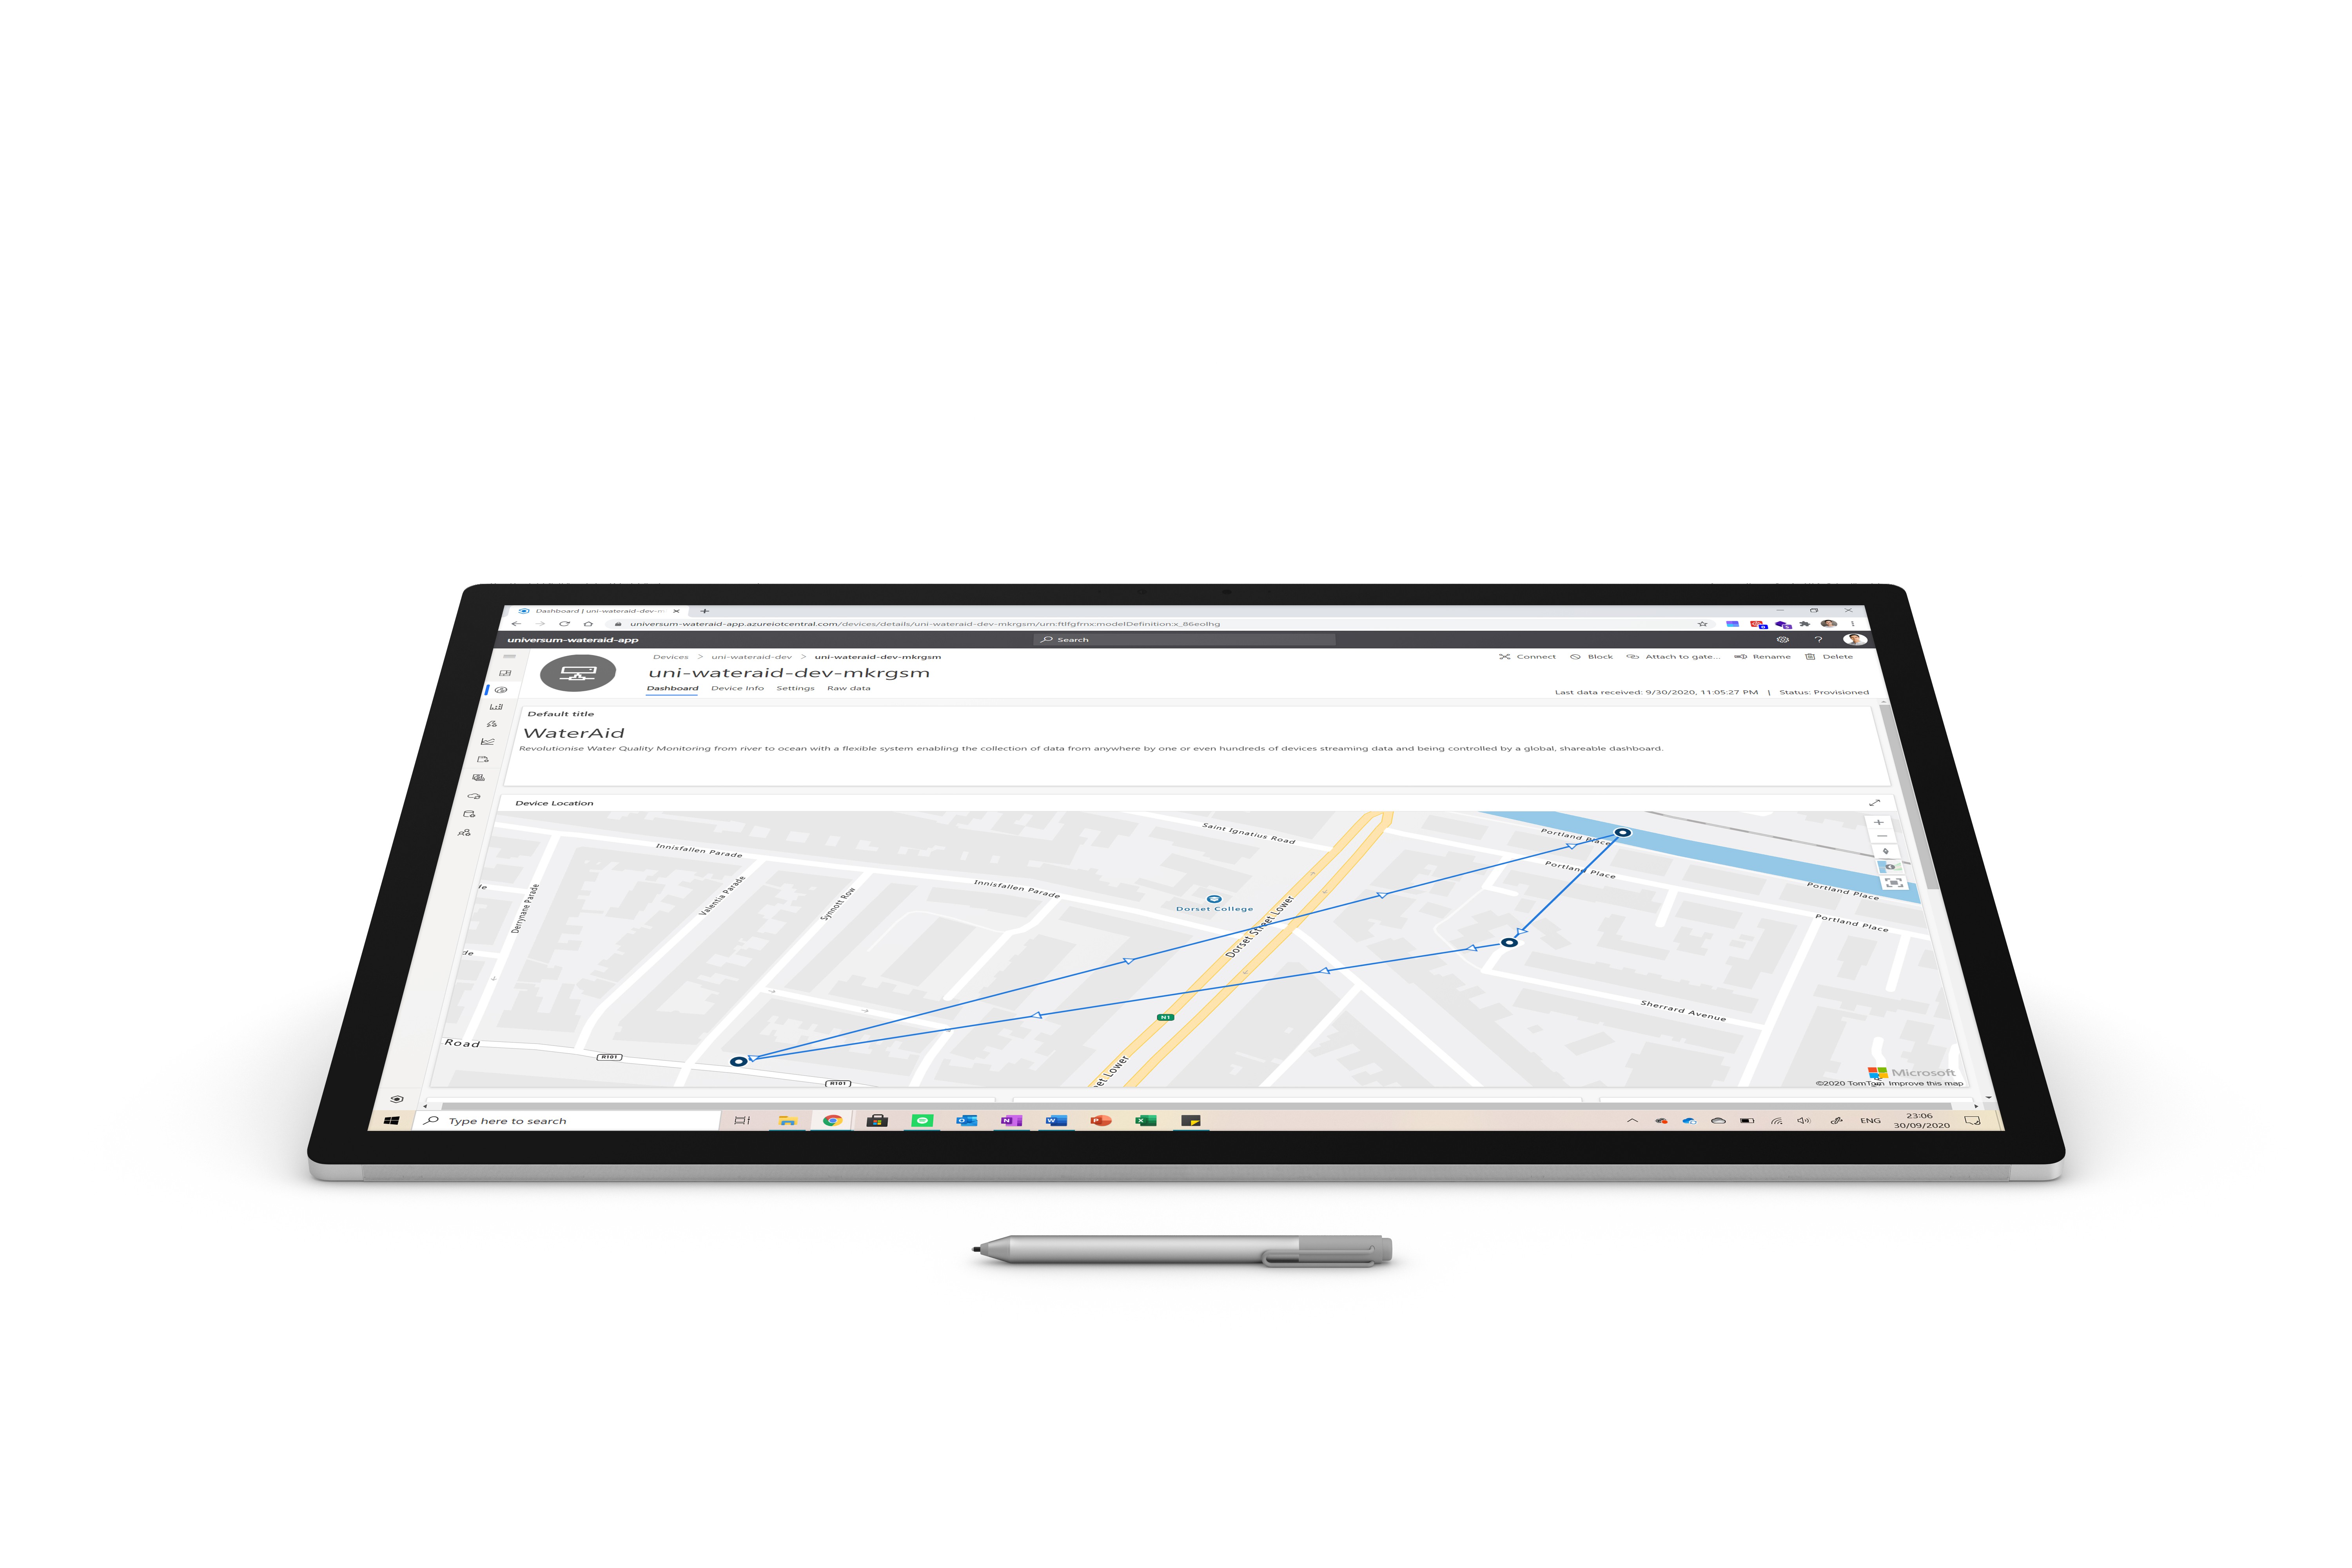
The Device Dashboard
This dashboard is specific to each device in the application. If tens or hundreds of devices are being used, each one has an individual dashboard where specific properties can be changed (note that they can also be changed in bulk), device specific data can be read for troubleshooting and device details can be viewed.
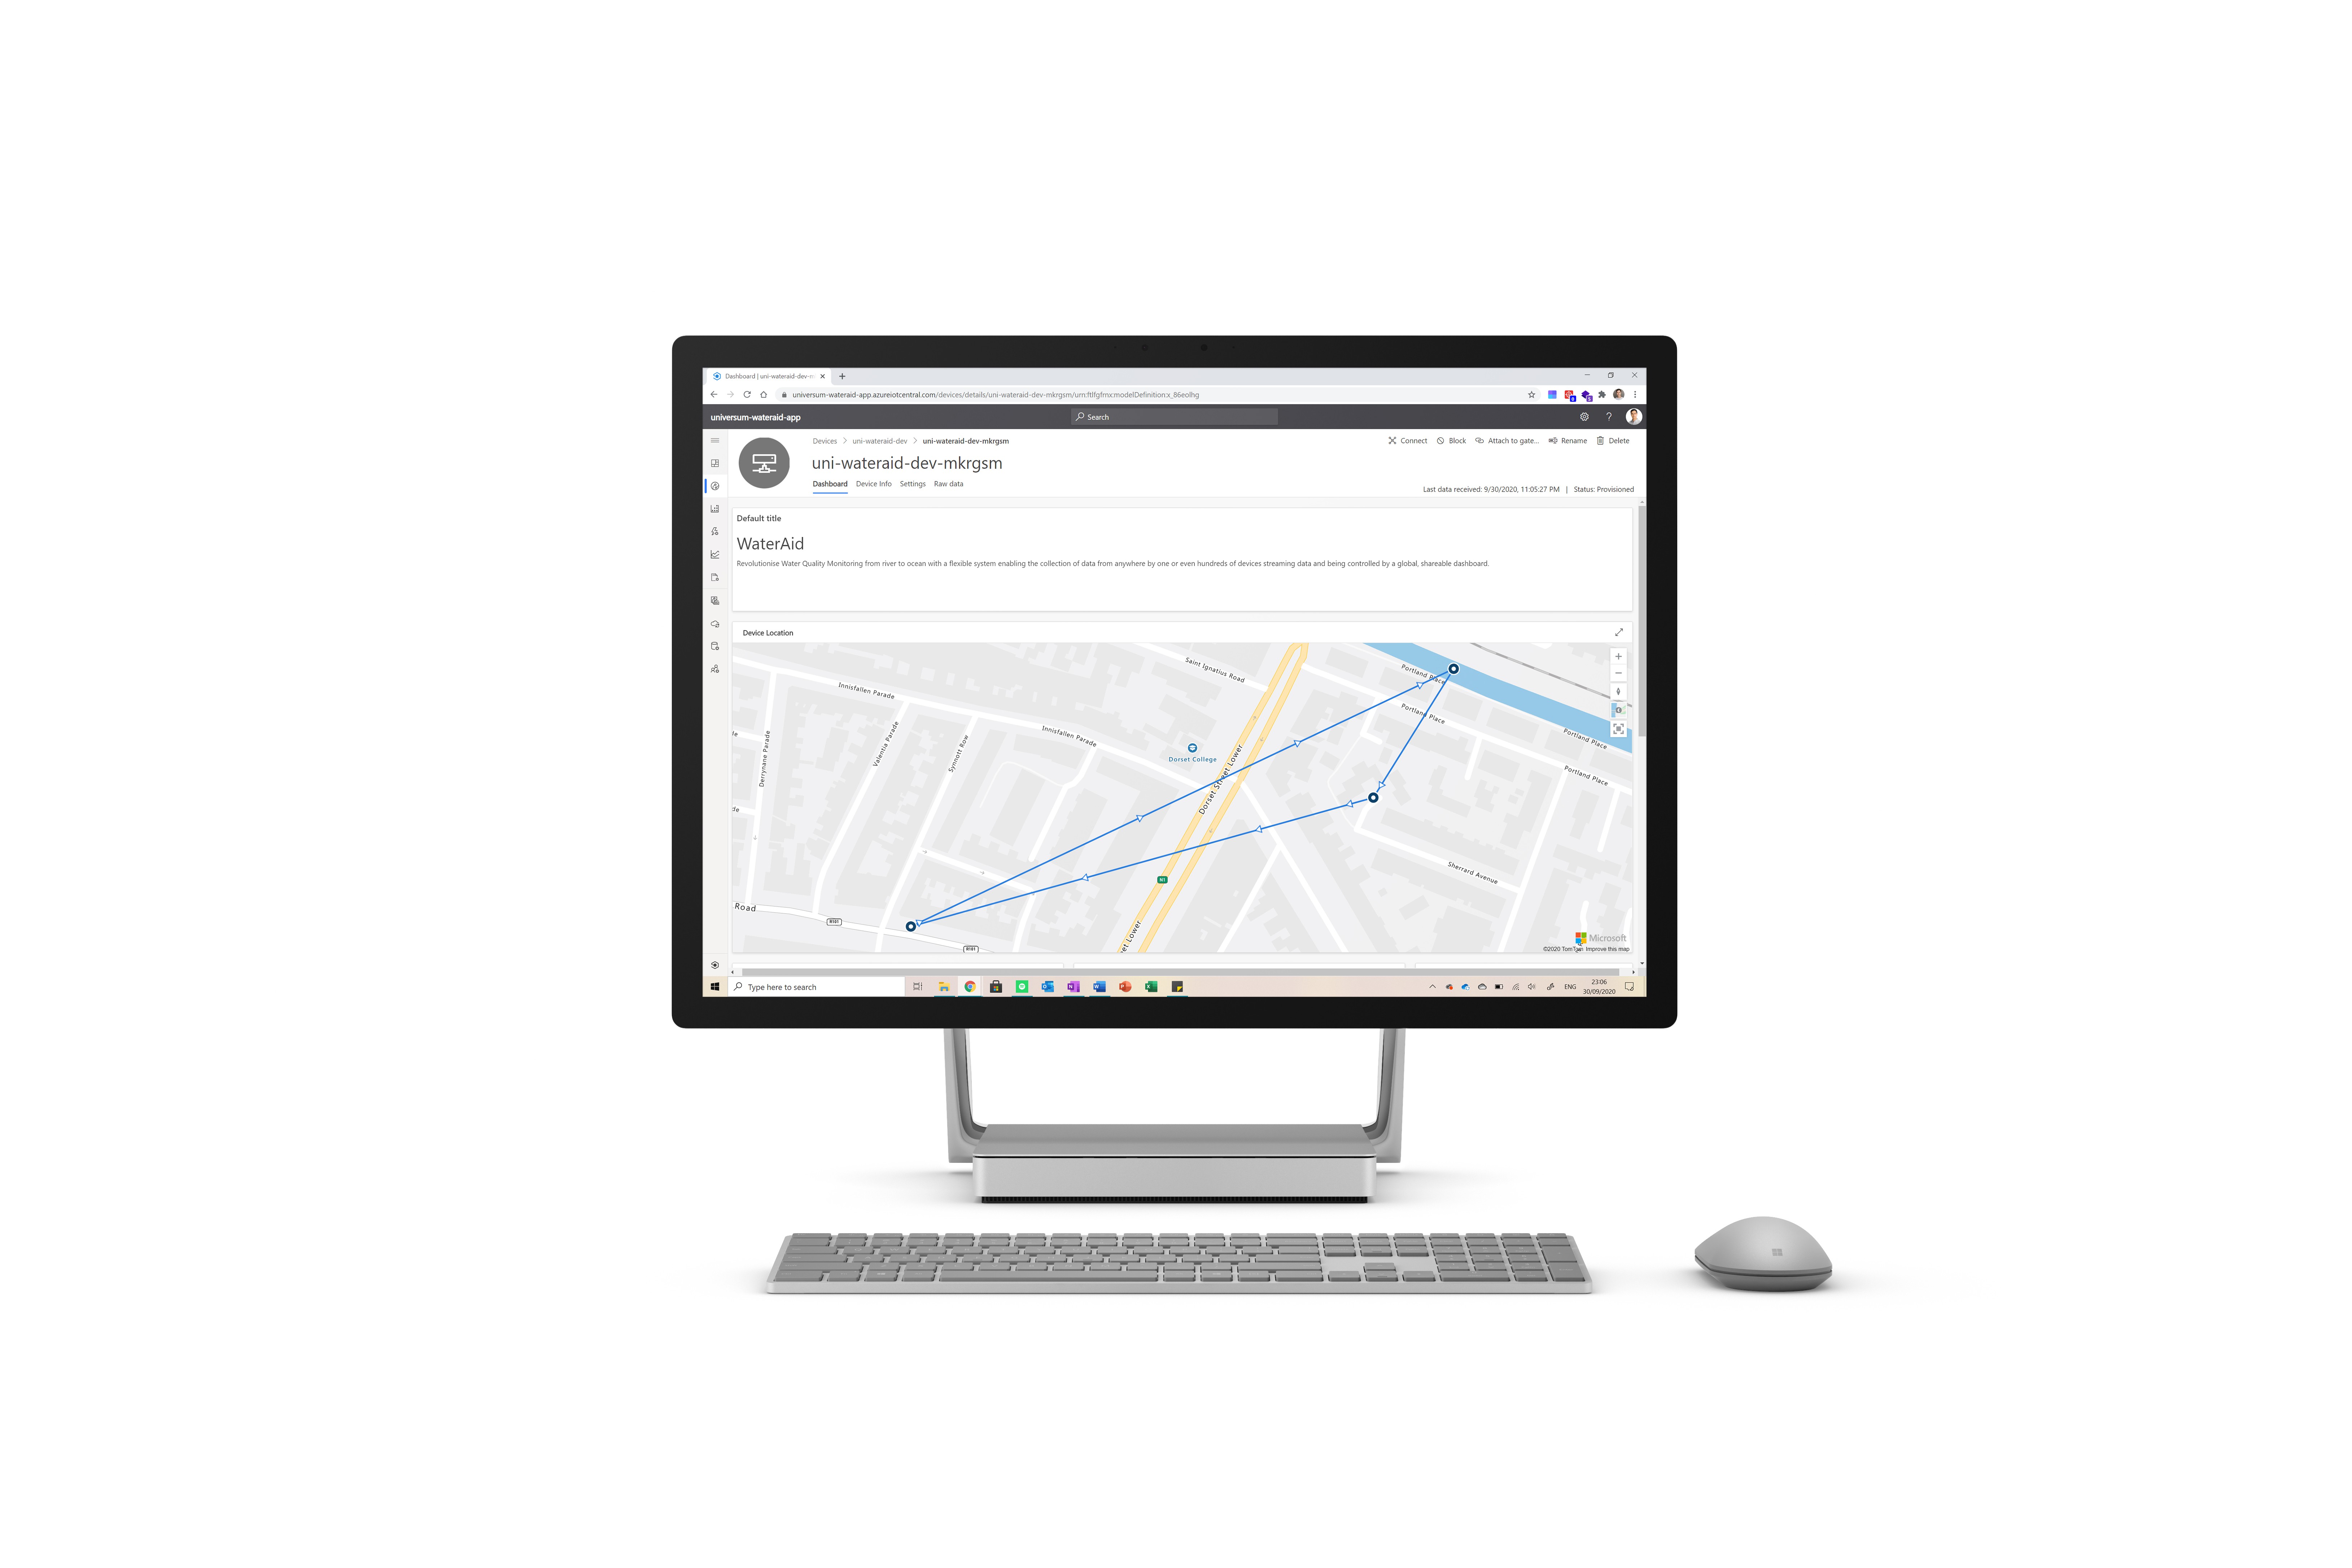
The home page consists of a map where the location where device readings were made can be seen when the device is in personal mode (a single point is seen in enterprise mode for the device’s constant location).
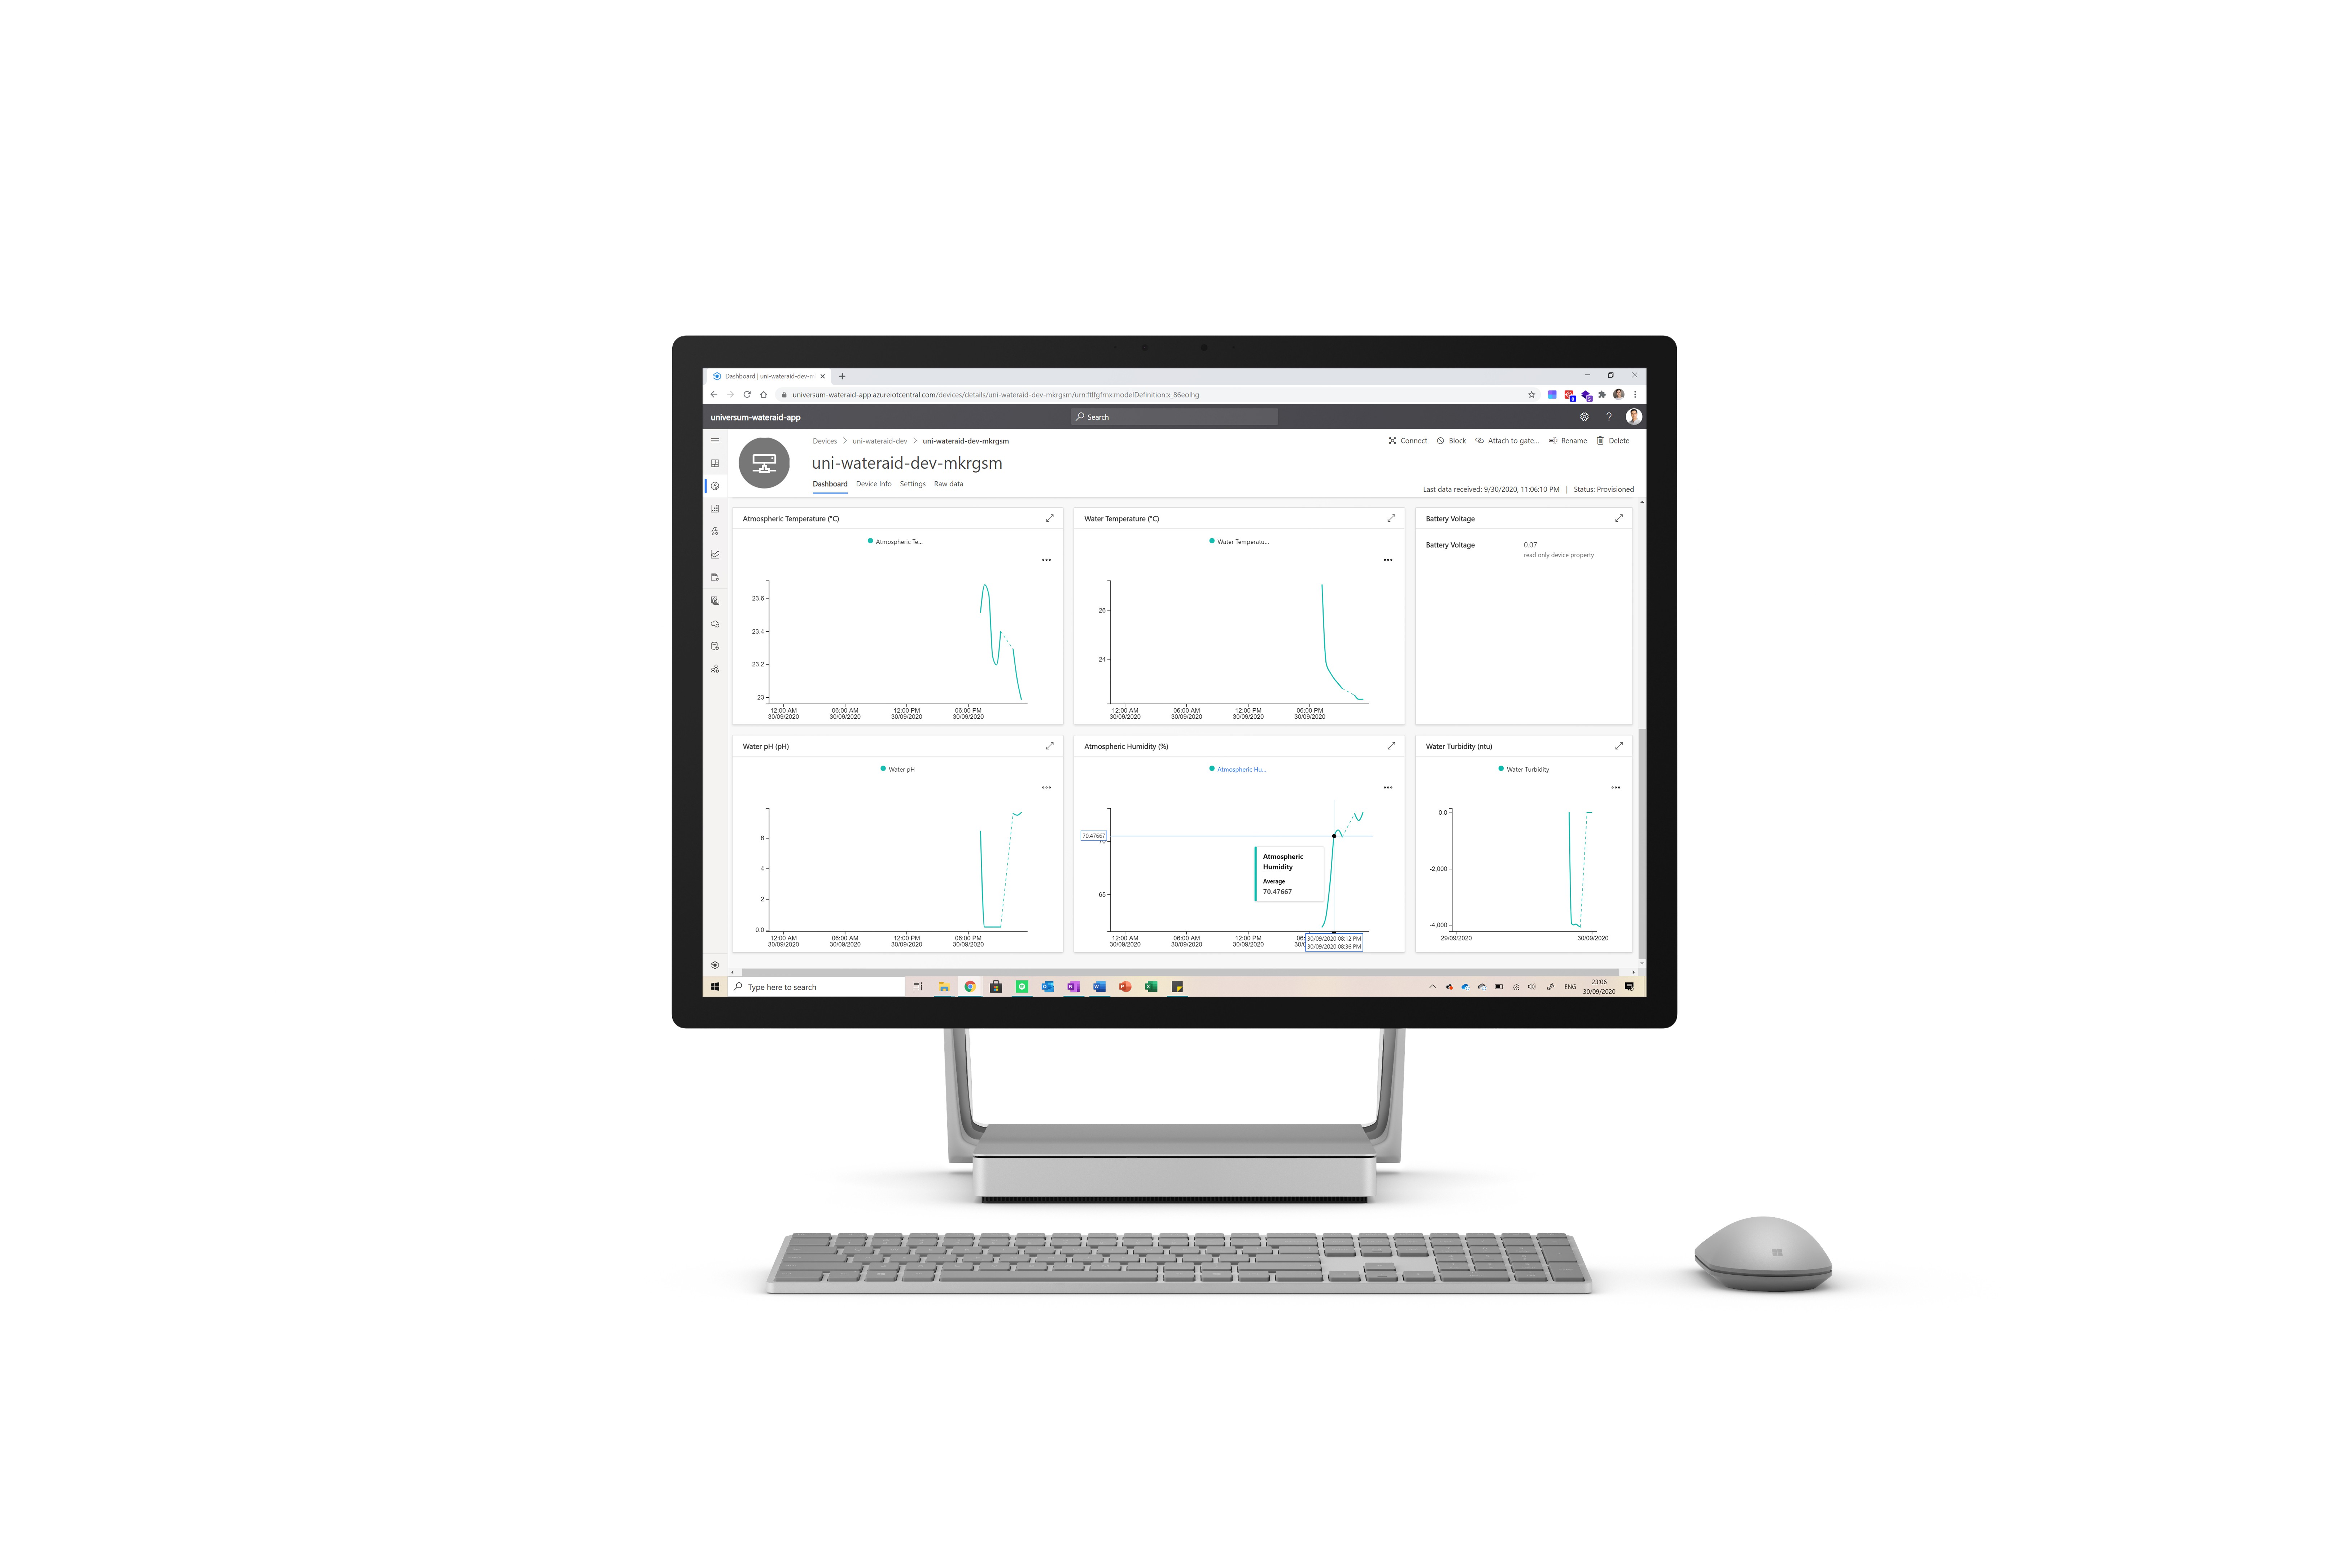
Scrolling down will reveal data posted by the device on graphs. This allows data from a single device to be visualised over time.

The device info page displays the information about the device such as its IMEI and serial number.
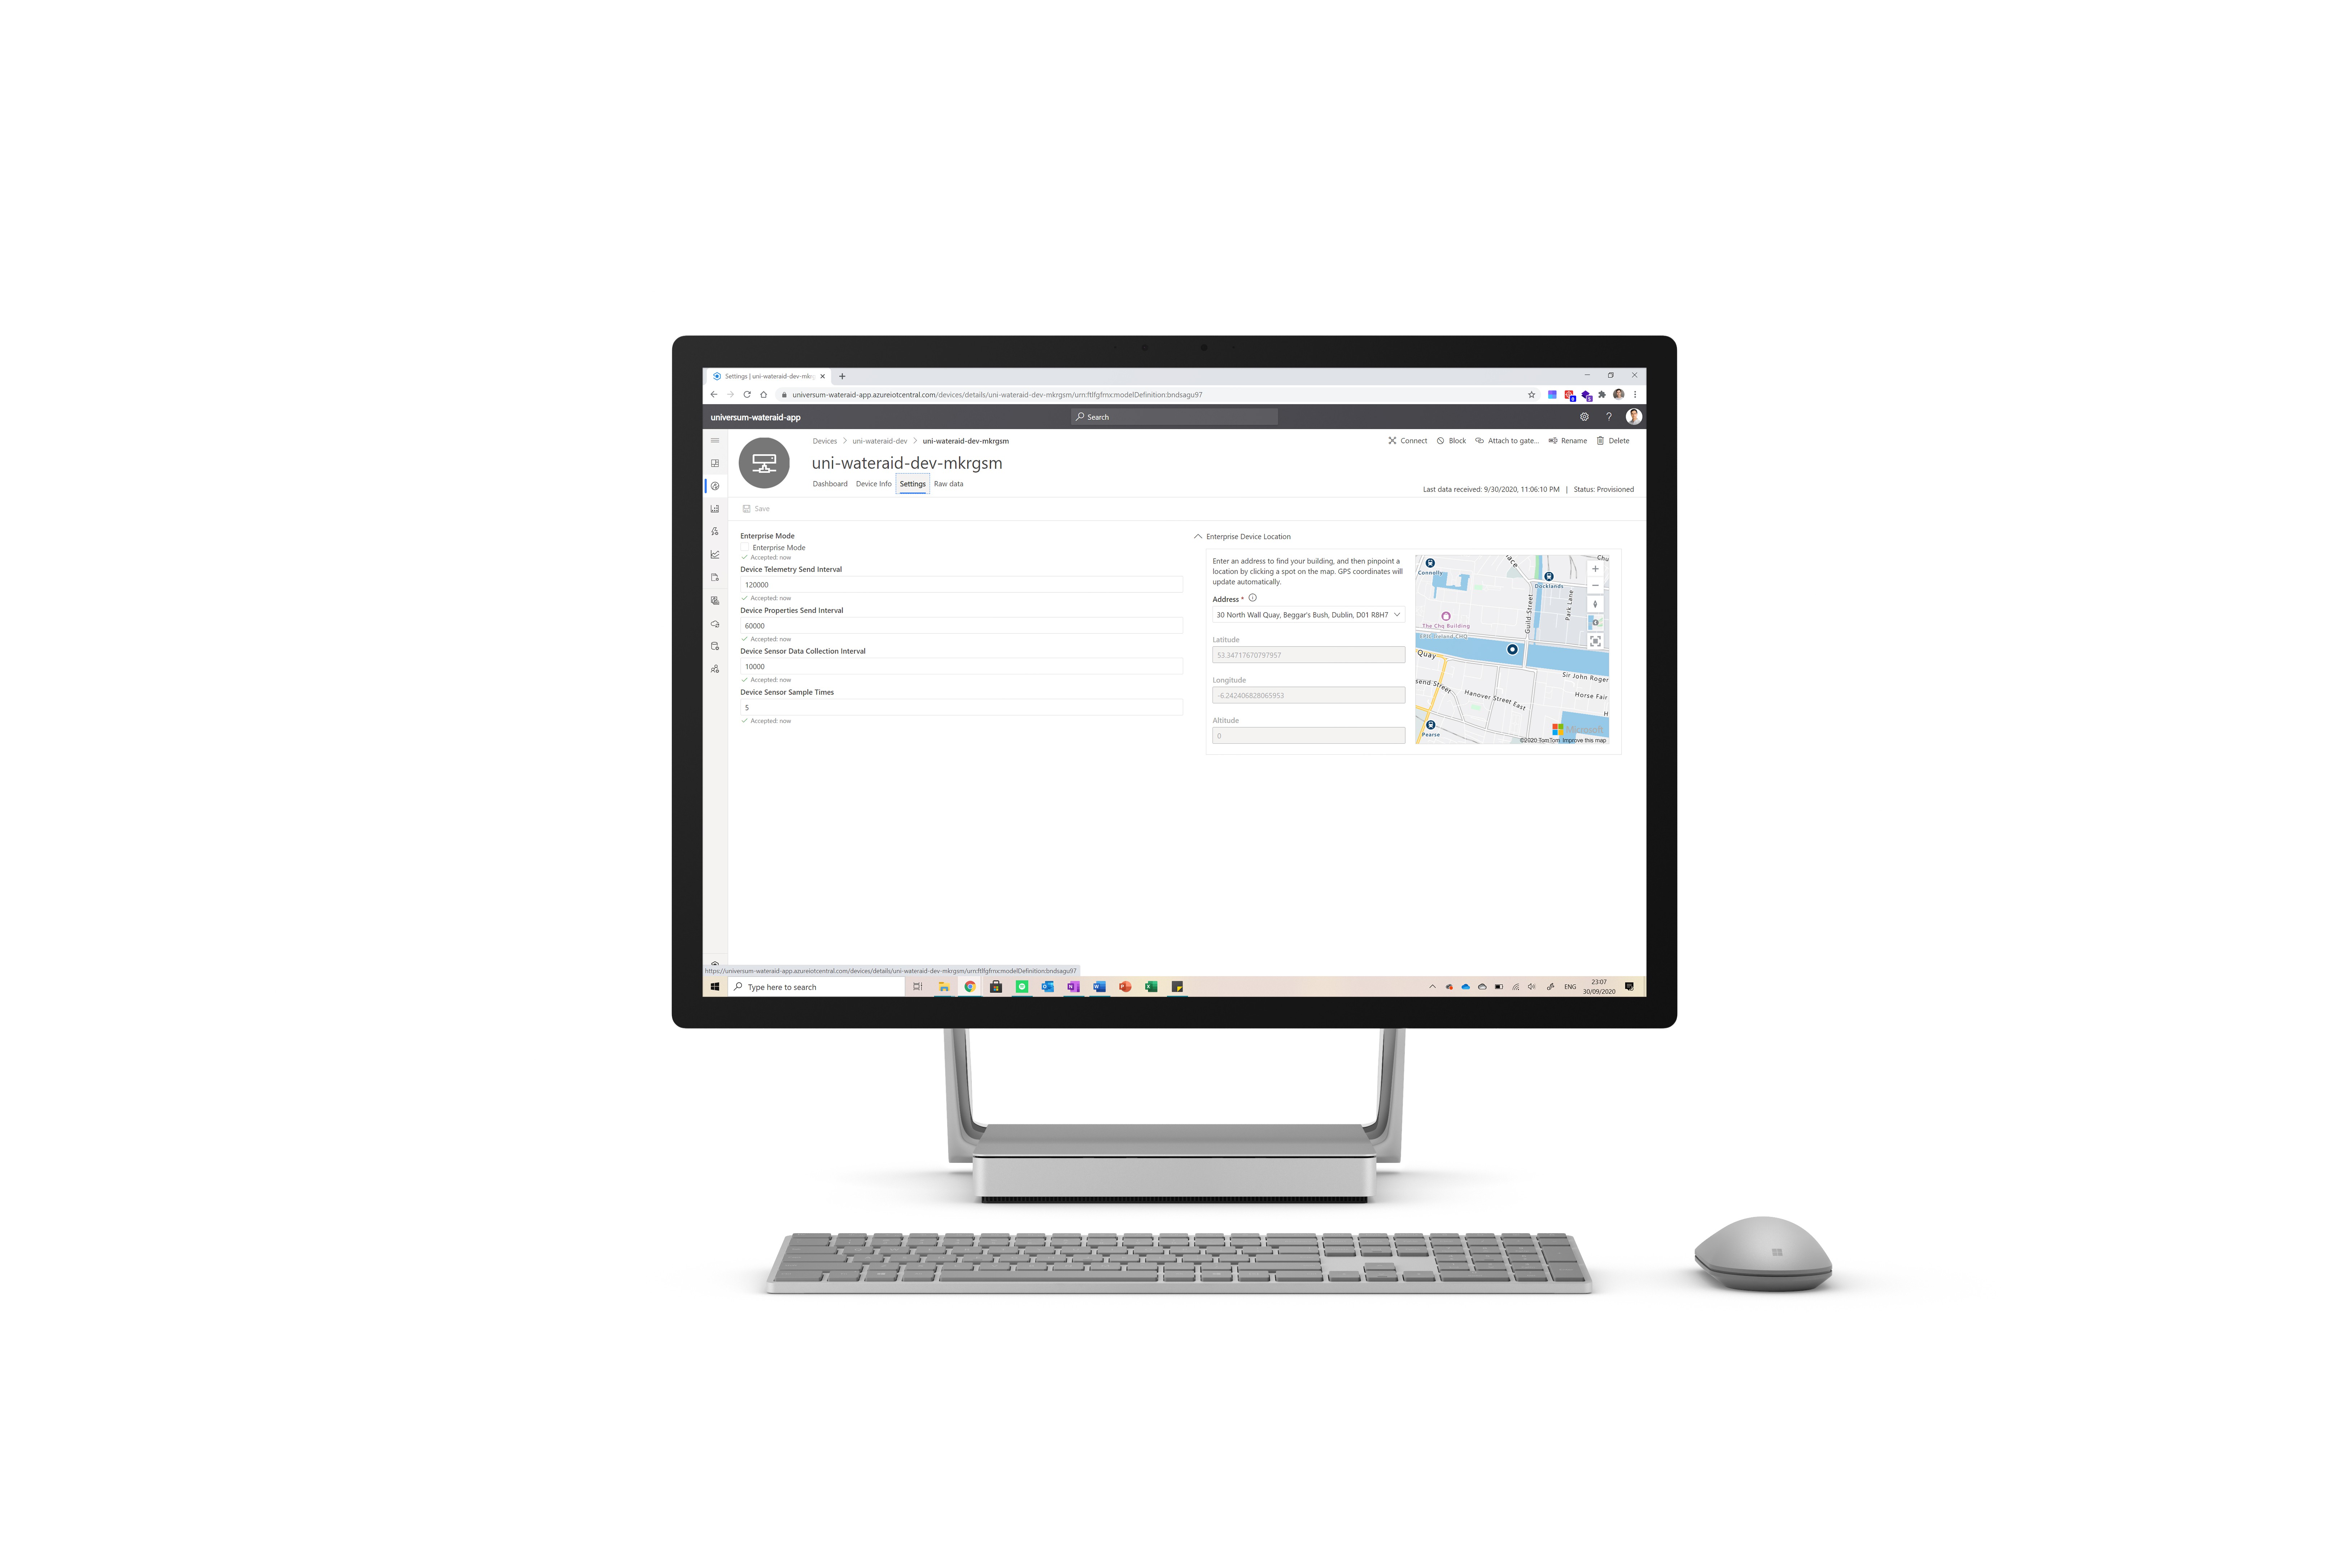
Finally, the settings page allows the user to change twin properties and set the exact location of the device when fixed in enterprise mode. Note that save has to be pressed to update these properties.
The Dashboard
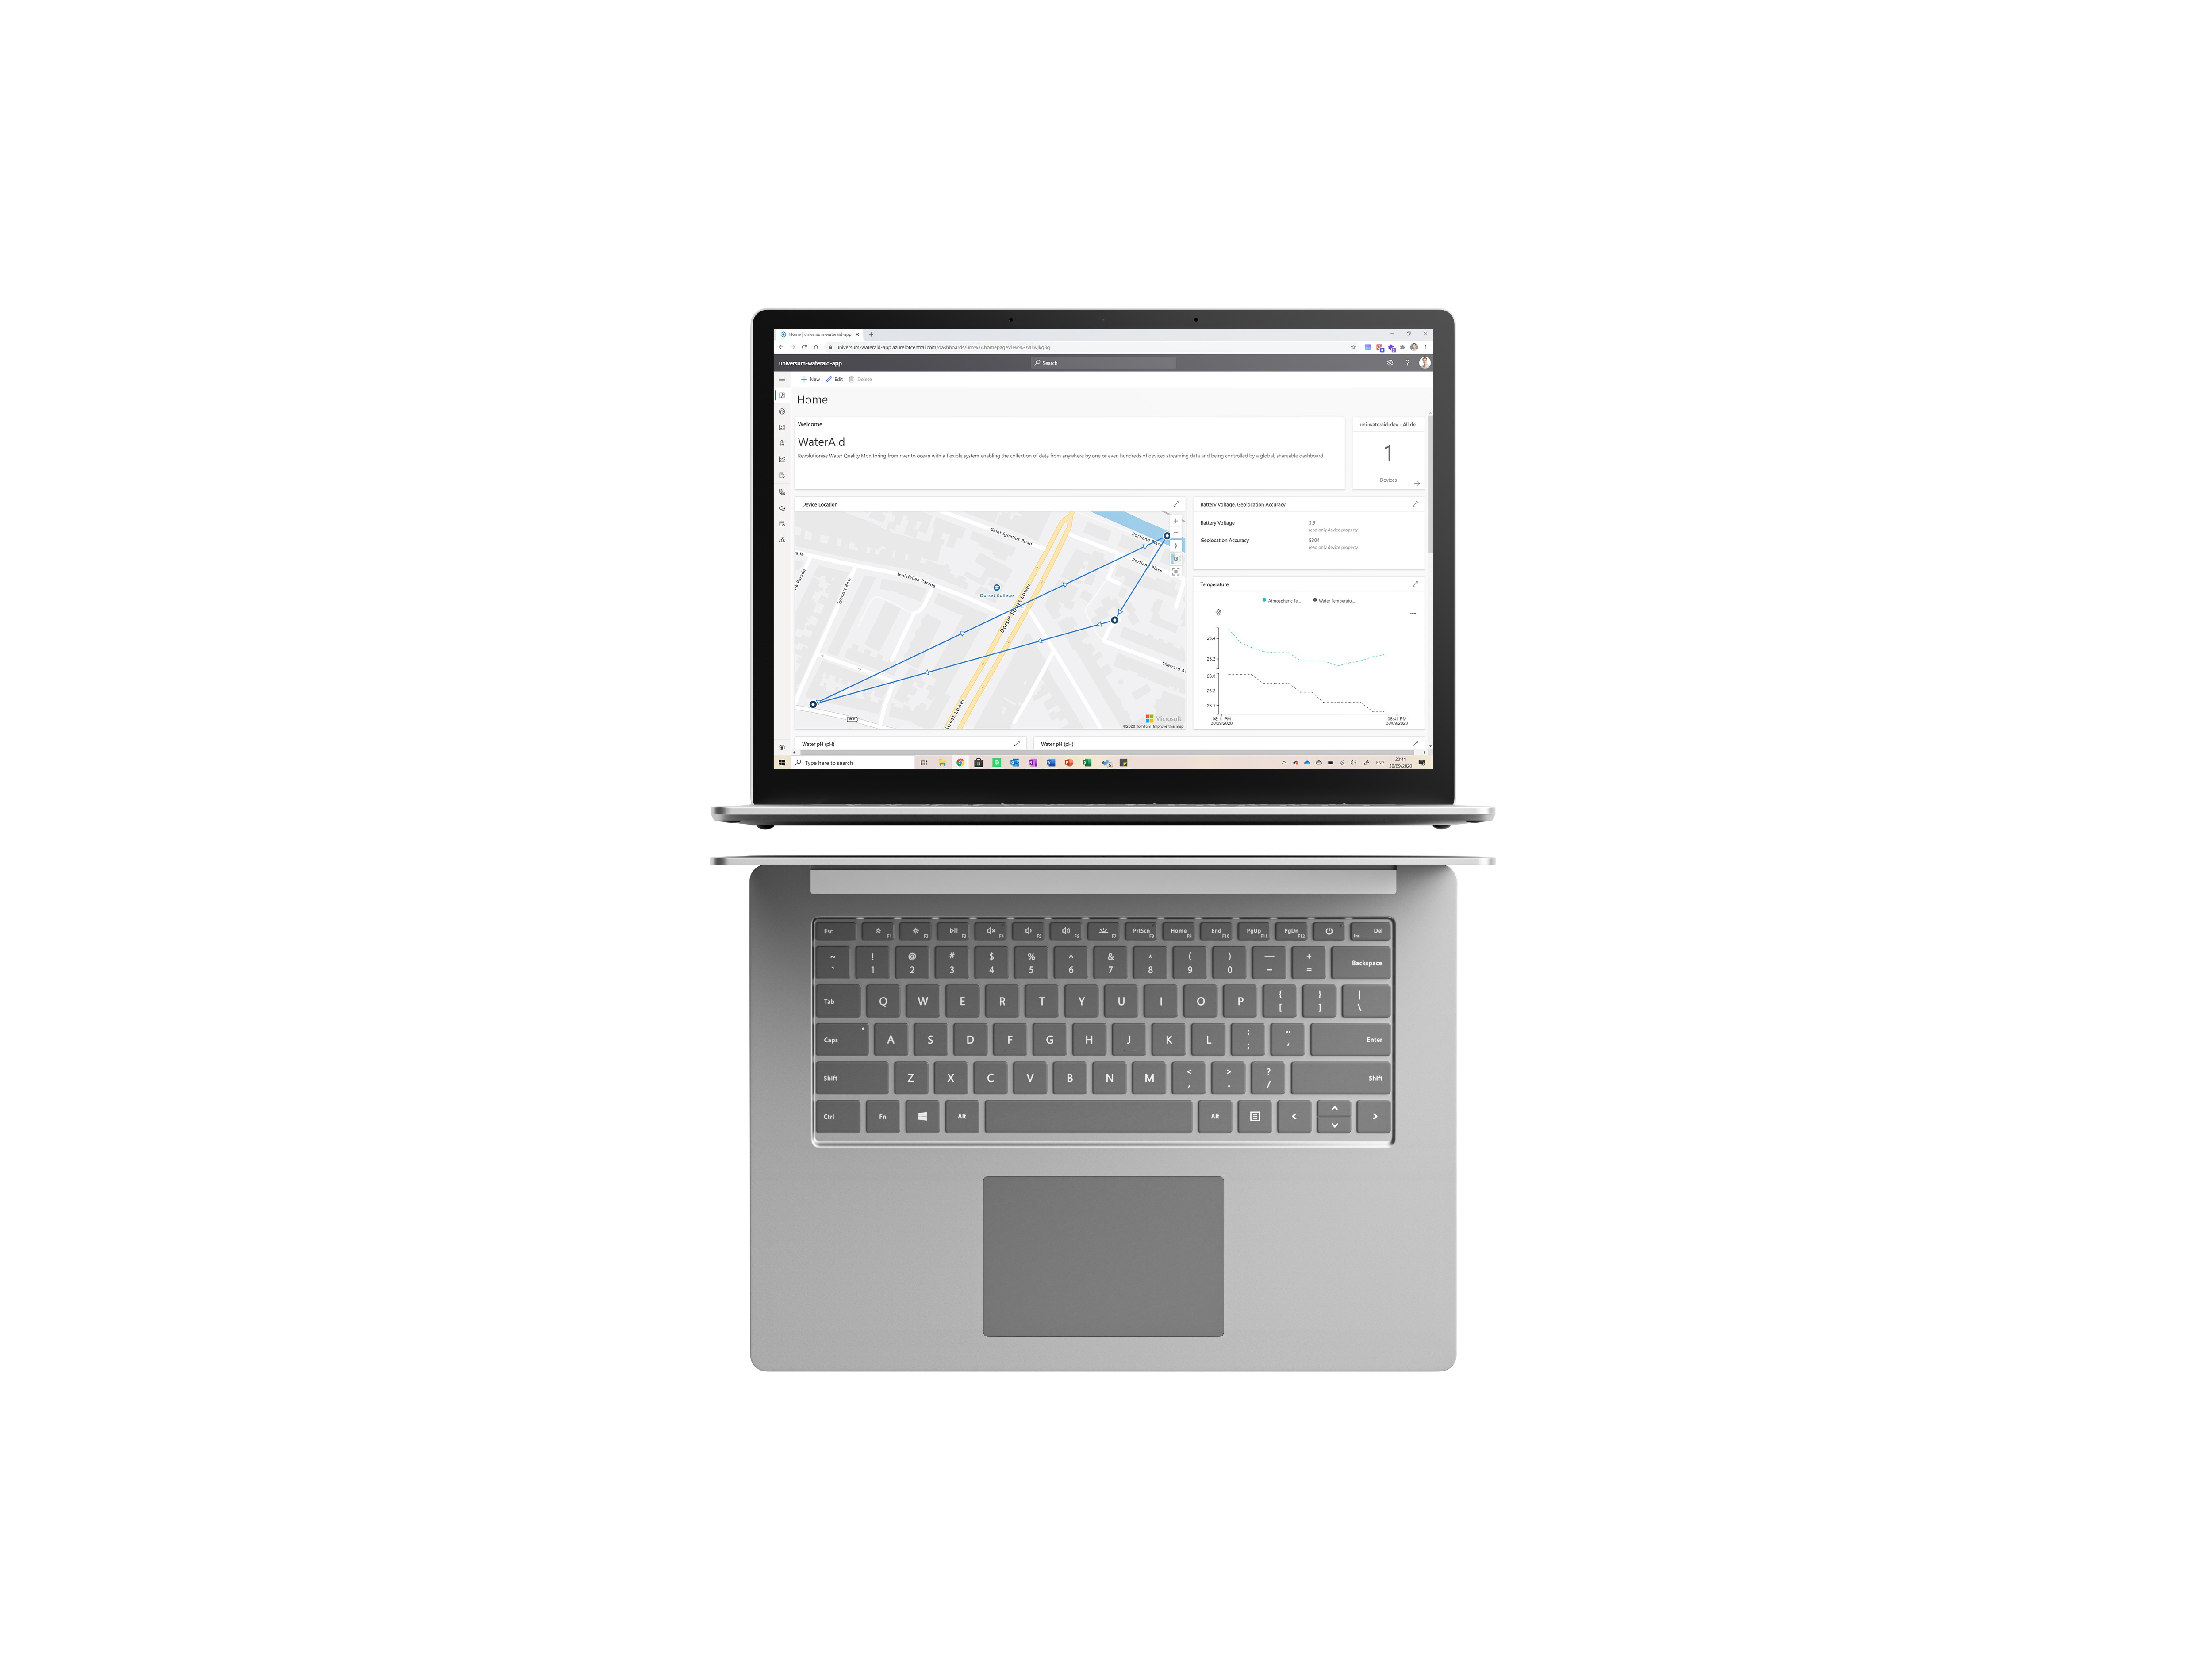
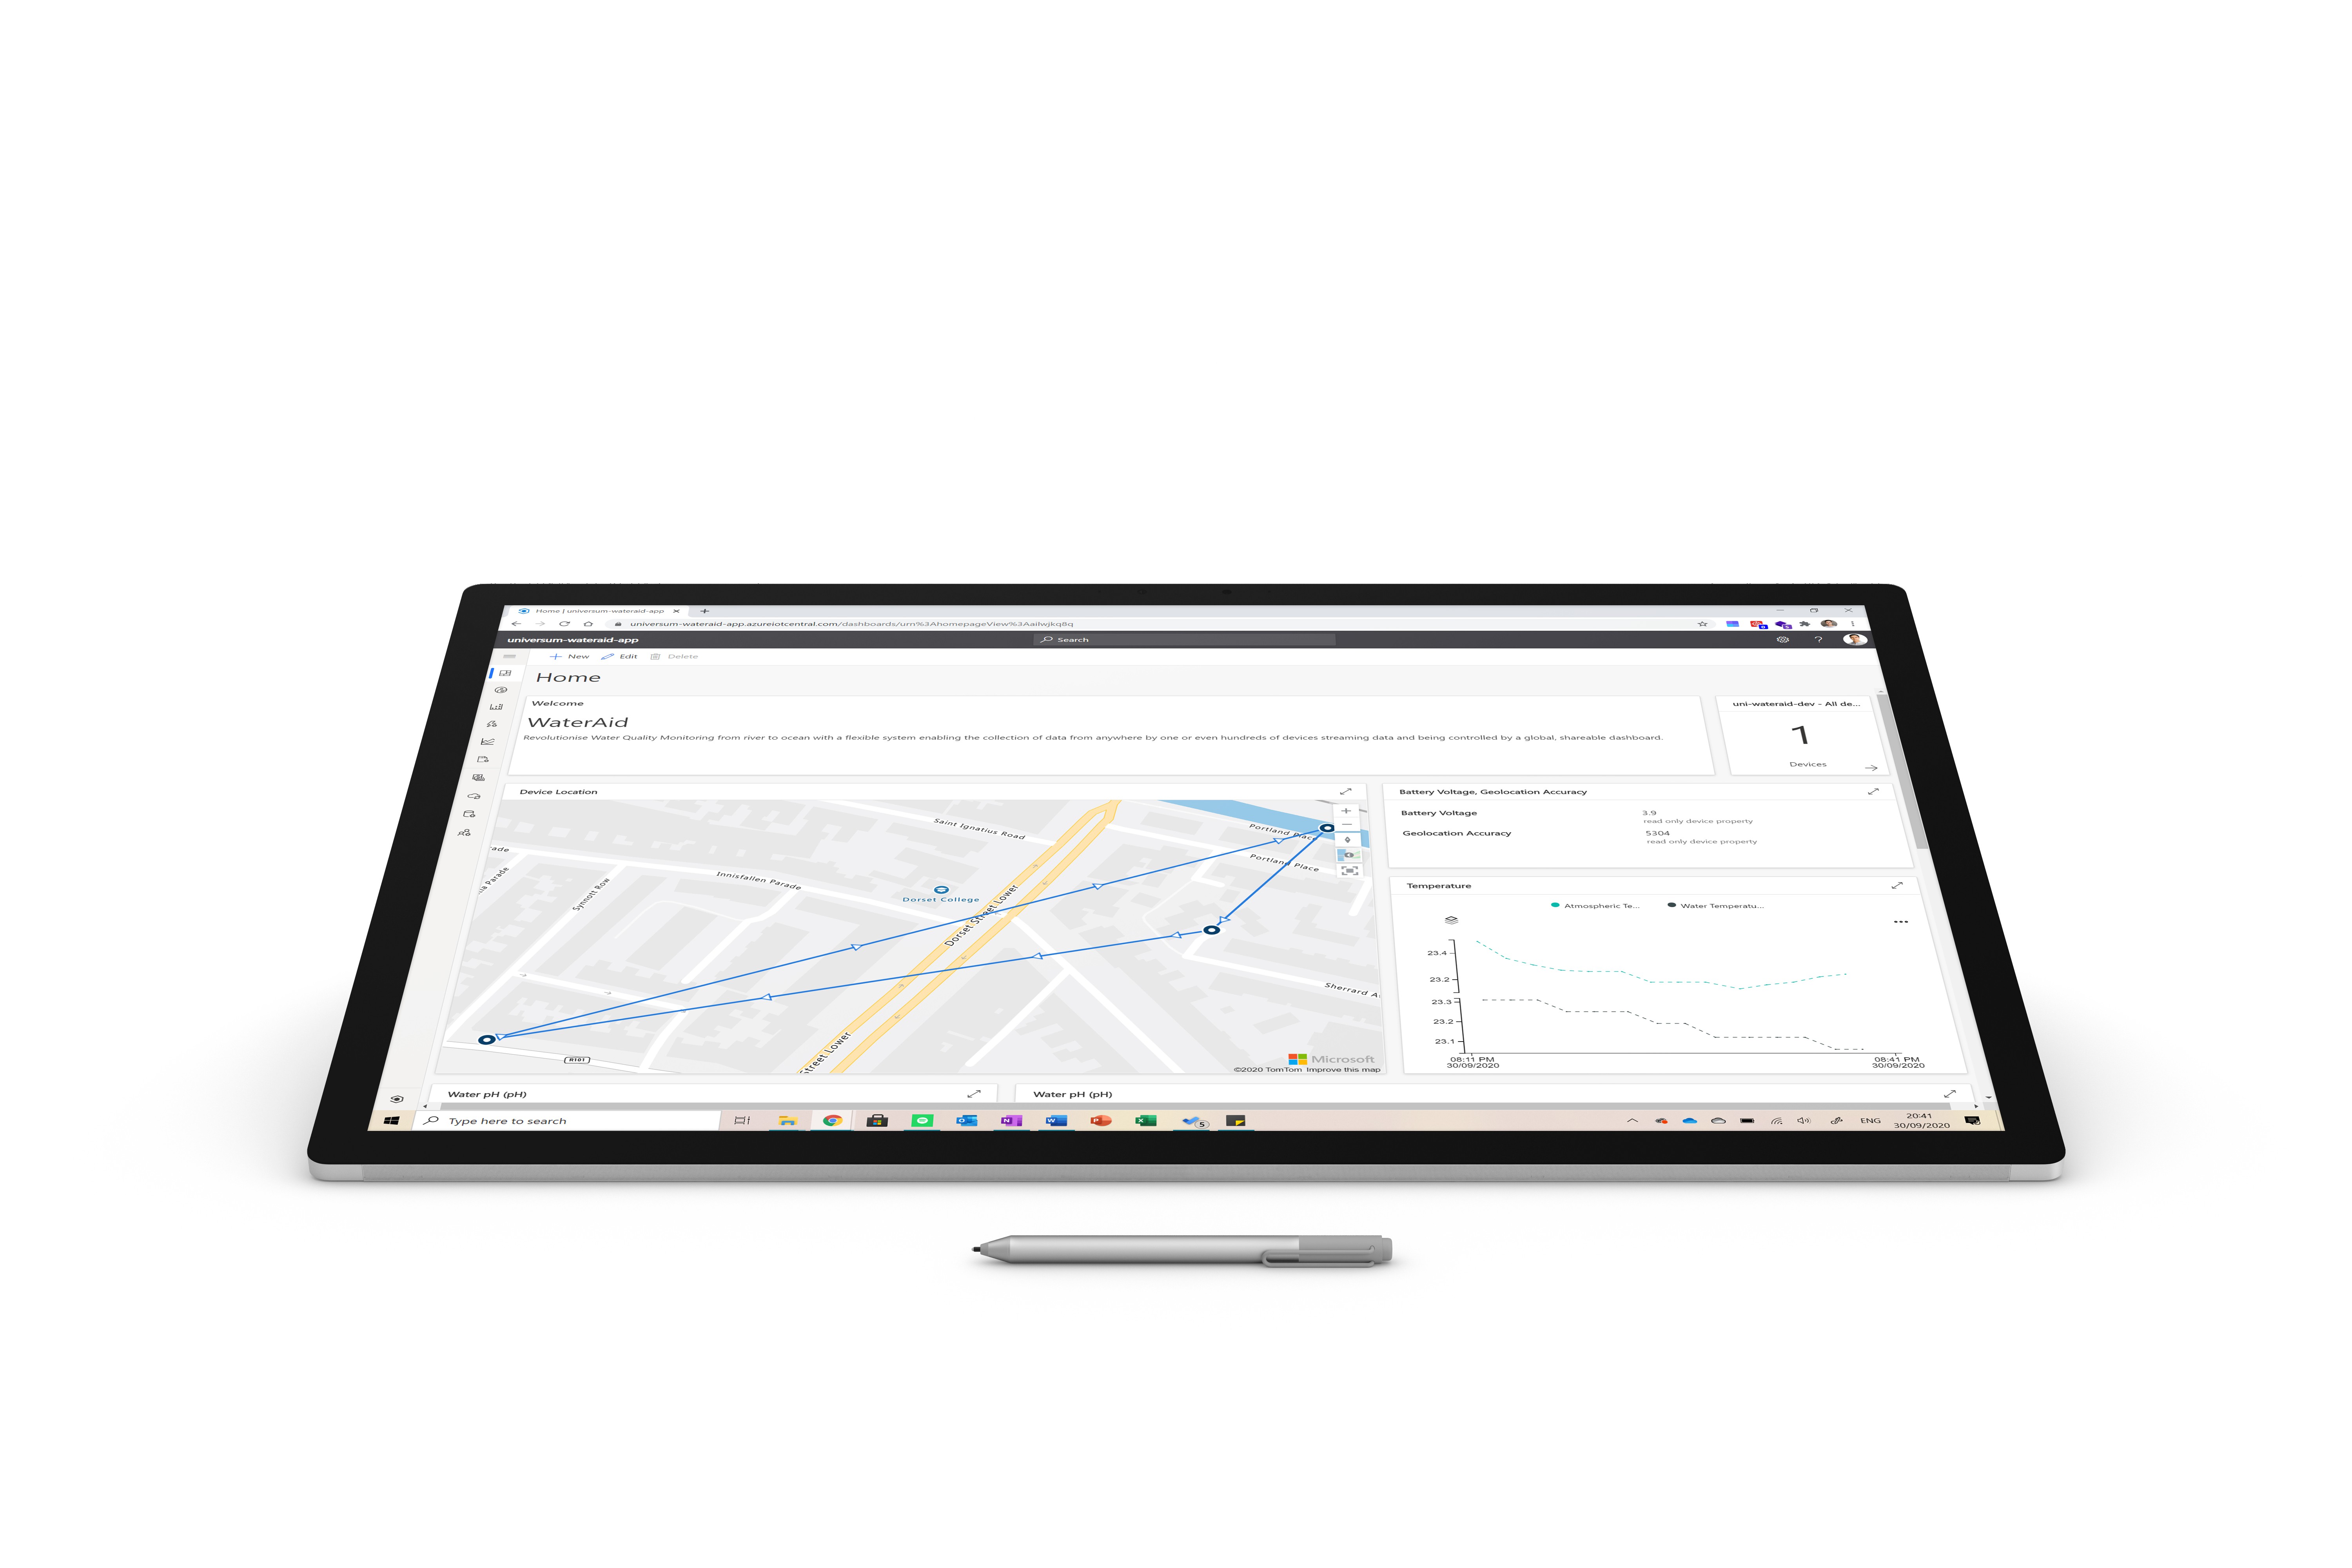
The dashboard on the project displays data from all connected devices accumulated in a series of graphs and cards. The largest element is a map that shows the location of all connected devices (in enterprise mode) or the location of readings of all devices (in personal mode).
All the other values displayed are averages from all devices connected (the number of connected devices is visible on the dashboard). This can be changed to display values for each individually. A graph illustrates the relationship between atmospheric temperature and water temperature over time.

Scrolling down will reveal the water pH, temperature and turbidity readings displayed both on cards and on line graphs. This data again is the average from all devices but can be changed.
Security
There are many articles that talk about how insecure IoT implementations are. UnifiedWater aims to exponentially reduce the risk and damage of an attack on devices. For starters, all communications to and from the backend are encrypted using bit64.
The device itself can be set to send its geolocation even in enterprise mode to detect if it was misplaced and alert the users to this. Property sealing the project can also go a long way to prevent attacks on the device.
Ultimately, if a device was hacked or is malfunctional, it can easily be disabled until the problem can be fixed.
Battery Life
The battery life of the project in its base configuration is about about 1 to 2 weeks before a recharge is needed depending on the amount of data collected and sent(1800mAh battery, bigger battery would proportionally increase battery life). Although this is fine for personal mode as the device is not always on the field, this may not be ideal in enterprise mode and therefore many changes have been made (check the Going Further section below) to increase battery life. By running the device in low power mode and adding a solar panel implementation, the device can last on the field for a few months.
Note that battery life is currently only being sent to the backend in the base configuration because the addition of a solar panel to charge the battery does not allow the microcontroller to get the battery reading. This problem can be easily addressed if needed in the future.
Market Research
This section of the write-up talks about the device’s market, competitors and production of the product.
Who is the product targeted at?
The target market of UnifiedWater is very broad. The device can be used by everyone from government institutions to monitor the water quality in location around the country to private individuals who want to occasionally measure the quality of water.
The product is focused towards companies and institutions through the provision of two modes adding flexibility to the product. It is also reliable, self-sufficient, and inexpensive making it a great choice for both developed and developing nations.
Cost of Development per Unit
This section will outline the cost of all materials and components used in the project together with links to the page to purchase these. Note that extra rows are added at the end for adding solar panel charging to the project.
| Material/Component | Cost | Link |
| Arduino MKR GSM 1400 | €60 | |
| 3.7v 1,800mAh LiPo batter | €4.50 | |
| GY-21 Temp and Humidity | €1.50 | |
| Water pH Sensor | €17.50 | |
| Water turbidity Sensor | €2.50 | |
| Water temperature Sensor | €0.50 | |
| Wires, breadboard, button | €1.00 | Basic components |
| Neopixel ring | €9.00 (optional) | |
| Hologram Sim | €5.00 | |
| Enclosure | €5.00 | here/3D print/make yourself |
| Total without solar charging | Without neopixel €97.50 | With neopixel €105 |
| Solar panel module | €22 | |
| Total with solar charging | Without neopixel €119.50 | With neopixel €128 |
Cost of Operation per Unit

This section will go over the cost of operation per device per month. This is calculated under the circumstances below. Note that the amount of data used per message is averaged. Cost for personal mode varies by number of samples taken.
| Mode (1 device) | Personal |
| Reboot and Setup | 100 kilobytes |
| One Data Send | 10 kilobytes |
| Cost per kilobyte send | €0.0004 |
| Cost per message sent (cost per sample taken) | €0.004 |
| Cost for rebooting and setting up | €0.04 |
| Mode (1 device) | Enterprise |
| Telemetry Send Interval | 3 hours @ 10kb |
| Property Send Interval | 1 hour @ 10kb |
| Total data usage a day | 80kb (telemetry) + 240kb (property) = 320kb |
| Cost per kb send | €0.0004 |
| Total cost per day | €0.128 |
| Total cost per month | €3.84 + 0.4 (device in IoT Central) = €4.24 |
| Total cost per month (2 reboots) | €3.92 + 0.4 (device in IoT Central) = €4.32 |
Note that sending property changes also impacts on the data sent by the device. Please note that these values can vary significantly depending on usage and are only estimates of the cost.
Scaling and Production
The prototype built can be easily reproduced. All code is 100% open source meaning that anyone can use it free of charge. This dramatically accelerates production for the project. All components used for the project are available off the shelf meaning that they can be bought in bulk at a low price. Finally, all technologies used are scalable and can operate with anywhere from one to 1,000 devices.
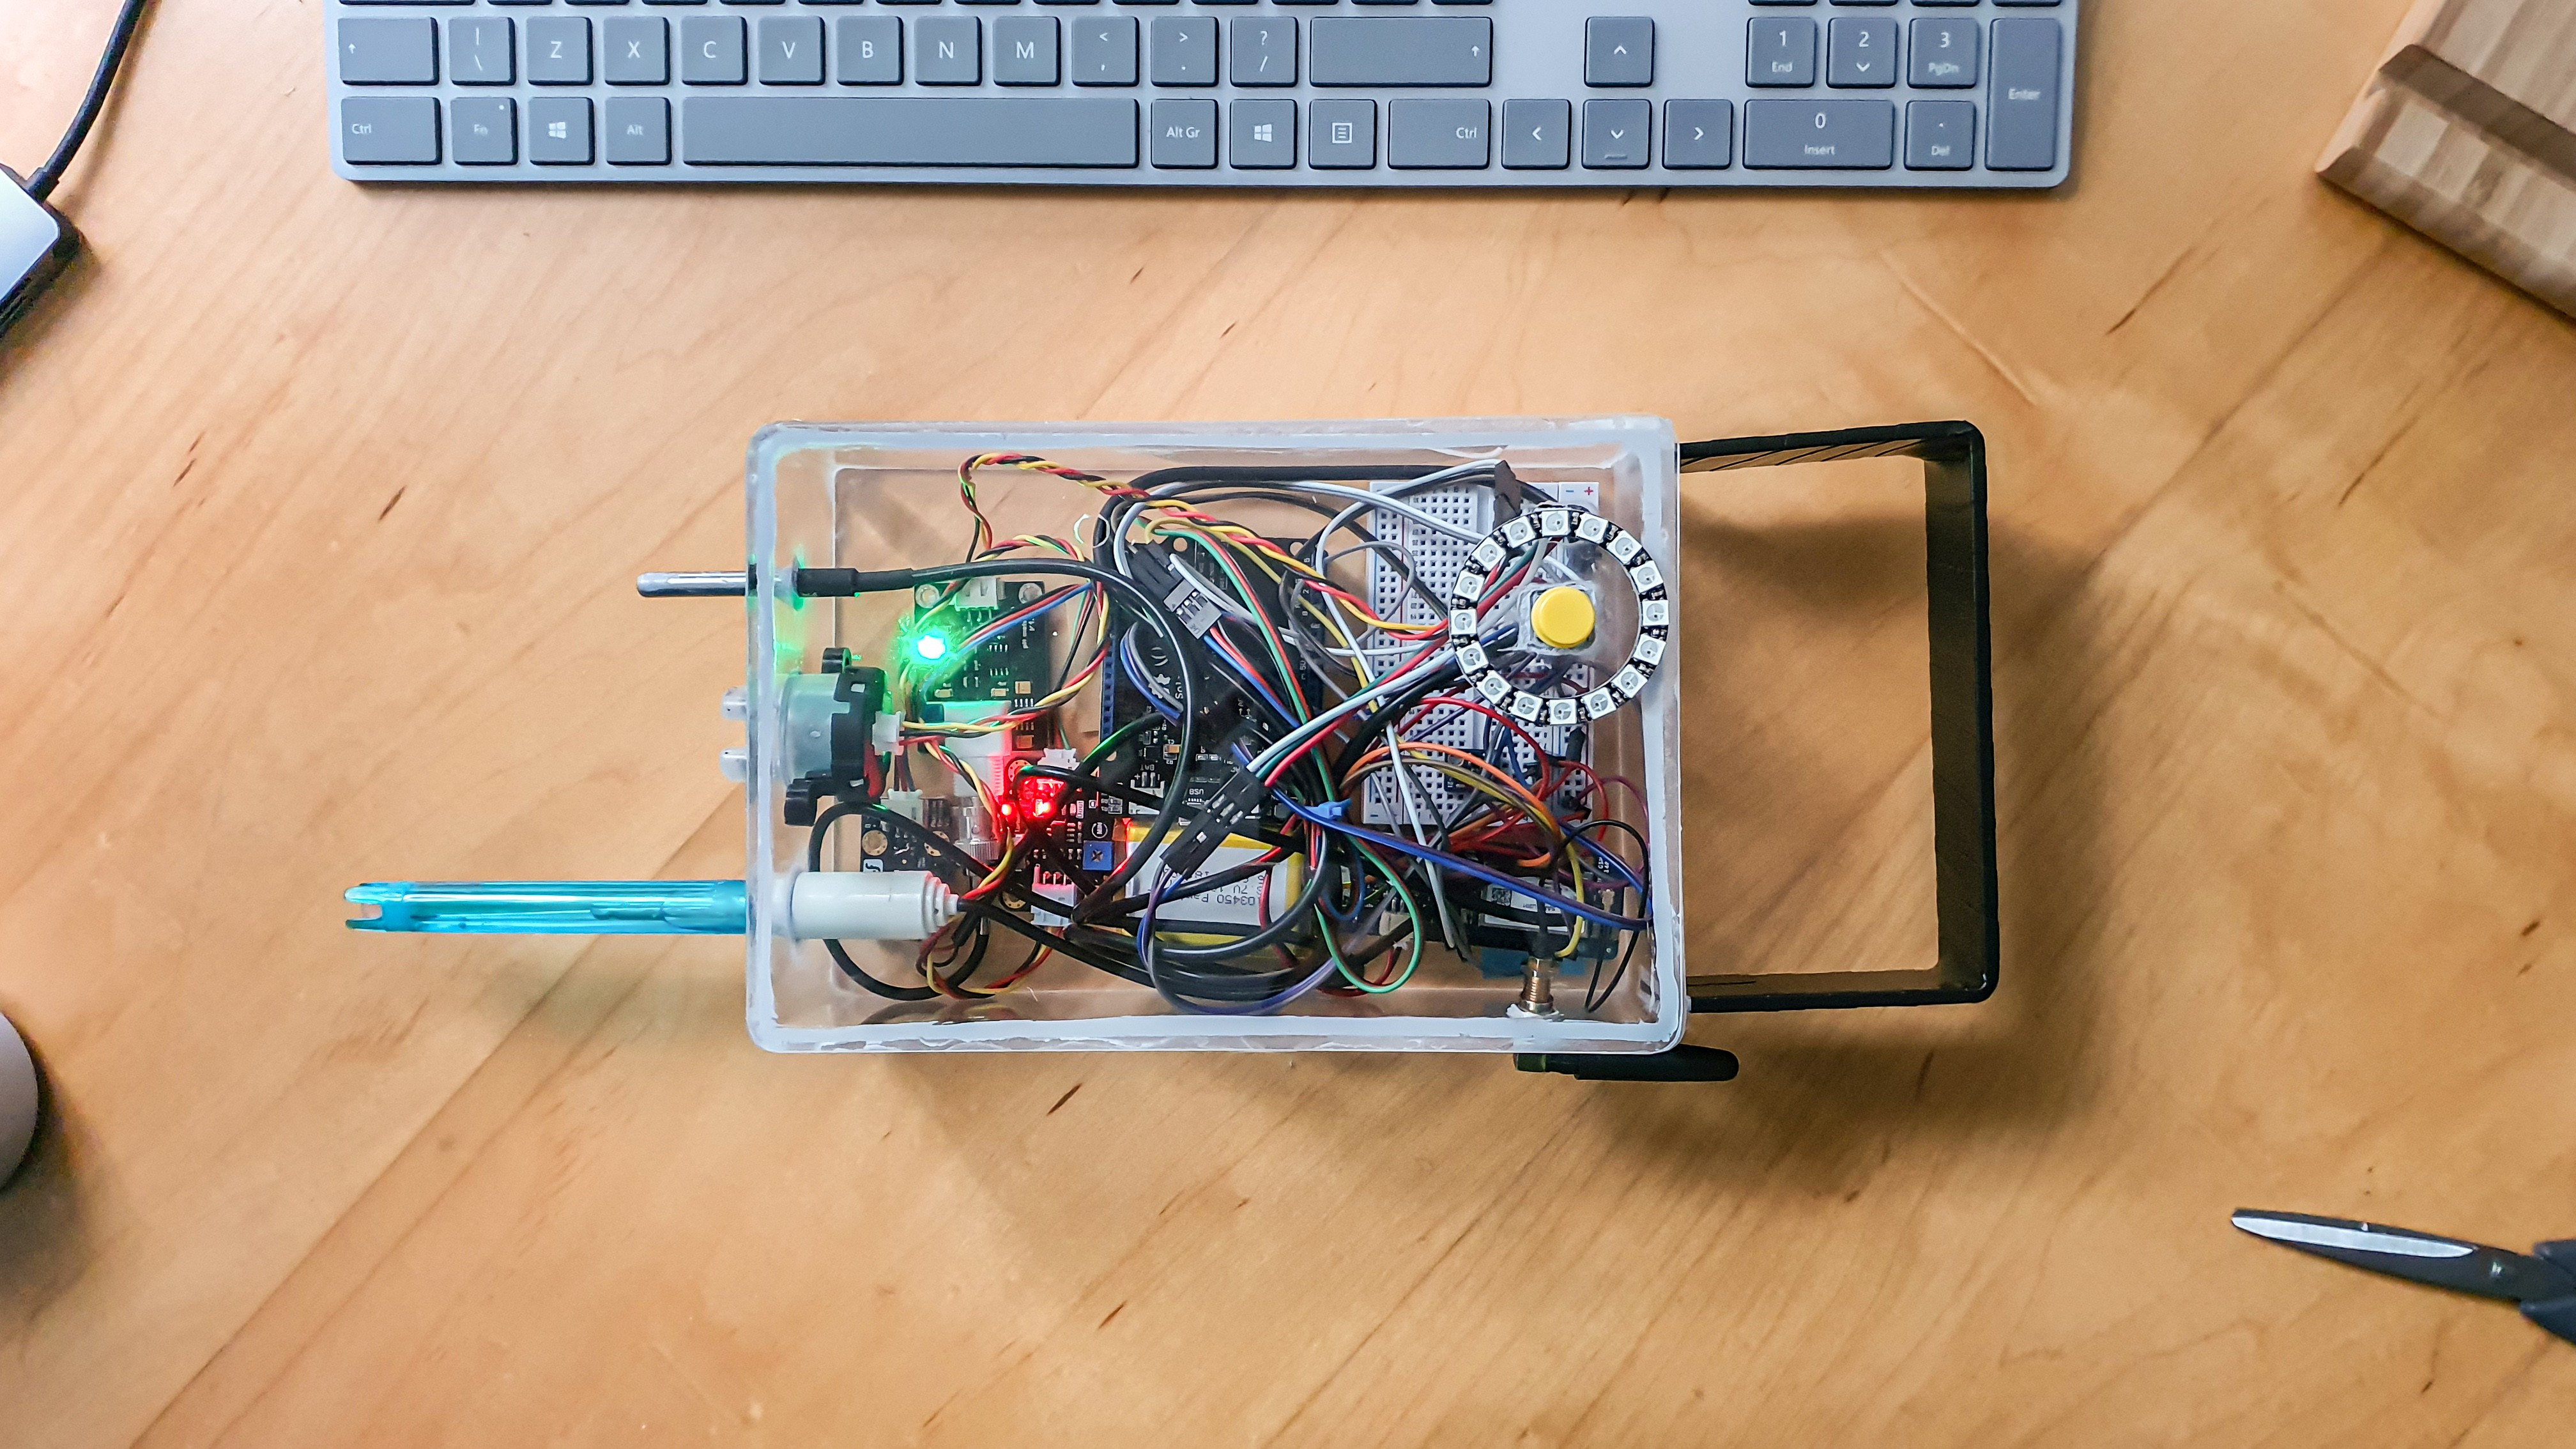
It may be tricky to choose an enclosure for the project. I personally built mine because I wanted to improve my skills in this regard. Waterproof cases are available on multiple online retailers including aliexpress for under €5. I would personally recommend using one of those in production as they are easy to mount components to and are reliable. You will need to drill some holes in the enclosure for the sensors and antenna (all details in the enclosure STL file).
Another alternative is 3d printing the enclosure. While it is true that most 3D printers' prints are not waterproof, I found a very interesting article on Hackaday about making your 3D prints waterproof.
- Code is ready to go (on GitHub, open source, clean)
- Components available off the shelves
- Backend can scale with ease
- Device has been tested extensively and all bugs found were addressed
Going Further
This section will detail improvements added to the project as well as future aspirations and plans for developing the project more. I do have to say that this is the 3rd iteration of this project, every time was a pleasure.
Version 1
Version 2
Version 3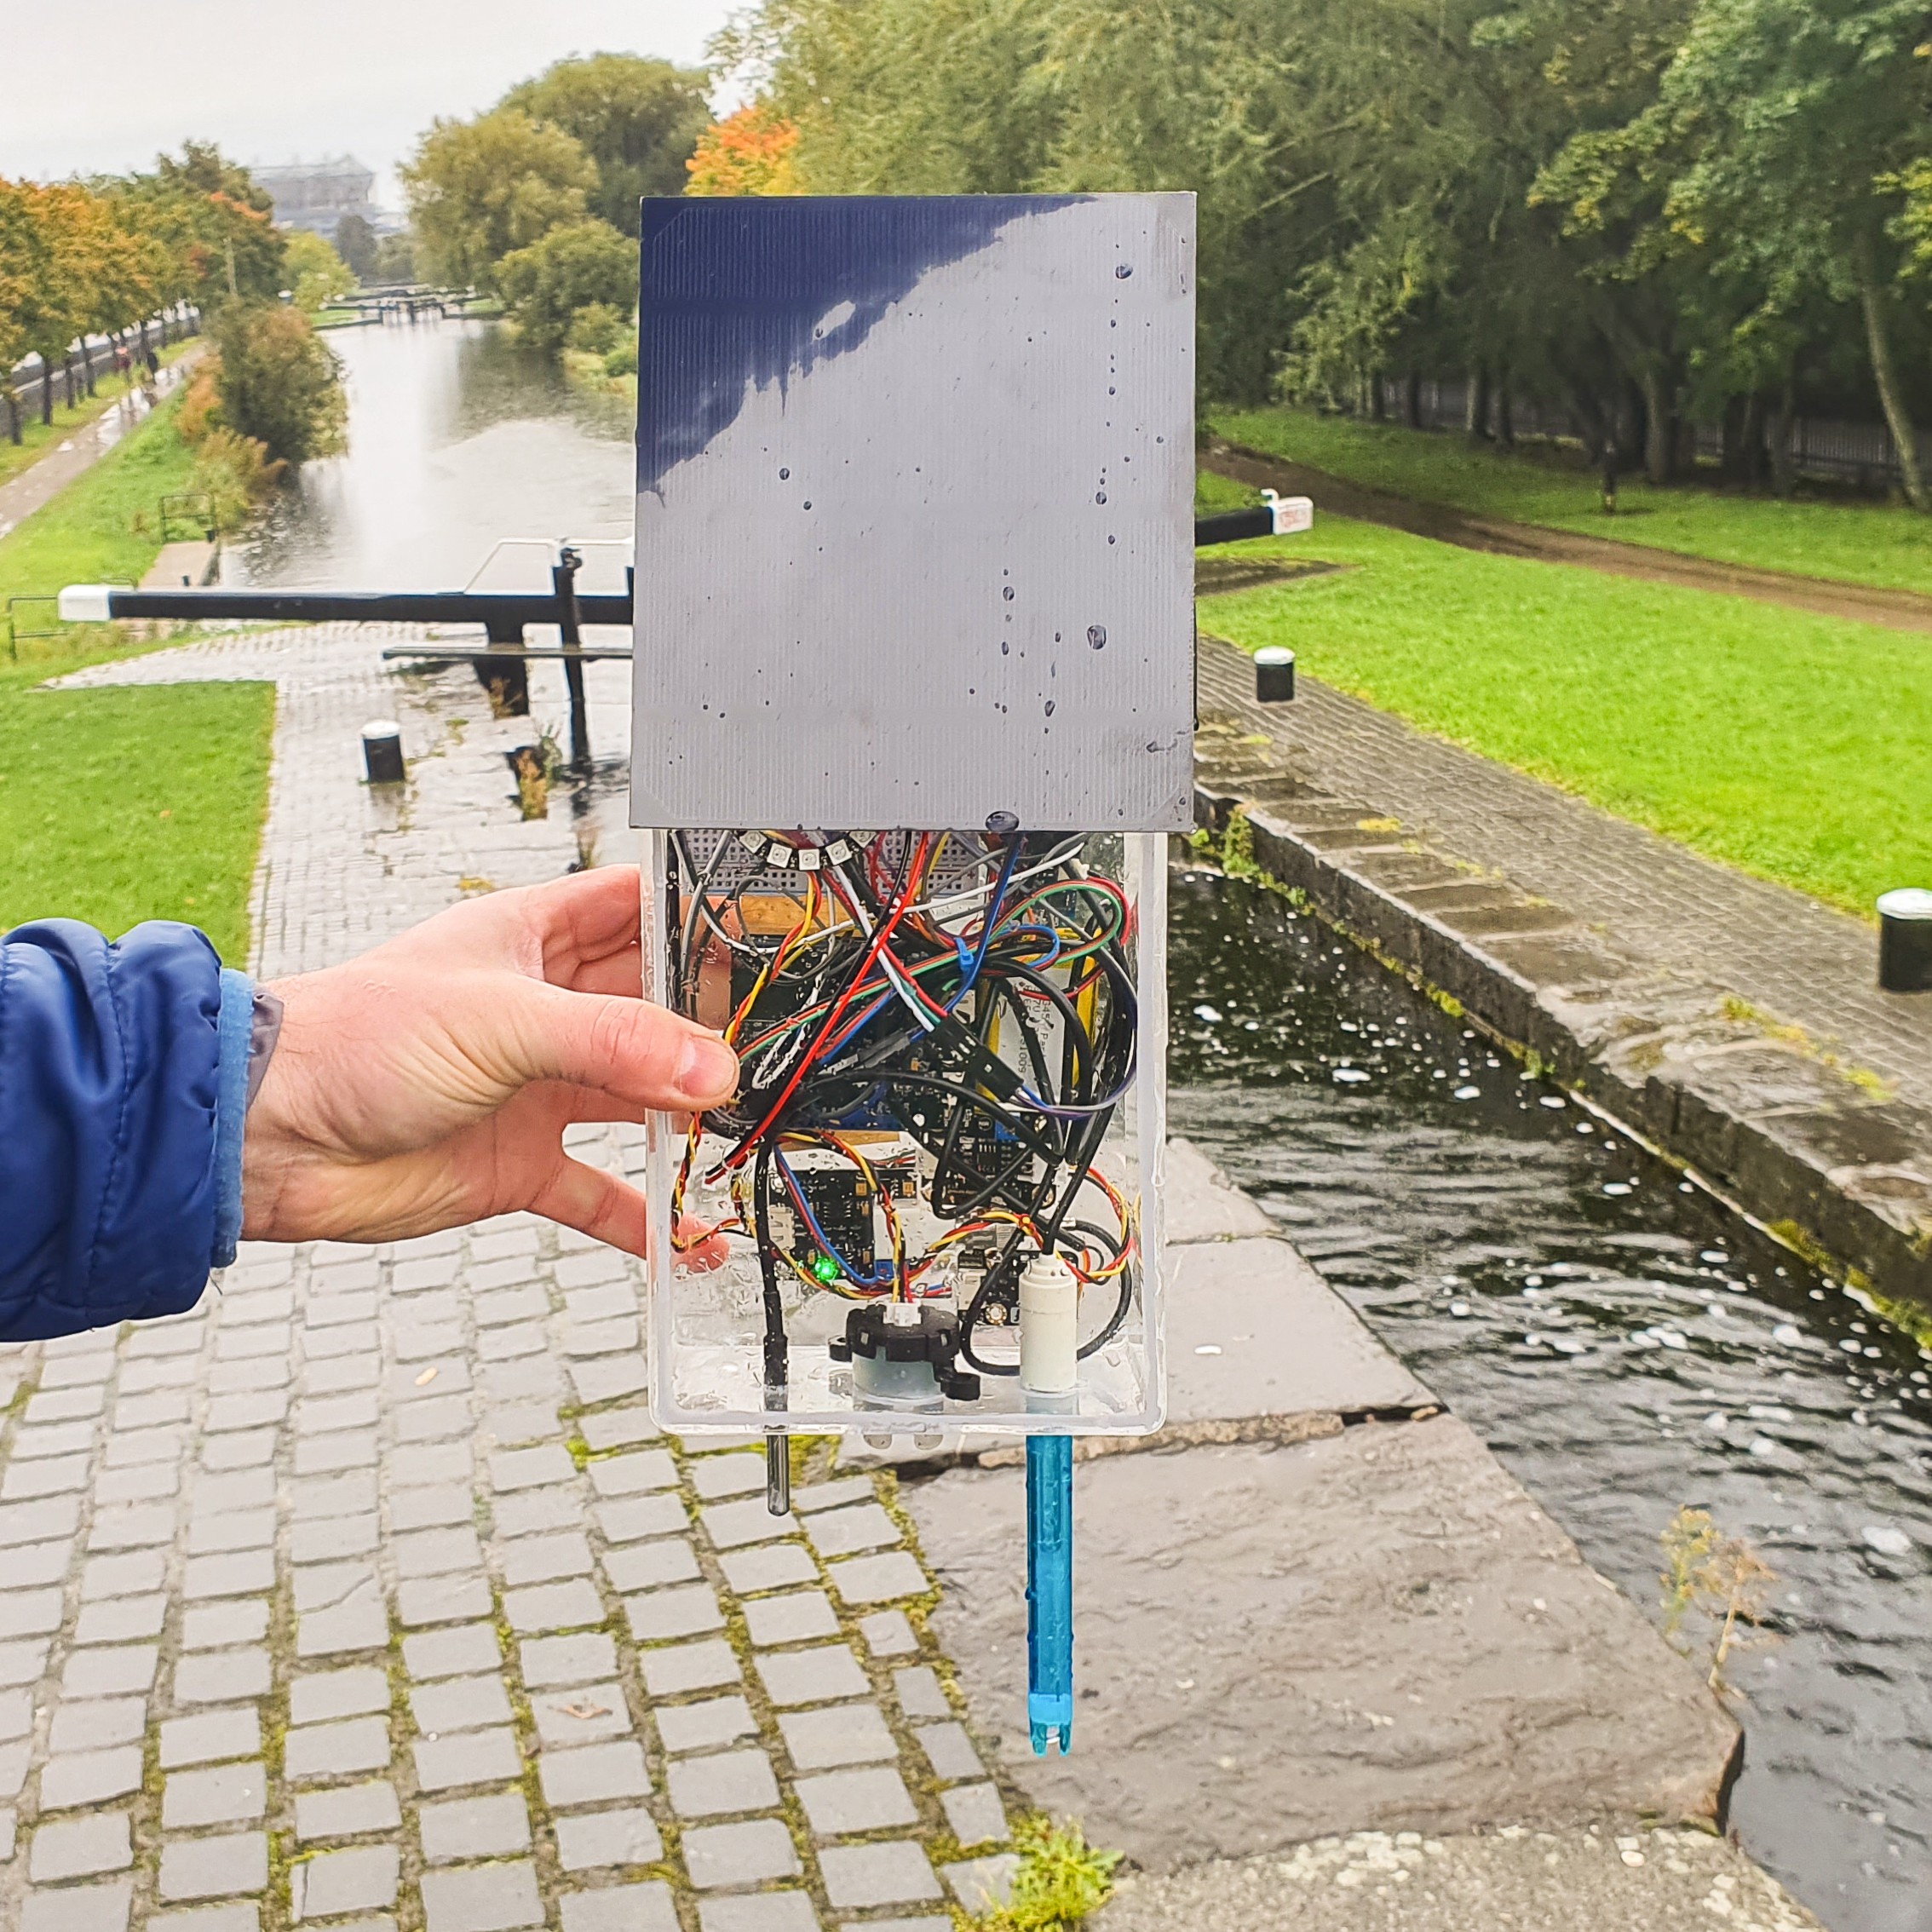
Solar Panel Added to Project
While developing the project, I came across a solar panel module I bought a while ago that I completely forgot about. So, I decided to implement it in this project. I figured out how to do the wiring and added it. It costs only an extra €20 to add this feature to a device. This allows the device to recharge the LiPo battery attached using a solar panel which can extend its battery life to months using low power mode.
Setting up has been covered throughout the article. Although the solar panel addition works perfectly with both device modes, it has been targeted at enterprise mode.
Low Power Mode Software Implementation
This can be found in the low power folder in GitHub. This code branch is designed to exponentially increase the battery life of the device by putting the microcontroller in deep sleep between data sends.
The device will only use two properties: telemetry send interval which will control the amount of time the device sleeps for between reads and the sample value which will determine the number of samples to collect from the pH and turbidity sensors. Note that the low power option is only available in enterprise mode.
The device will check for property changes when it wakes up, setting the variables accordingly and will then collect sensor data and send it to IoT Central. It will then check for property changes once more before going back to sleep.
It is preferable that low power mode be used in enterprise mode to lengthen the device’s battery life. Setup for this mode is covered throughout the article.
Going Further
This section covers new ideas and features for the project in the future. They are listed below.
- A button in the dashboard to allow a sample to be taken while the device is in personal mode remotely
- A button in the dashboard to sync the time to a time server
- Pressing a point on the dashboard map in backend to display the sensor readings at that point as well
- Figuring out how to send the battery life of the device even if solar shield is used
- Switching off power to all sensors when in deep sleep mode to further lengthen the battery life to over a year. I did did not have the time to add this unfortunately. But this can easily be added in the future through a sub circuit with a mosfet.
If you have any other ideas or features you would like to see in the project, please comment down below.
Reflection

I guess that this project started about a year ago when I got the idea and published the project on Hackster. I was then contacted by a member of the Hackaday team about the Hackaday prize. I was really excited about it and wrote up the project on Hackaday.
I was very happy to find out that I made it to the finals and started reiterating the project. I started off by completely rewriting the code of the project, making it more efficient. I then radically changed the backend of the project, going for IoT Central. I chose to do this as opposed to building my own server because IoT Central is industry standard and it allows thousands of devices to be managed and monitored with ease, this cannot be done on a personal server or previously used Soracom. It's also very easy to set up and simply works.
While developing the project, I realized that I was not getting the battery life I wanted. Although a week and a bit is fine for personal mode - where the device is not left in the field, I felt like this was not fine for enterprise mode. So I redesigned a new version of the code that puts the device into deep sleep between reads. This would increase the battery life by around 2 months.
I wanted the battery life to be closer to 5 or 6 months (the time interval the sensors have to be calibrated) so I added a solar panel battery recharging feature to the project. It was very difficult to do all of this in 2 weeks and a half (considering I also had school on). But being in 4th year (where we don't really do much) (that's 10th grade for the people in US), I had time to pull it off.
The hardest part was creating the video for the project. I don't have a camera so I have to record everything on my phone (which is shaky at times). I had to stay up to 6 in the morning to stabilize the content and export it (Adobe Media Encoder decided to stop working for me). But in the end I also managed to add a voice over (which I had a dozen filters applied to, sorry for random dips in audio). I have to admit that the one problem with the video is the PowerPoint at the start which exported at around 10fps for some reason.
If I were to do something different the next time, perhaps I would buy a ready made-case/enclosure for the project instead of making one myself. I was just afraid that it would not arrive on time and didn't take the risk. The thing I enjoyed the most was developing the code for the project and getting the mockups done.
Thank you for reading the project and I really hope you enjoyed it. If you have any questions, ideas or want to chat about projects, feel free to get in touch, I'll get back as soon as I can.