 doctek
The g-debugger (gdb) provides a very powerful debugging tool, but takes some extra effort to configure and use. It requires two parts that run in separate terminal windows. A gdb server must run in one terminal window and connects to the ST-Link. The gdb client runs in another terminal and communicates with the device being debugged via the server. The client is controlled by the person doing the debugging. The existence of this debugger is a strong argument for using an ARM processor! It provides much more robust and in depth debugging compared to the printf method, but requires more effort. I find it especially useful for hardware interaction problems. To use gdb, connect the ST-Link as described above, plug in the USB, start a new terminal window (I like UXTerm), and type ST-LINK_gdbserver. This will invoke the script in ~/bin and start the gdb server. It should now be waiting for the client to connect. I'll show this in action below.
To make the most of gdb, I compile my sketch with Tools/Optimize set to Debug (-g). This causes symbols to be available for gdb to use. When I build my sketch, I just click Verify, not upload. Next I locate the elf file for my sketch. This will be found in /tmp/arduino_build_#####, where ##### is some random number that is created by Arduino. Arduino creates a new directory (and number) for each sketch that you compile, so, I make sure the correct sketch name appears in the directory, and that the creation time is correct. For example, if the sketch I'm working on is named My_Sketch, then I look for a file named My_Sketch.ino.elf. That's the one I will load with gdb. To do that, I will use the gdb supplied with the stm32duino package. On my system, I find arm-none-eabi-gdb in ~/.arduino15/packages/STM32/tools/xpack-arm-none-eabi-gcc/9.2.1-1.1/bin. Following Al Pacini's lead, I created another script to invoke gdb - named ARM_gdb - placed it in ~/bin, and made it executable. Here is the script:
#!/bin/bash
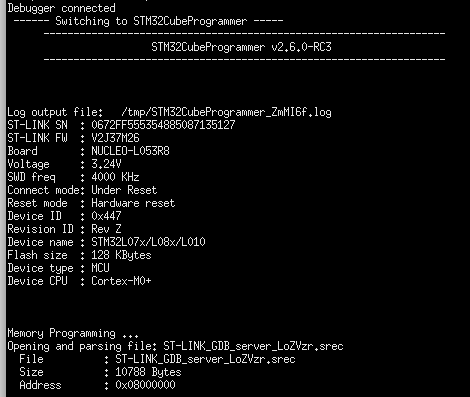
~/.arduino15/packages/STM32/tools/xpack-arm-none-eabi-gcc/9.2.1-1.1/bin/*gdb "$@"Here is what the server terminal looks like when the server is started:
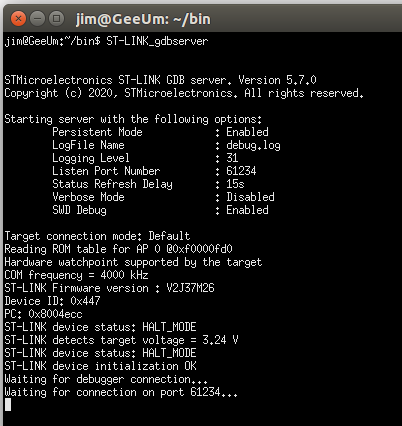
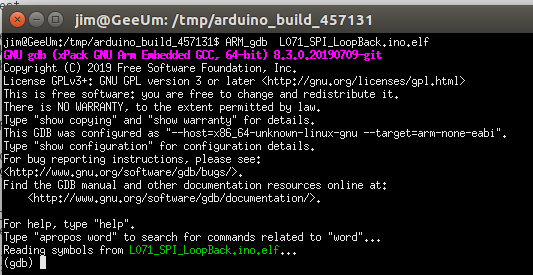
Here is the client terminal window starting the gdb client
Now the client connects with "target remote :61234"
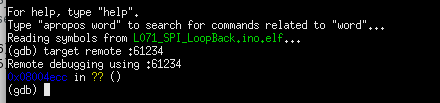
... and the server responds:

next the client causes programming of the flash with "load"
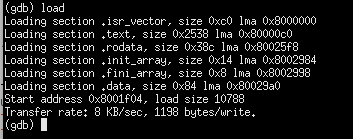
The server responds
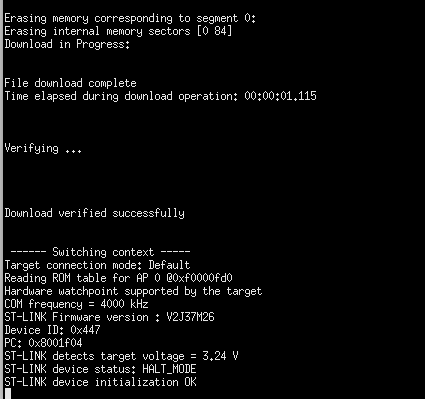
and the debugging session can begin! The server responses are not used during debugging, but this is what you would expect to see if you use gdb. Enter "cont" in the client terminal to start the loaded program. Use "^C" to stop gdb when a sketch is running, then "quit" and "y" to leave gdb. Entering "^C" in the server window will stop the server. There is no need to stop the server if you plan to use gdb again. Be sure to stop it if you want to upload using Arduino IDE.
While those are the most basic gdb commands, that is a pretty boring example. Here is gdb being used for a typical, and more interesting, problem.
I intended to use nRF24L01 radio with the L071 tArmDuino as part of a control scheme. To control the nRF24L01, the SPI interface is used. The sketch compiled fine, but would not communicate using SPI. As a simple start to debugging, I created a sketch which just did a simple SPI loop back. (The sketch L071_SPI_LoopBack1.ino is in Files if you want to play.) Using the process just described, I loaded the sketch for gdb debugging.
Have a look at the sketch. It's very simple. The loop runs to simply transmit a byte and receive the same byte. Examining the three variables with gdb will verify that the SPI works in this simple way. If this doesn't work, then I have to fix it. If it works, then more debug is needed.
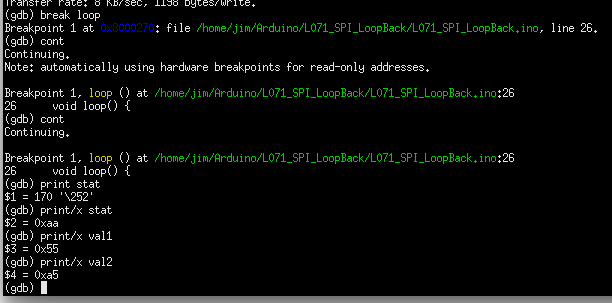
To start, I set a breakpoint with gdb at loop. Then I run the sketch with "cont". The sketch stops the first time loop is to be executed, as expected. Then I "cont" again expecting loop to execute once and stop just before executing again. At this point, I could examine the variables and see if the SPI is working. But, as you can see, there is never a second break at loop. I have to use "^C" to stop the sketch.
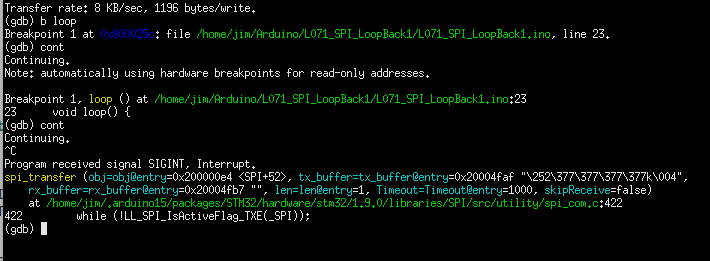
At this point, there are many gdb commands that can be used to explore the sketch. The source code for the SPI library can also be studied. Note that gdb even shows the path to the source code for the routine! But note that the routine where the forced break occurred is in the class named SPI (instantiated in SPI.h). To see the class data, I use "print SPI". Here's the result:
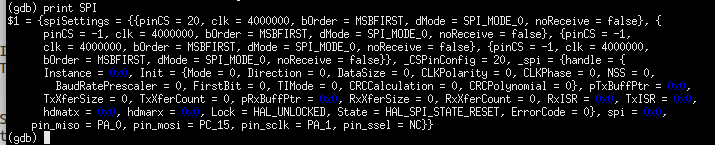
Look at the last line and note the pin names used for miso, mosi, etc. These are wrong! I went through the code and figured out why these pin names were used, but I won't bore you with the details, The observation that the pin names are wrong is the key point! The SPIClass has member functions that allow the SPI pins to be specified. These functions are used in L071_SPI_LoopBack.ino (also in Files). Using the same debug process, the SPI worked fine and I got the results I expected.
Inserting these defines into the nRF24L01 code made it work correctly! Rescued by gdb! This debug would have been very difficult with printf. Conclusion: Using gdb is a learning process in more ways than one. Not only do you learn about your program (sketch), but gdb itself has a rich command set. Learning and using gdb commands often provides additional insight into how sketches and libraries are constructed and how data structures are created by C/C++ in Arduino. It's a fascinating process that I always enjoy.
Discussions
Become a Hackaday.io Member
Create an account to leave a comment. Already have an account? Log In.