 Simon Merrett
So far in this project I have touched on the requirements, initial challenges and potential algorithms for synchronising a basic microcontroller's time to the 24 hour clock, based on daylight cycles. What I have not yet done is shown any data. And that's because, at the point in this story we have arrived at, I didn't have any....
I tried to get some data, I really did. But daylight data that you can use to test a synching algorithm with isn't quite as easy to come across as it sounds like it would be. I set myself the target of a year's worth of data, so that I could check this algorithm would work on short, dull winter days as well as it would on long bright summer ones. I trawled for open datasets of daylight readings but could not find anything which would give lux at a reasonable resolution - I considered 10 - 30 minute intervals to be a reasonable resolution so that intermittent cloud/precipitation had sufficient chance to introduce noise. And a 10+ minute wake-up interval would be reasonable for microcontrollers to perform to take light readings.
Sure, you can find out the average number of sunshine hours on a given day of the year at a given meteorological location, but I came up short for actual readings with all the noise and variability that a real system would have to dredge through to find the signal. By the way, I was focused on UK so if you have that data for other places, please link it in the comments here - hopefully it will help someone, if not me.
What to do?
Getting slightly desperate, I wondered if solar photovoltaic power production could be used as a proxy for light readings. I found that people were much keener to write and publish reports with supporting data on photovoltaic domestic electricity generation than they were about general light levels. And so it was I ended up downloading a dataset of insolation (solar radiation power) at half hourly intervals from a study of domestic photovoltaic installations in the UK (London) in 2014. Here is a link to the source: https://data.london.gov.uk/dataset/timeline/photovoltaic--pv--solar-panel-energy-generation-data
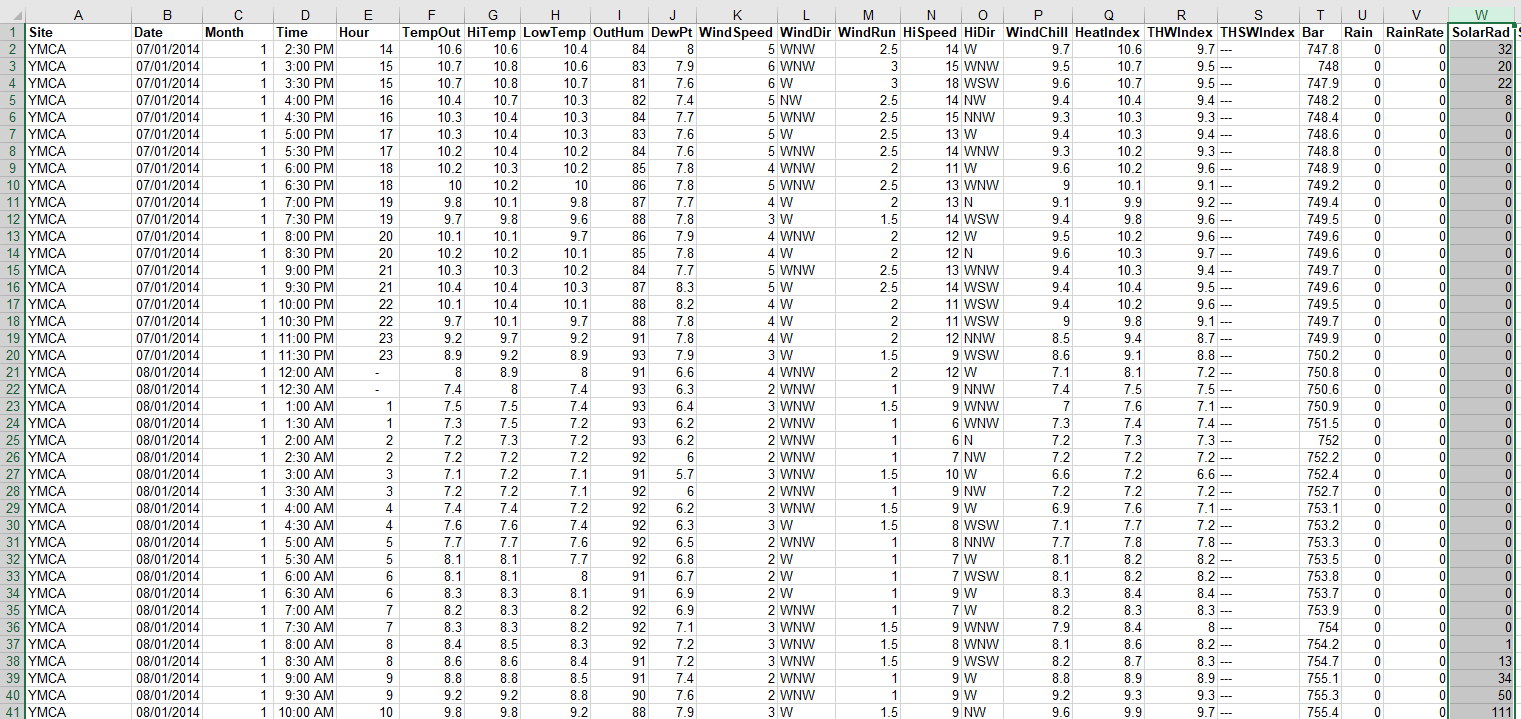
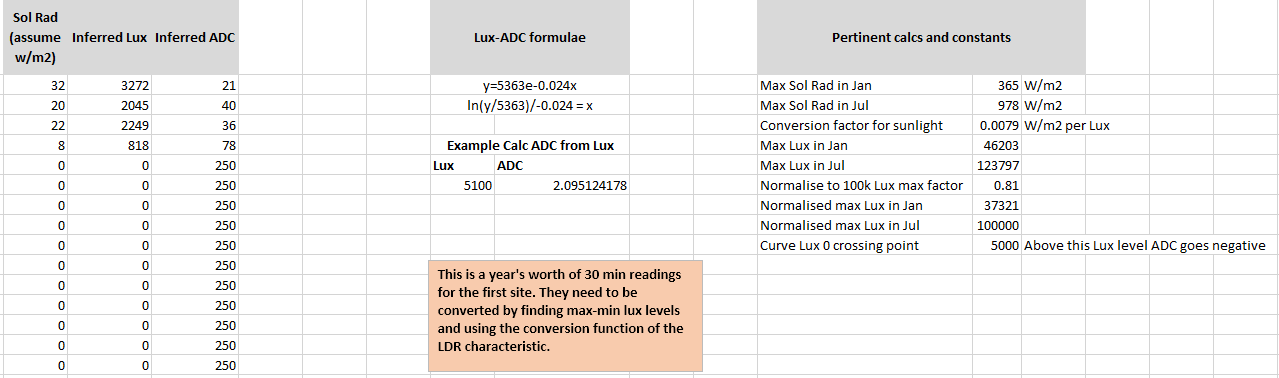
What I like about this is that it gives solar radiation in W/m2 - great stuff. However, I needed to approximate ADC readings from this - ie what an LDR voltage divider would produce as a response to these power (power density?) levels. I could not think of a good way to approximate from W/m2 -> 10 bit ADC counts from a non-linear sensor like a CdS LDR voltage divider, so I took an intermediate step (read - rabbit hole) and attempted to convert W/m2 to Lux before approximating Lux to ADC counts.
Converting to Lux
There is a not a straightforward conversion factor - ie linear proportional relationship - between W/m2 and Lux. However, I settled upon using one for my first run at this. I apologise that I cannot provide the source after a year has passed but I used 0.0079 W/m2 per Lux.
Once I had W/m2 in terms of Lux, I needed to know what my LDR voltage divider "would have been" reading if it had been out in the sun at the YMCA in London in 2014!
Converting to Volts
The best light sensor I had access to at the time was the TSL2591. To put it mildly, this is not the simplest sensor to derive a reliable Lux reading from. You will see much discussion on the Adafruit library repo issue about how to get a reliable Lux reading from it.
I decided to take matters into my own hands and characterised the TSL2591 sensor against formal photometric standards : https://github.com/SimonMerrett/TSL2591_characteristics
Essentially we are trying to take the datasheet's sensor characteristics and map the sensor's response to known brightness values. I used the awesome https://automeris.io/WebPlotDigitizer/index.html to perform this conversion of datasheet curves. Big thanks to @Jenny List for her https://hackaday.com/2016/05/12/digitize-your-graphs-with-webplotdigitizer/ article bringing this wonderful tool to my attention.
 This is a plot of the TSL2591's two channel readings against a known optical standard.
Please bear with me while I do a bit of hand-waving here. I promise I will return and add more detail if there is enough interest but it has been a year since I moved on from this particular rabbit hole and I will have to jolt some grey matter into recalling the full details for reproducibility.
So knowing the TSL2591's response to daylight, I connected the LDR voltage divider and the TSL2591 to an Arduino and made concurrent readings for a range of light levels. This allowed me to produce a relationship graph between TSL2591-based-Lux and LDR ADC readings (divided to 8 bit range):
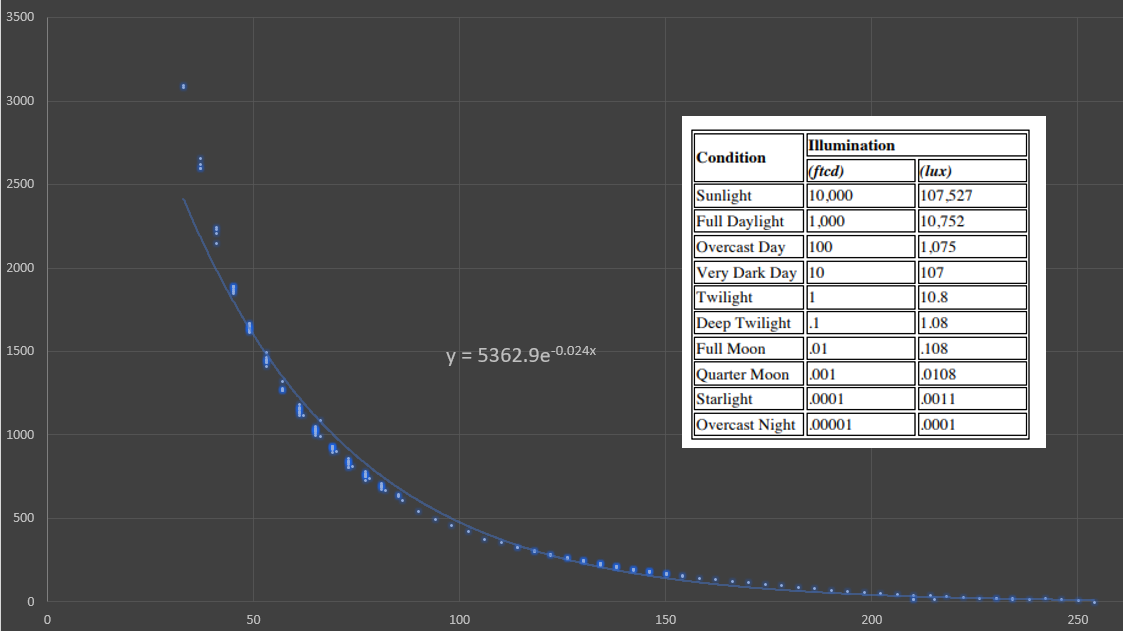
The logarithmic best fit curve kindly provided by MS Excel then allowed me to convert Lux readings from the solar power density readings in the dataset to notional 8 bit ADC readings - Hooray!
The reason why 8 bits was to make storing many readings in a byte array doable within flash memory of a small microcontroller.
That concludes the introduction and initial processing of the first dataset - next time we will start looking for patterns that may tell us the time!
Discussions
Become a Hackaday.io Member
Create an account to leave a comment. Already have an account? Log In.