 David H Haffner Sr
As my project reaches its final phases, I am reminded of the basic tenets of the scientific method:

The scientific method requires making observations, recording data, and analyzing data in a form that can be duplicated by other scientists. In addition, the scientific method uses inductive reasoning and deductive reasoning to try to produce useful and reliable models of nature and natural phenomena.
One may not really pay that much attention to this when building projects as we do but the same applies as well, especially for a project such as this.

This flow chart depicts the four basic steps in this process, sometimes I think we forget how to properly utilize this chart when rushing to complete a project to gain a little popularity and monetary gain in the market place and what happens is, the final product becomes somewhat sub-standard at best and perhaps a bit in question as to quality standards of results.
A shinny object with many bells and whistles but no substance under the hood, a good project does not make! A project with a trail of evidence acquired through the scientific method is best.
Case in point;
The two resolution tests done today 09/28/2017, were carried out with two laser pointers, a 532nm green laser <5mW and a 405nm violet laser <5mW. The point of the experiment was to test my CCD driver (TCD1304DG,) detector’s resolution as it stands at this moment, and check for consistency. Even though I am not using any diffraction grating in my test platform I have a dichroitic mirror with a cutoff at 650nm that works like a beam splitter, quite adequate for testing purposes.
The setup is simple, the entrance slit is 2 Gillette razor blades placed at 0.25mm width, distance to 1st mirror (silver coated @ 99% reflectivity,) is 70mm, the beam then travels @ 45 degrees to the dichroitic mirror and is reflected to the CCD @ 39 degrees (blaze angle).
In this way I can capture 85 percent of the beams wavelength and tame the Ariel disk effect without having to use any additional filters or optics. A rather unconventional approach I know, but it works.
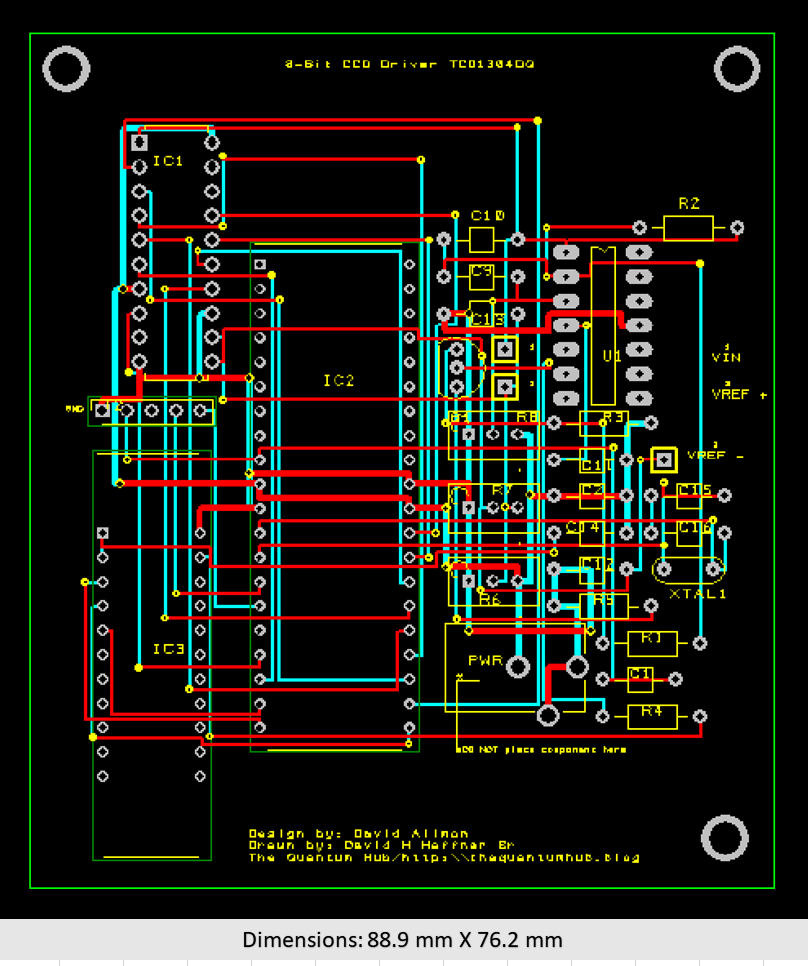
This test platform allows me to utilize this circuit as my Beta board, meaning it’s not the final product. This lets me test its functionality in real time and lets me make real time adjustments and design changes as needed. The final board is already to go as soon as I do a few more test runs on this one and I’ll send off the files to get the PCB’s made.
The new dimensions will allow for an excellent fit in the main spectrometer’s enclosure, I was able to reduce the circuit board to 3.5” X 3” (88.9 X 76.2 mm).
Step number two in the scientific process here as it relates to spectroscopy is, spectral calibration. What I mean by this is, I can’t just drop a sample in the cuvette holder and shoot an image and call it a day, post a spectrum and claim its what I said it is, it doesn’t work that way.
There are standards of practice when it comes to qualitive chemical analysis.
- Use Traceable Standard Reference Materials
Reference material uses include validating methods that help ensure accurate data from individual test runs, calibrating instruments and assessing analyst proficiency. In the United States, a NIST standard reference material is considered the “gold standard” for that material.
2. Run in Duplicate
The purpose of duplicate (sometimes triplicate) testing is to add to the confidence that the test run has produced good data for the test object. Replicate data that agrees is a good measure of method reproducibility but does not prove data accuracy (validity). If the same test run includes a reference material, then the confidence in the validity of the data for the test object is significantly raised. If the object’s replicate test data is not in agreement, one or more of the data points may be invalid; the object should be retested and/or the procedure should be reviewed.
3. Keep Original Data
Whether data is first recorded in electronic/digital form, in a notebook or on the closest piece of scrap paper, keep it. In modern laboratories, handwritten original data is no longer the norm, but if data is first recorded by hand, that document becomes critical to maintain. No matter how often the data is transposed to electronic spreadsheets, databases or any other media, the initial point at which the data is recorded must become part of the documentation.
4. Calibrate Instruments
Instrument calibration, for this discussion, is confirming that an instrument is working correctly before performing a test method, whether a simple balance or a sophisticated analyzer, or a certified reference standard.
5. Use Control Charts
Control charts are excellent tools for several uses, including those already noted. A control chart enables a laboratory to track the results of a reference material and/or control sample at the end of each test run. It gives the laboratory a snapshot of test run quality and a picture of the quality of the laboratory’s results for that test over time.
A Shewhart control chart plots individual test results for a reference material or control sample over time.4 While Shewhart set a 3-sigma deviation from the mean as acceptable control limits, control limits can be set on a case-by-case basis. Customers of the test method should have input into setting control limits.
6. Document Everything and Maintain Good Records
To return to the golden rule of, “If you didn’t document it, you didn’t do it,” organized records benefit a test organization. An ordered records system can be a prima facie indication to customers, auditors, government and legal authorities, and others that the organization follows its procedures. Records provide a fount of information for training new staff members to perform the stable of methods of the laboratory. When customers request copies of their test results, they are readily available, which makes for satisfied and repeat customers. More important, when test results must be defended, these documents are critical.
These are the six most important rules in qualitive analytical chemistry and should always be followed.
The calibration standard that I will be using is Holmium Oxide, standard reference material #2034 (wavelength standard). The cost was just over $400.00 US, but well worth the investment to me. Holmium oxide liquid is commonly used as a wavelength standard for the calibration of spectrophotometers. It has many desirable features that have made it a commonly used wavelength standard.
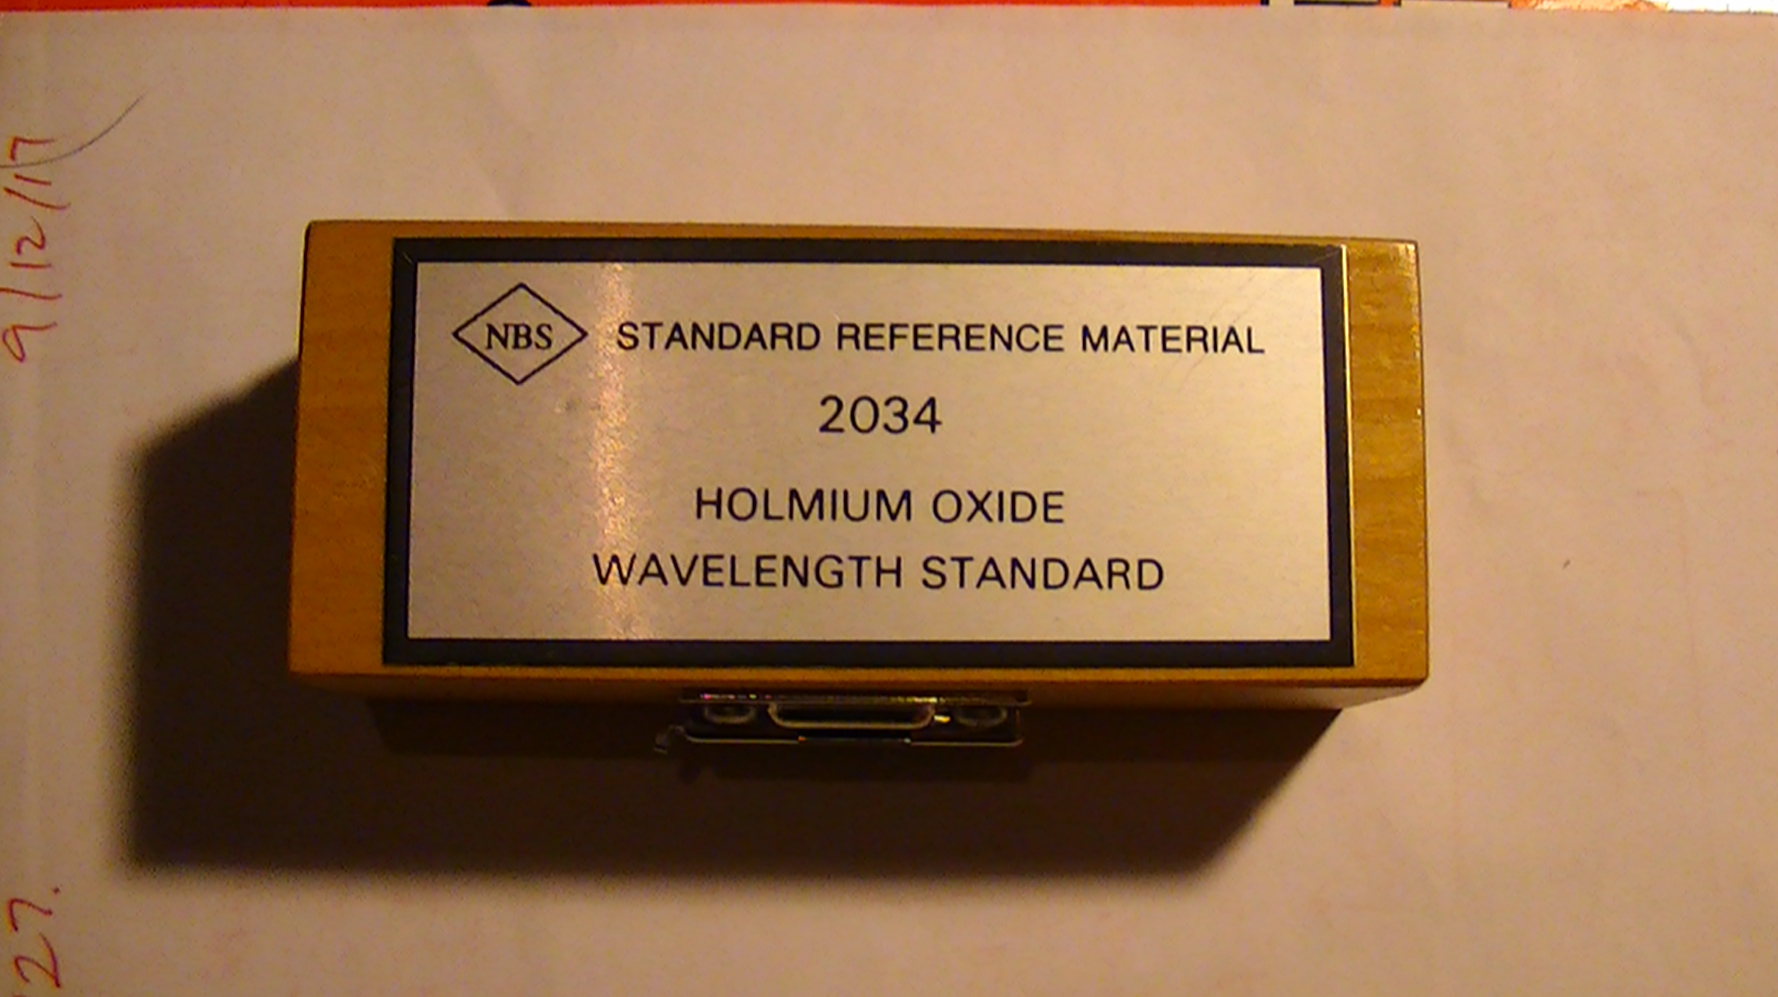
This is my investment in my project.
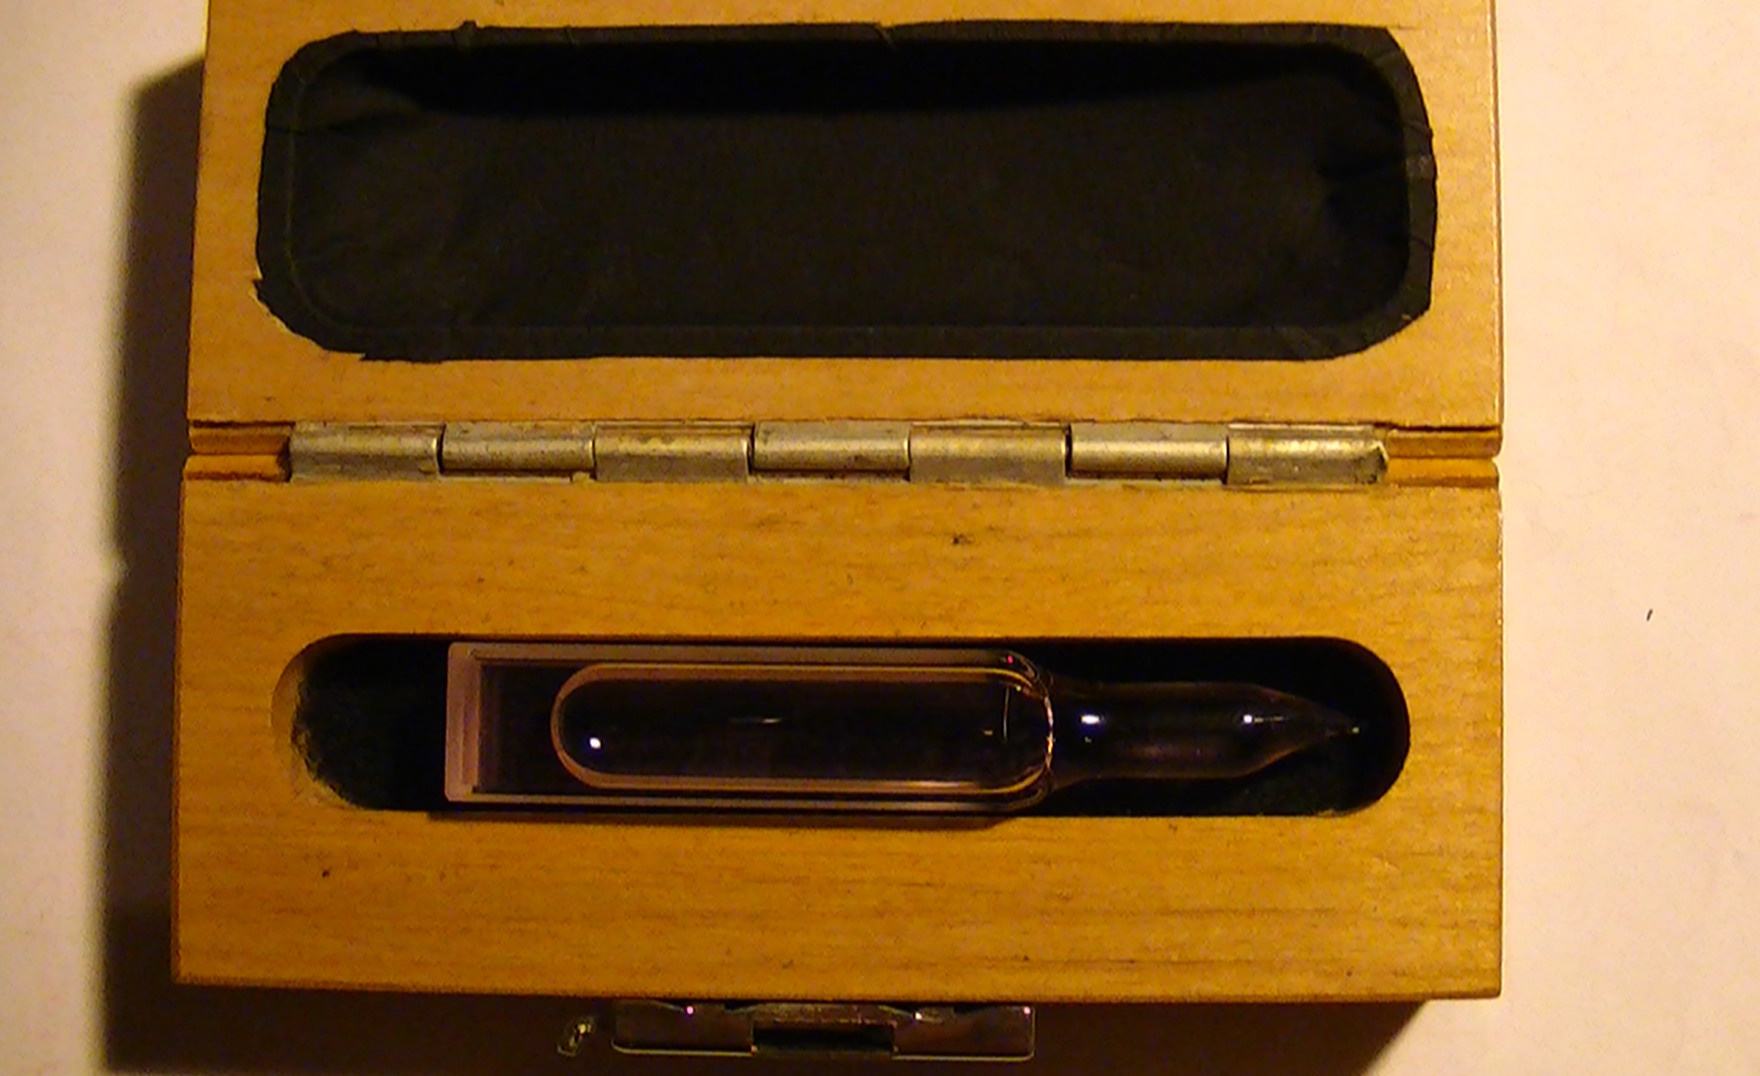
You can see it is completely sealed.
Volume 112, Number 6, November-December 2007 Journal of Research of the National Institute of Standards and Technology

Fig. 1. Spectral transmittance of holmium oxide glass showing 11 NIST certified bands. A line has been inserted for band 8 for clarification. The position of the wavelength minima is the critical parameter, while the level of transmittance can be considered irrelevant.
Table 1. Certified wavelengths of minimum transmittance of the holmium oxide glass filter for a spectral bandwidth of 1 nm. Band 1 may be absent from some glasses due to UV absorbance.
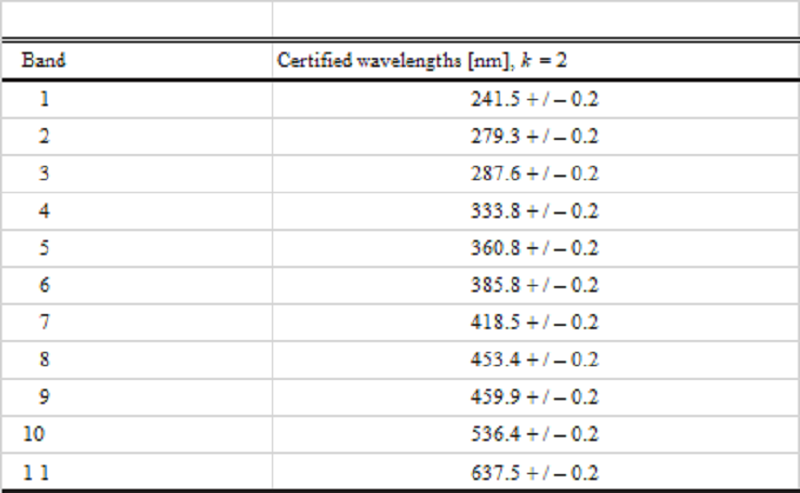
These 11 bands will ensure that my spectrometer is not only properly calibrated, but ready to process real Raman spectra.
Now for part three;
With my testing platform, I imaged 2 laser pointers, 1 violet 405nm <5mW laser pointer and 1 green 532nm <5mW laser pointer. The objective was to reproduce previous results from a similar experiment using a red 650nm <5mW laser pointer were the results showed a resolution factor of 1nm.
Table 2. FWHM (forward width half maximum,) values for the violet 405nm laser pointer.

The wavelength values will be skewed because I cannot calibrate the spectrums yet, but that is coming soon, but the results are very clear, @ 0.5 millisecond integration time I have a resolution factor of 0.97368nm.
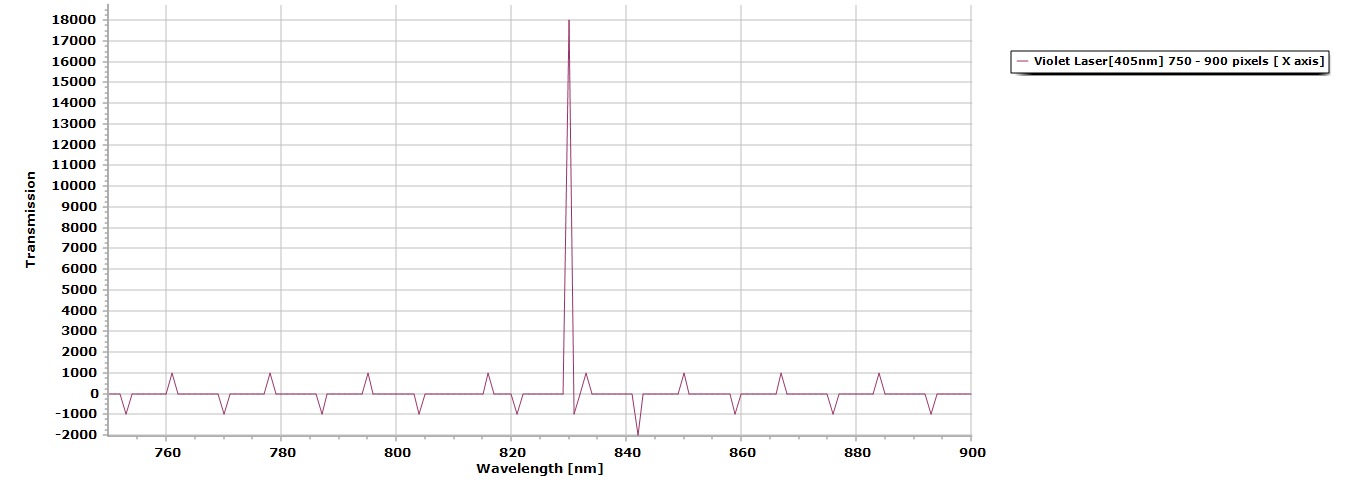
Figure 2. Here is the processed data from its initial absorption spectra to its transmission data using Spectragryph 1.2.5 spectroscopy processing software.
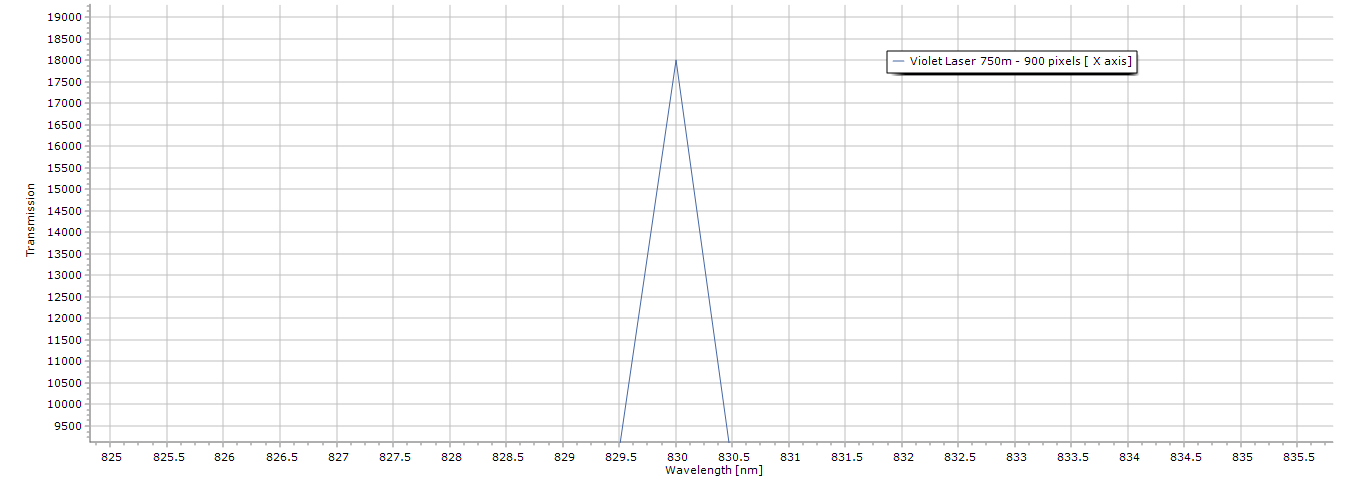
Figure 3. Zoomed in view of the laser peak, notice even without the presence of any diffraction grating there is no spectral distortion due in part because of the dichroitic mirror’s use.
Table 3. FWHM (forward width half maximum,) values for the green <5mW laser pointer.
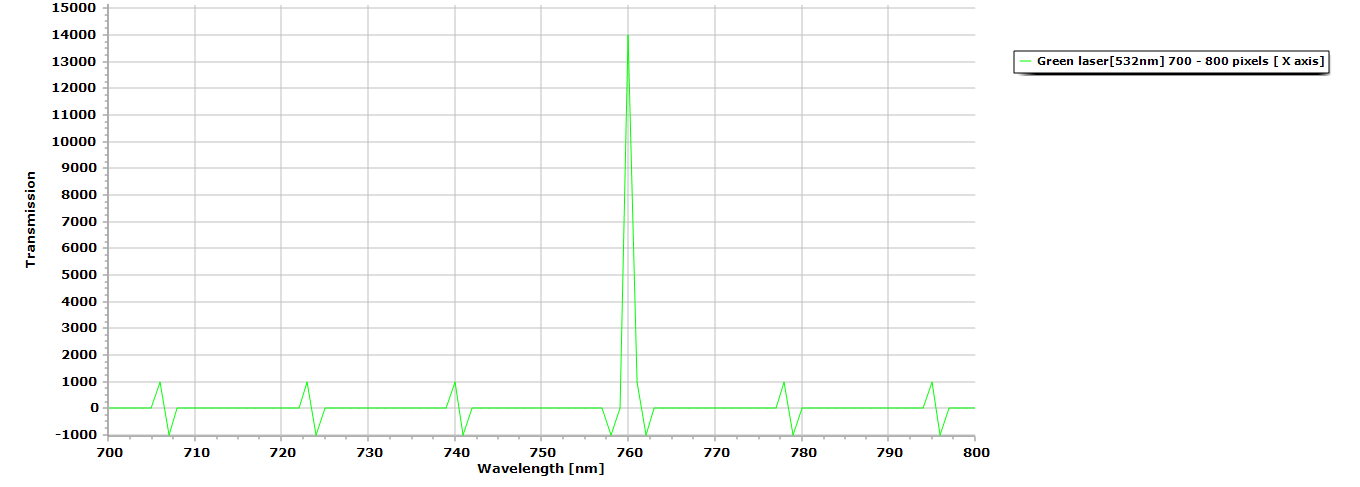
Figure 3. Here is the processed data (green laser pointer,) from its initial absorption spectra to its transmission data using Spectragryph 1.2.5 spectroscopy processing software.
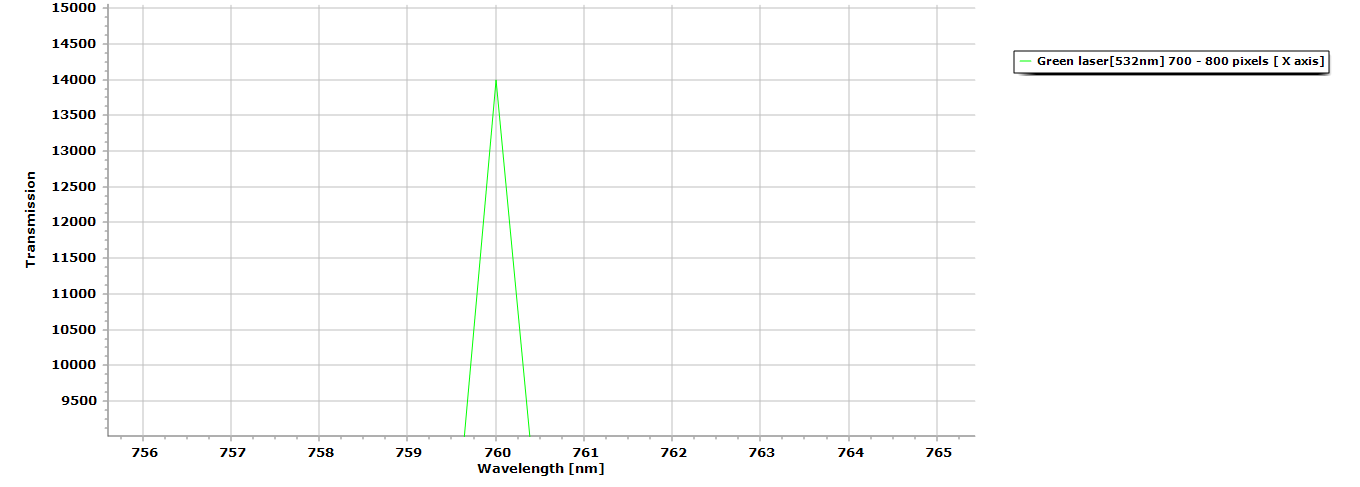
Figure 4. Zoomed in view of the laser peak, notice even without the presence of any diffraction grating there is no spectral distortion due in part because of the dichroitic mirror’s use.
Table 4. FWHM (forward width half maximum,) values for the red <5mW laser pointer.

Figure 4. Here is the processed data (red laser pointer,) from its initial absorption spectra to its transmission data using Spectragryph 1.2.5 spectroscopy processing software.

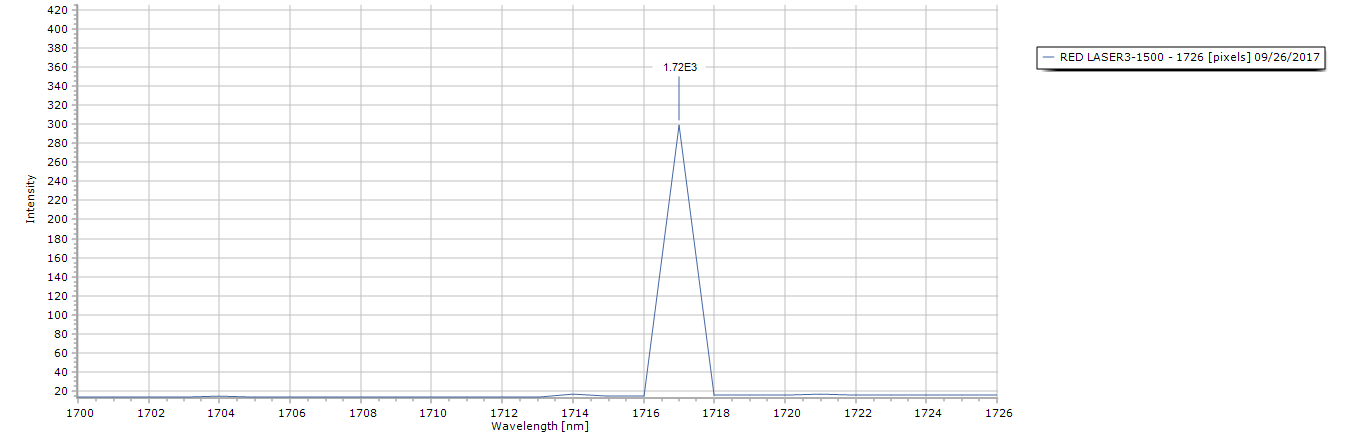
Figure 5. Zoomed in view of the laser peak, notice even without the presence of any diffraction grating there is no spectral distortion. I could not use the dichroitic mirror for this as its cutoff is 650nm, so I bounced it off a holographic grating sheet (1000 ln/mm) angled @ 45 degrees.
So, in conclusion, we have three laser pointers with the same resolution results, even though the last test with the red laser pointer used a different method, it does not negate the overall test results because we are testing CCD resolution.
There is still work to be done as far as the noise floor (SNR – signal to noise ratio,) but the final circuit board design should take care of that with precise adjustments.
References
https://www.astm.org/SNEWS/ND_2010/zimmerman_nd10.html
Discussions
Become a Hackaday.io Member
Create an account to leave a comment. Already have an account? Log In.