 Sagar 001
I made 2 different oscilloscope and these are featured on this platform. And now I came up with an idea of dual channel oscilloscope. This one has main microcontroller as Arduino and 1.3” OLED display. This time I also have battery operating options and onboard charging circuit also. You can make this on breadboard first and then go with my PCB layouts given below. A big shoutout to JLCPCB to sponsor this project of dual channel Arduino scope.
This is not only the scope, also have some extra features of DDS_PWM (function generator with 8 different waveforms), Pulse generator and frequency counter. I find this project on a Japanese webpage, but all the explanation is here for you guys.
Features:
The max real time sampling rates are 17.2ksps with 2 channels and 307ksps with a channel. The max equivalent time sampling rates is 16Msps with single channel.
- Single-channel -30Khz bandwidth
- Onscreen- Volt/Div and Time/Div
- Duty cycle monitoring
- Small 1.3 inch I2C
- AC/DC measurements option
- Mode changing, Hold state features
- Dual channel Switching mode
- Pulse generator option
- DDS_PWM waveform generator
- Frequency counter
- Low battery consumption
- Portable and pocket-sized
Important note:
This project is only for educational purposes and shows the capabilities of a 16Mhz 8-bit microcontroller board. This MCU Can support frequencies below 50KHz, so it can’t be applicable for commercial and professional uses. That way, the project can also be entitled POOR MAN OSCILLOSCOPE for me. Also I found this helpful in project related to audio frequency below.
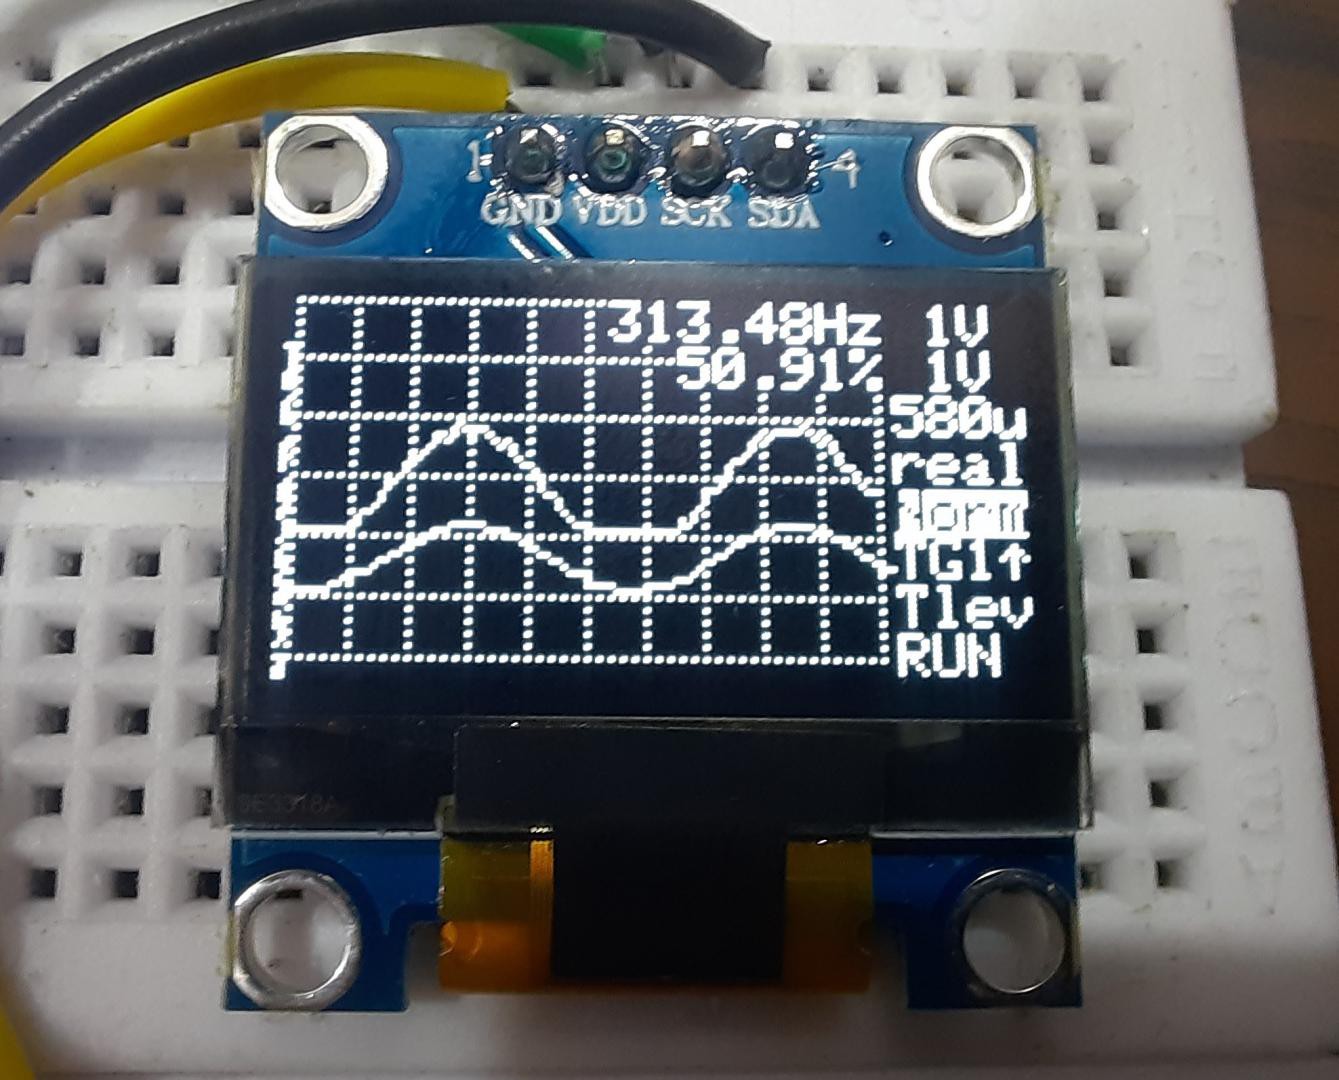
Display:

1.3 -inch OLED display with I2C function comes with two different models, SSD1306 and SH1106, to change the code as per requirements. We have to uncomment which version of LCD we are using in this project. And the screen is able to represent the nature of the wave with duty cycle and frequency in two channels.
Components used:
- Arduino Nano
- 1M resistors
- 10k resistors
- 1.3 inch OLED display
- 100nF capacitors
- 4 tactile buttons
- 5v power supply
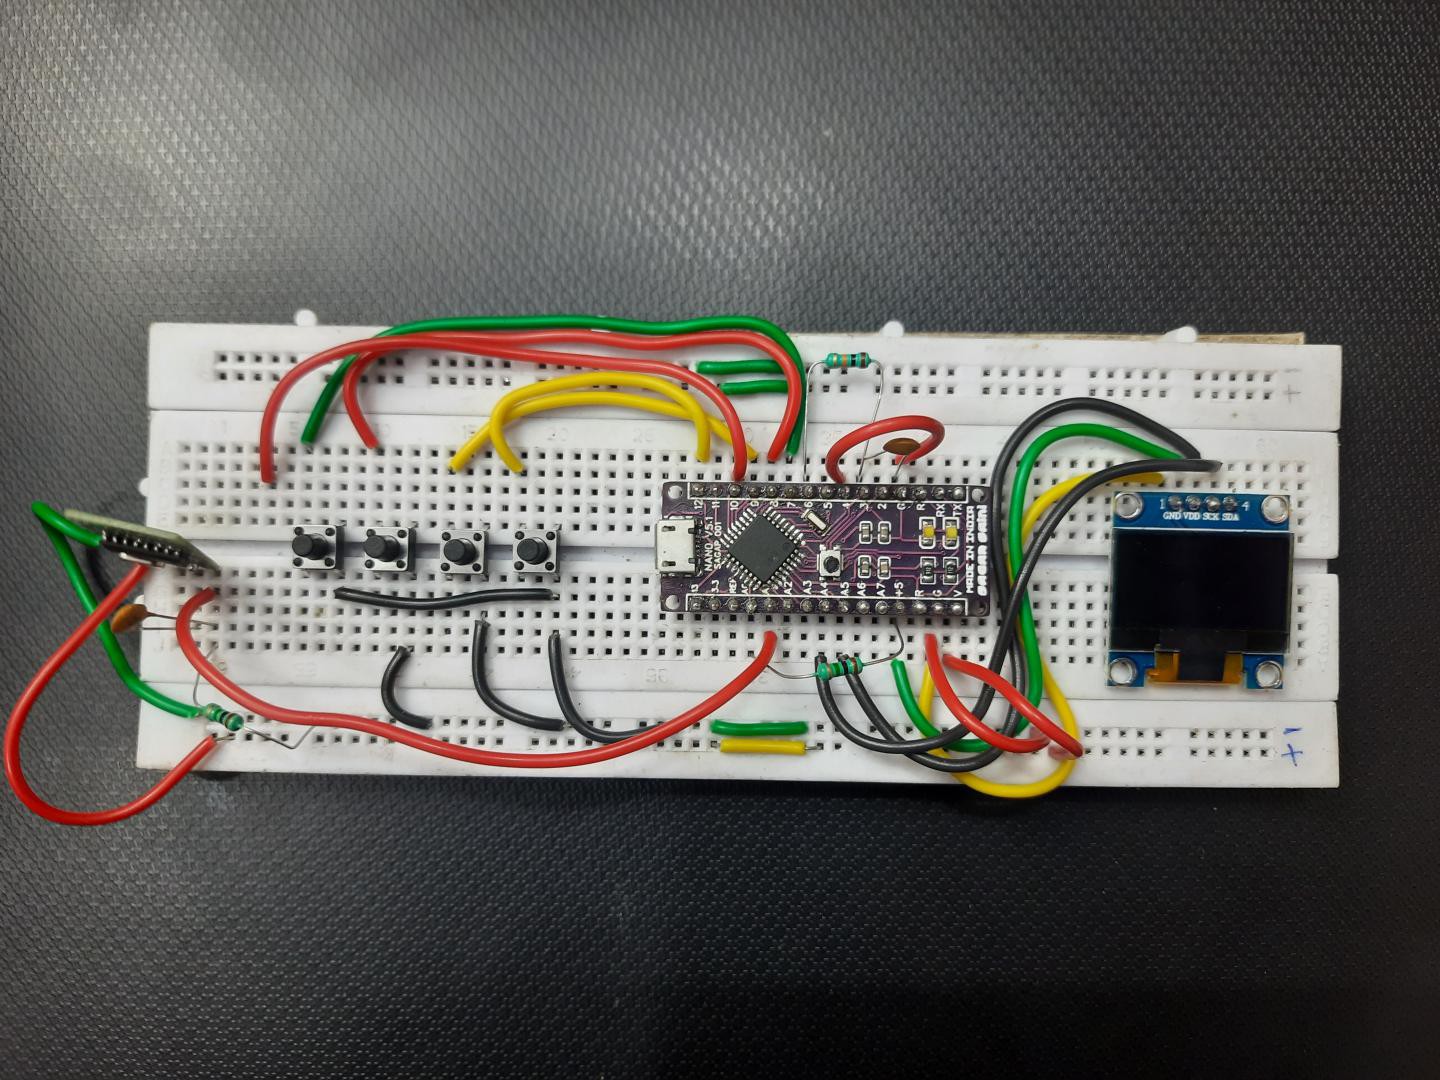
Pictorial circuit diagram:

As always this is the pictorial circuit, I minimized the circuit to its operation of one channel. if you want to utilize both channels just follow the main circuit diagram given below.
And big thanks to "Cirkit designer" software for proving such a great tool to present the circuit and wiring in pictorial format. This will be a easier method to understand for a newcomer or students.
For now cirkit designer is available in free for all (Download from Here), so there is no reason not to take advantage of this offer. As a review, I found this very helpful for my projects. some special features of the software are: code compilation, BOM manager, Breadboard and Custom components creating.
Circuit diagram:
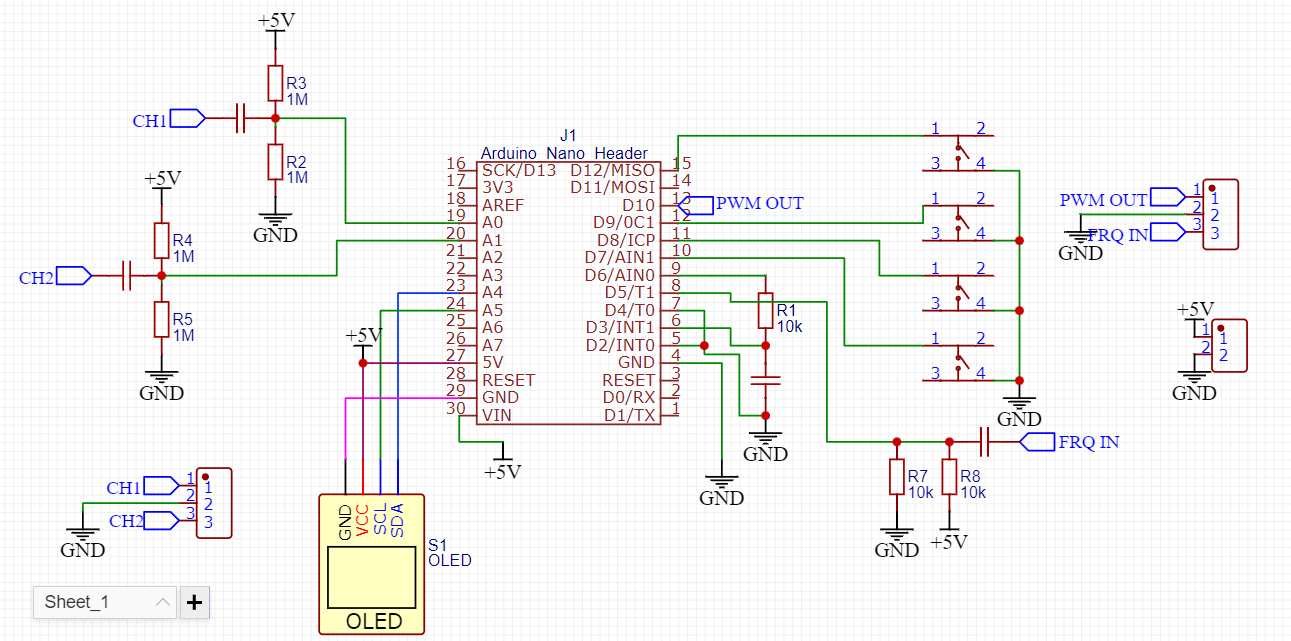
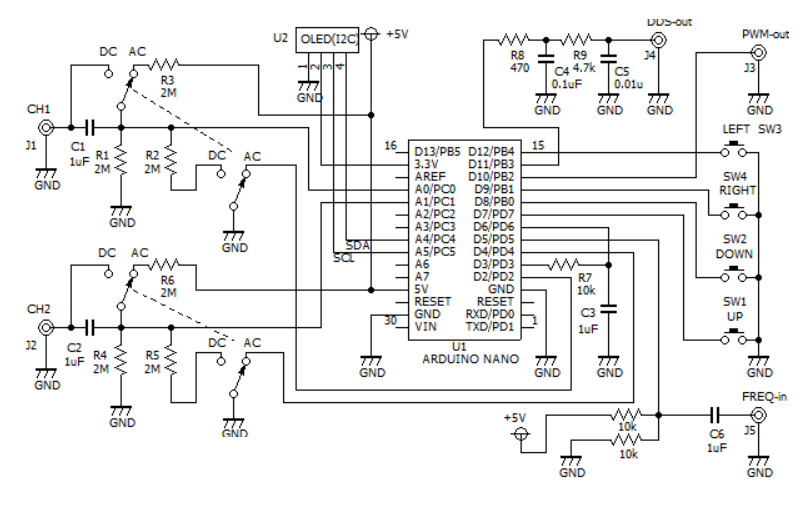
Circuit description:
Pin usage
A0 oscilloscope probe ch1
A1 oscilloscope probe ch2
A4 I2C SDA
A5 I2C SCL
D3 PWM output for trigger level
D4 Up button
D6 trigger level input
D8 Down button
D9 Right button
D10 Pulse generator output
D11 PWM DDS output
D12 Left button
This small oscilloscope can be powered using 5volts @200mA. You can see two different circuits above, both are fine but one made by me is simplified and most useable in all cases. you can modify the circuit as per own.
Just have a look on those pretty waves in the oscilloscope.


This time the circuit also have external frequency measuring and PWM, DDS pulse output options with 2 channels. 4 tactile button is to trigged on pulling down. All the resistors are for proper baising. As a improvement you can made the PCB layouts of your circuit and order them just in $2 from JLCPCB. By the way if you want to use mine, given below you can download. Sign-up using my link will give you PCB coupons as reward for Prototype SMT service. Why not take advantage of $27 worth coupons in free.
Exploring the Menu:
Full menu has more options than the previous arduscope project. Yet, I don't get the big screen. May be next time I will built one using TFT and mega2560 board.

Channel switching option:
Turn the second channel off when not in use because this will increase the sampling rate too.
Voltage readings:
Also will also display the max and min value of the signal which is known as amplitude.

Voltage/ Divisions:

Time/Divisions:

Code:
I got the code in Hex format, but it is confirmed that in the INO Arduino files there are some supporting files. I got my hands on the Arduino INO code of these supporting files. Once I will get the full code, I will share and you would change it by own. Still the HEX file is working properly. If you don’t know how to program Arduino with HEX file then have a look on this tutorial. Download the code for this project from here.
Frequency counter:
//int dataMin;                   // buffer minimum value (smallest=0)
//int dataMax;                   //        maximum value (largest=1023)
//int dataAve;                   // 10 x average value (use 10x value to keep accuracy. so, max=10230)
//int dataRms;                   // 10x rms. value

void dataAnalize() {                       // 波形の分析 get various information from wave form
  long d;
  long sum = 0;
  byte *waveBuff = data[sample+0];

  // search max and min value
  dataMin = 255;                          // min value initialize to big number
  dataMax = 0;                             // max value initialize to small number
  for (int i = 0; i < SAMPLES; i++) {     // serach max min value
    d = waveBuff[i];
    sum = sum + d;
    if (d < dataMin) {                     // update min
      dataMin = d;
    }
    if (d > dataMax) {                     // updata max
      dataMax = d;
    }
  }

  // calculate average
  dataAve = (10 * sum + (SAMPLES / 2)) / SAMPLES;  // Average value calculation (calculated by 10 times to improve accuracy)

  // 実効値の計算 rms value calc.
//  sum = 0;
//  for (int i = 0; i < SAMPLES; i++) {     // バッファ全体に対し to all buffer
//    d = waveBuff[i] - (dataAve + 5) / 10;  // オーバーフロー防止のため生の値で計算(10倍しない)
//    sum += d * d;                          // 二乗和を積分
//  }
//  dataRms = sqrt(sum / SAMPLES);          // 実効値の10倍の値 get rms value
}

void freqDuty() {                               // 周波数とデューティ比を求める detect frequency and duty cycle value from waveform data
  int swingCenter;                              // center of wave (half of p-p)
  float p0 = 0;                                 // 1-st posi edge
  float p1 = 0;                                 // total length of cycles
  float p2 = 0;                                 // total length of pulse high time
  float pFine = 0;                              // fine position (0-1.0)
  float lastPosiEdge;                           // last positive edge position

  float pPeriod;                                // pulse period
  float pWidth;                                 // pulse width

  int p1Count = 0;                              // wave cycle count
  int p2Count = 0;                              // High time count

  boolean a0Detected = false;
  //  boolean b0Detected = false;
  boolean posiSerch = true;                     // true when serching posi edge

  swingCenter = (3 * (dataMin + dataMax)) / 2;  // calculate wave center value

  for (int i = 1; i < SAMPLES - 2; i++) {      // scan all over the buffer
    if (posiSerch == true) {   // posi slope (frequency serch)
      if ((sum3(i) <= swingCenter) && (sum3(i + 1) > swingCenter)) {  // if across the center when rising (+-3data used to eliminate noize)
        pFine = (float)(swingCenter - sum3(i)) / ((swingCenter - sum3(i)) + (sum3(i + 1) - swingCenter) );  // fine cross point calc.
        if (a0Detected == false) {              // if 1-st cross
          a0Detected = true;                    // set find flag
          p0 = i + pFine;                       // save this position as startposition
        } else {
          p1 = i + pFine - p0;                  // record length (length of n*cycle time)
          p1Count++;
        }
        lastPosiEdge = i + pFine;               // record location for Pw calcration
        posiSerch = false;
      }
    } else {   // nega slope serch (duration serch)
      if ((sum3(i) >= swingCenter) && (sum3(i + 1) < swingCenter)) {  // if across the center when falling (+-3data used to eliminate noize)
        pFine = (float)(sum3(i) - swingCenter) / ((sum3(i) - swingCenter) + (swingCenter - sum3(i + 1)) );
        if (a0Detected == true) {
          p2 = p2 + (i + pFine - lastPosiEdge); // calucurate pulse width and accumurate it
          p2Count++;
        }
        posiSerch = true;
      }
Pulse generator:
void dataAnalize() {                       // 波形の分析 get various information from wave form
  long d;
  long sum = 0;
  byte *waveBuff = data[sample+0];

  // search max and min value
  dataMin = 255;                          // min value initialize to big number
  dataMax = 0;                             // max value initialize to small number
  for (int i = 0; i < SAMPLES; i++) {     // serach max min value
    d = waveBuff[i];
    sum = sum + d;
    if (d < dataMin) {                     // update min
      dataMin = d;
    }
    if (d > dataMax) {                     // updata max
      dataMax = d;
    }
  }

  // calculate average
  dataAve = (10 * sum + (SAMPLES / 2)) / SAMPLES;  // Average value calculation (calculated by 10 times to improve accuracy)

  // 実効値の計算 rms value calc.
//  sum = 0;
//  for (int i = 0; i < SAMPLES; i++) {     // バッファ全体に対し to all buffer
//    d = waveBuff[i] - (dataAve + 5) / 10;  // オーバーフロー防止のため生の値で計算(10倍しない)
//    sum += d * d;                          // 二乗和を積分
//  }
//  dataRms = sqrt(sum / SAMPLES);          // 実効値の10倍の値 get rms value
}

void freqDuty() {                               // 周波数とデューティ比を求める detect frequency and duty cycle value from waveform data
  int swingCenter;                              // center of wave (half of p-p)
  float p0 = 0;                                 // 1-st posi edge
  float p1 = 0;                                 // total length of cycles
  float p2 = 0;                                 // total length of pulse high time
  float pFine = 0;                              // fine position (0-1.0)
  float lastPosiEdge;                           // last positive edge position

  float pPeriod;                                // pulse period
  float pWidth;                                 // pulse width

  int p1Count = 0;                              // wave cycle count
  int p2Count = 0;                              // High time count

  boolean a0Detected = false;
  //  boolean b0Detected = false;
  boolean posiSerch = true;                     // true when serching posi edge

  swingCenter = (3 * (dataMin + dataMax)) / 2;  // calculate wave center value

  for (int i = 1; i < SAMPLES - 2; i++) {      // scan all over the buffer
    if (posiSerch == true) {   // posi slope (frequency serch)
      if ((sum3(i) <= swingCenter) && (sum3(i + 1) > swingCenter)) {  // if across the center when rising (+-3data used to eliminate noize)
        pFine = (float)(swingCenter - sum3(i)) / ((swingCenter - sum3(i)) + (sum3(i + 1) - swingCenter) );  // fine cross point calc.
        if (a0Detected == false) {              // if 1-st cross
          a0Detected = true;                    // set find flag
          p0 = i + pFine;                       // save this position as startposition
        } else {
          p1 = i + pFine - p0;                  // record length (length of n*cycle time)
          p1Count++;
        }
        lastPosiEdge = i + pFine;               // record location for Pw calcration
        posiSerch = false;
      }
    } else {   // nega slope serch (duration serch)
      if ((sum3(i) >= swingCenter) && (sum3(i + 1) < swingCenter)) {  // if across the center when falling (+-3data used to eliminate noize)
        pFine = (float)(sum3(i) - swingCenter) / ((sum3(i) - swingCenter) + (swingCenter - sum3(i + 1)) );
        if (a0Detected == true) {
          p2 = p2 + (i + pFine - lastPosiEdge); // calucurate pulse width and accumurate it
          p2Count++;
        }
        posiSerch = true;
      }
Download the code file from here, this will be in Hex format for now. To upload the hex files in Arduino see our previous tutorials.
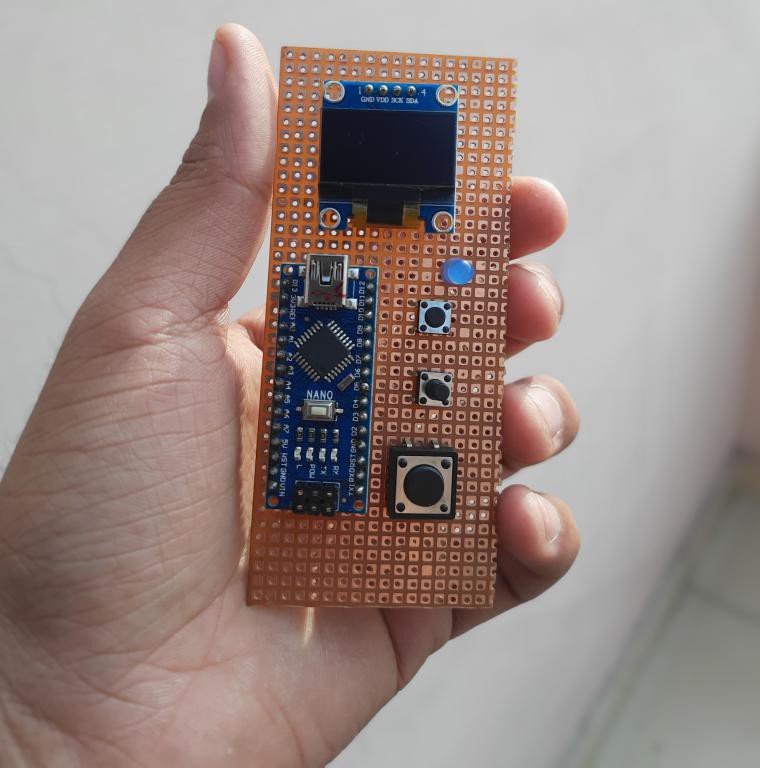
Pcb files:
All thanks to JLCPCB and EasyEda to Sponsor and generate such a good quality PCB prototypes. ordering process is also quite simple and shown below.

Download my Gerber files, Go to JLCPCB then select the thickness color parameters and order 5pcb's in just $2.
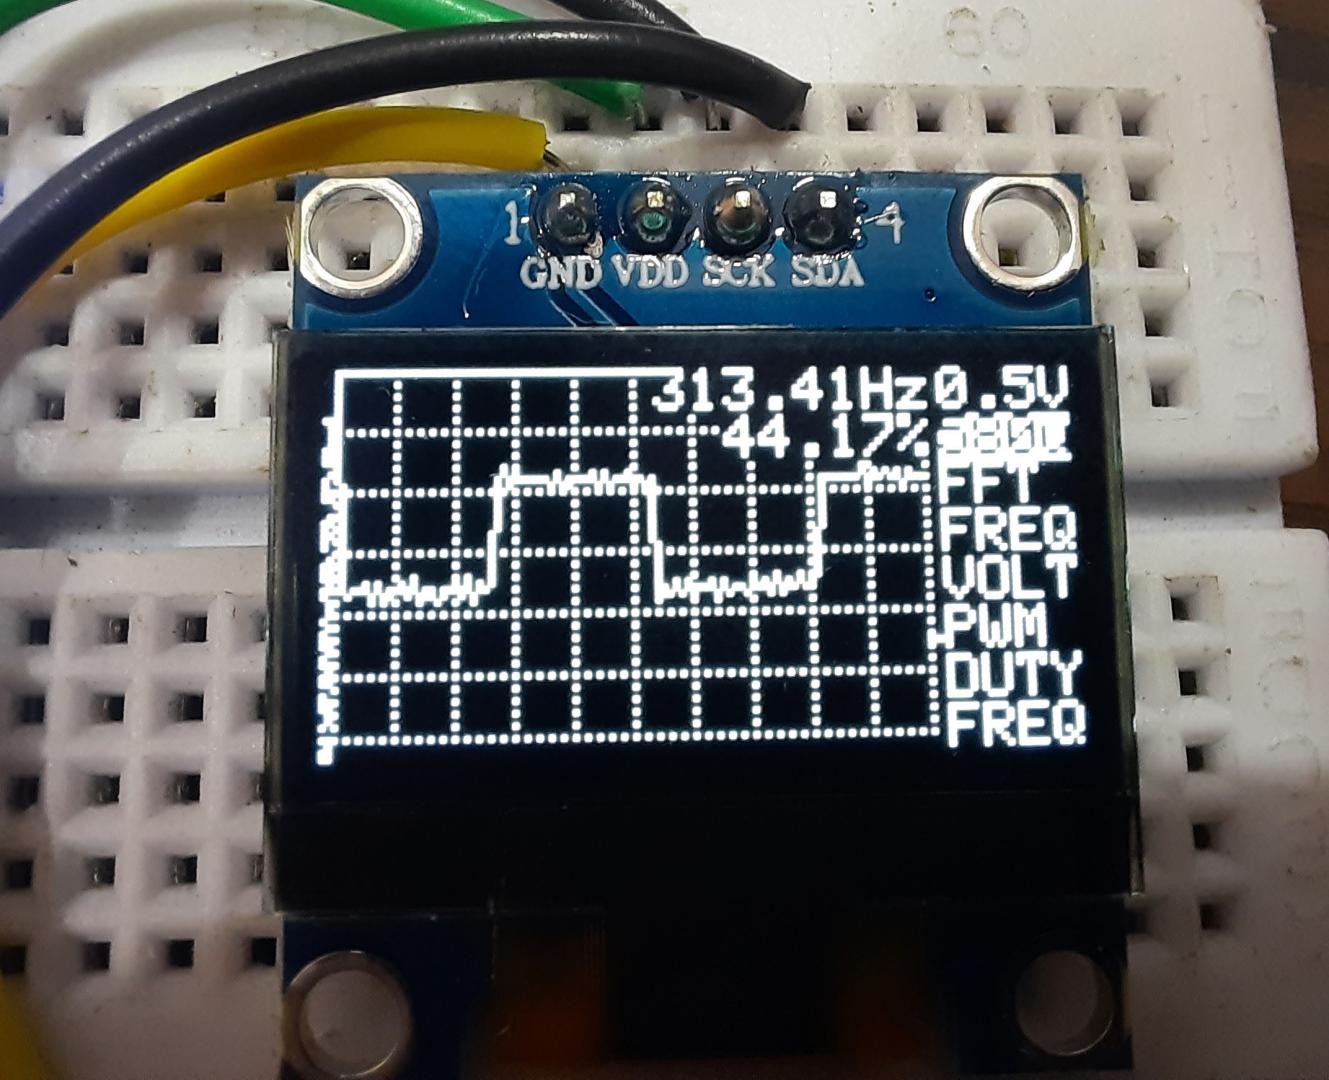
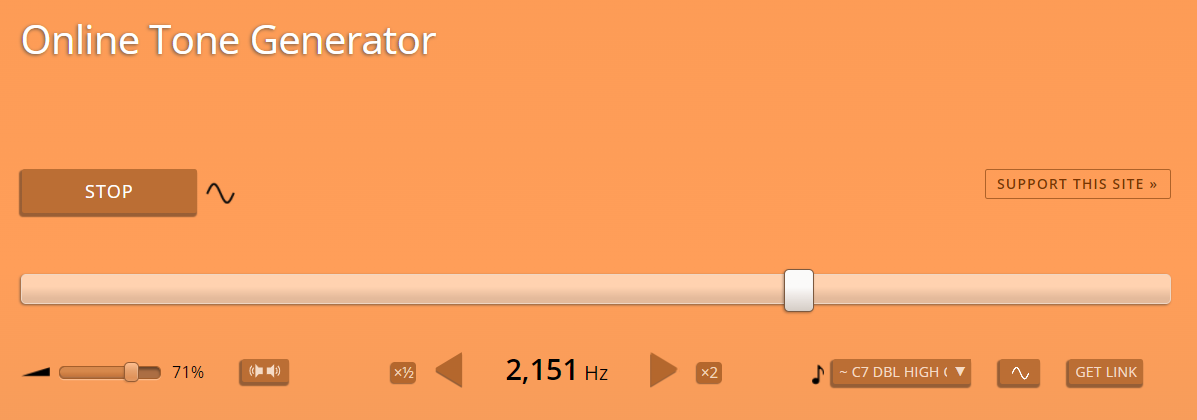
Measurements:
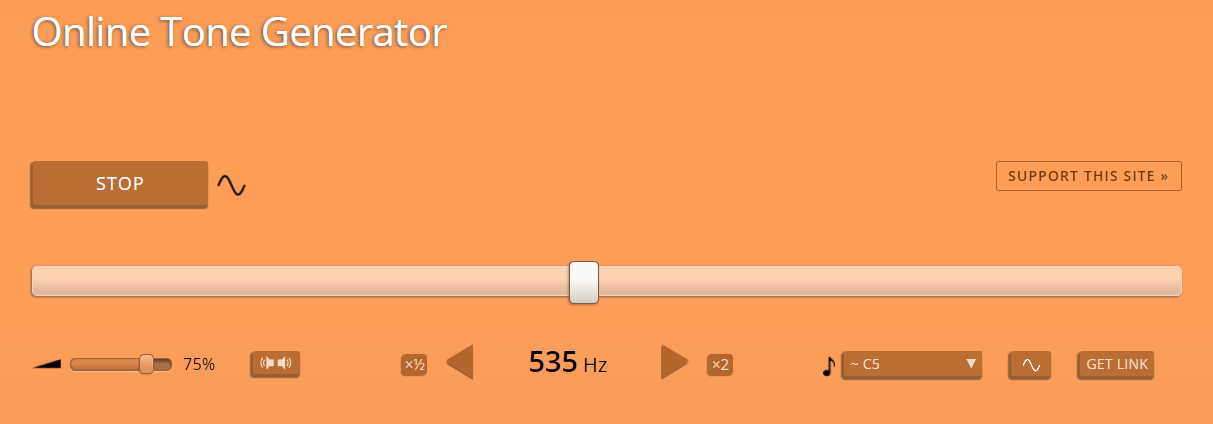
The big issue here is to get the right frequency, as I am saying it is good to go with audio frequencies first. So I paired it with the online tone generator tool. This will allows us to check the accuracy as well as different waveforms.
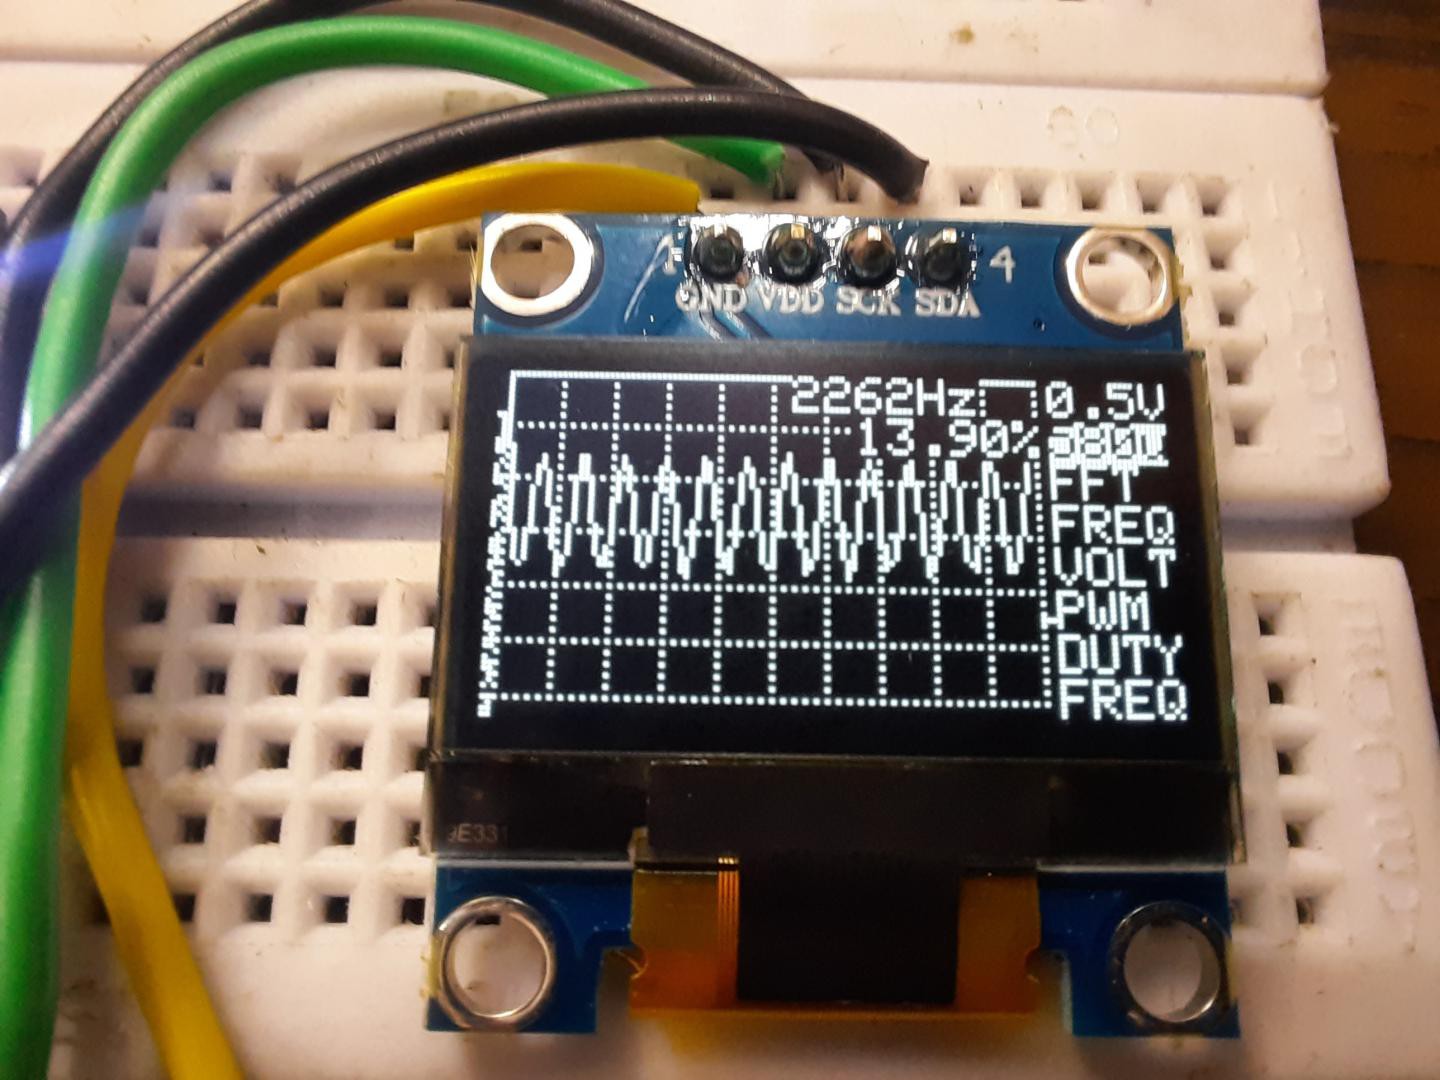
Sine wave measurements at different frequencies are shown here.

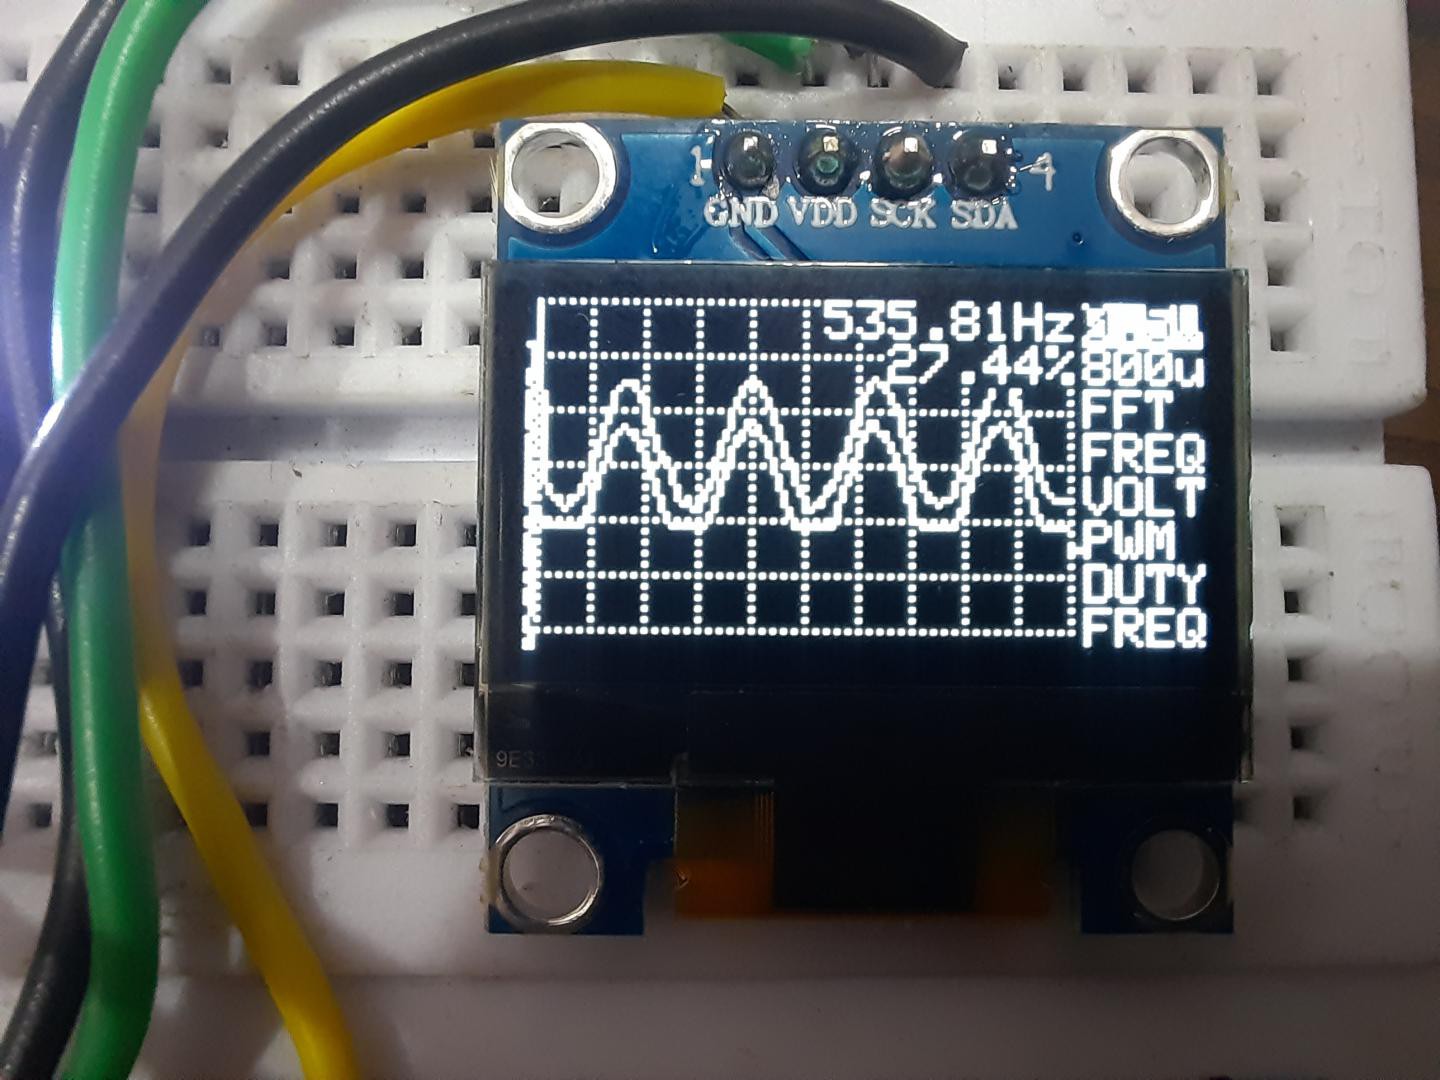
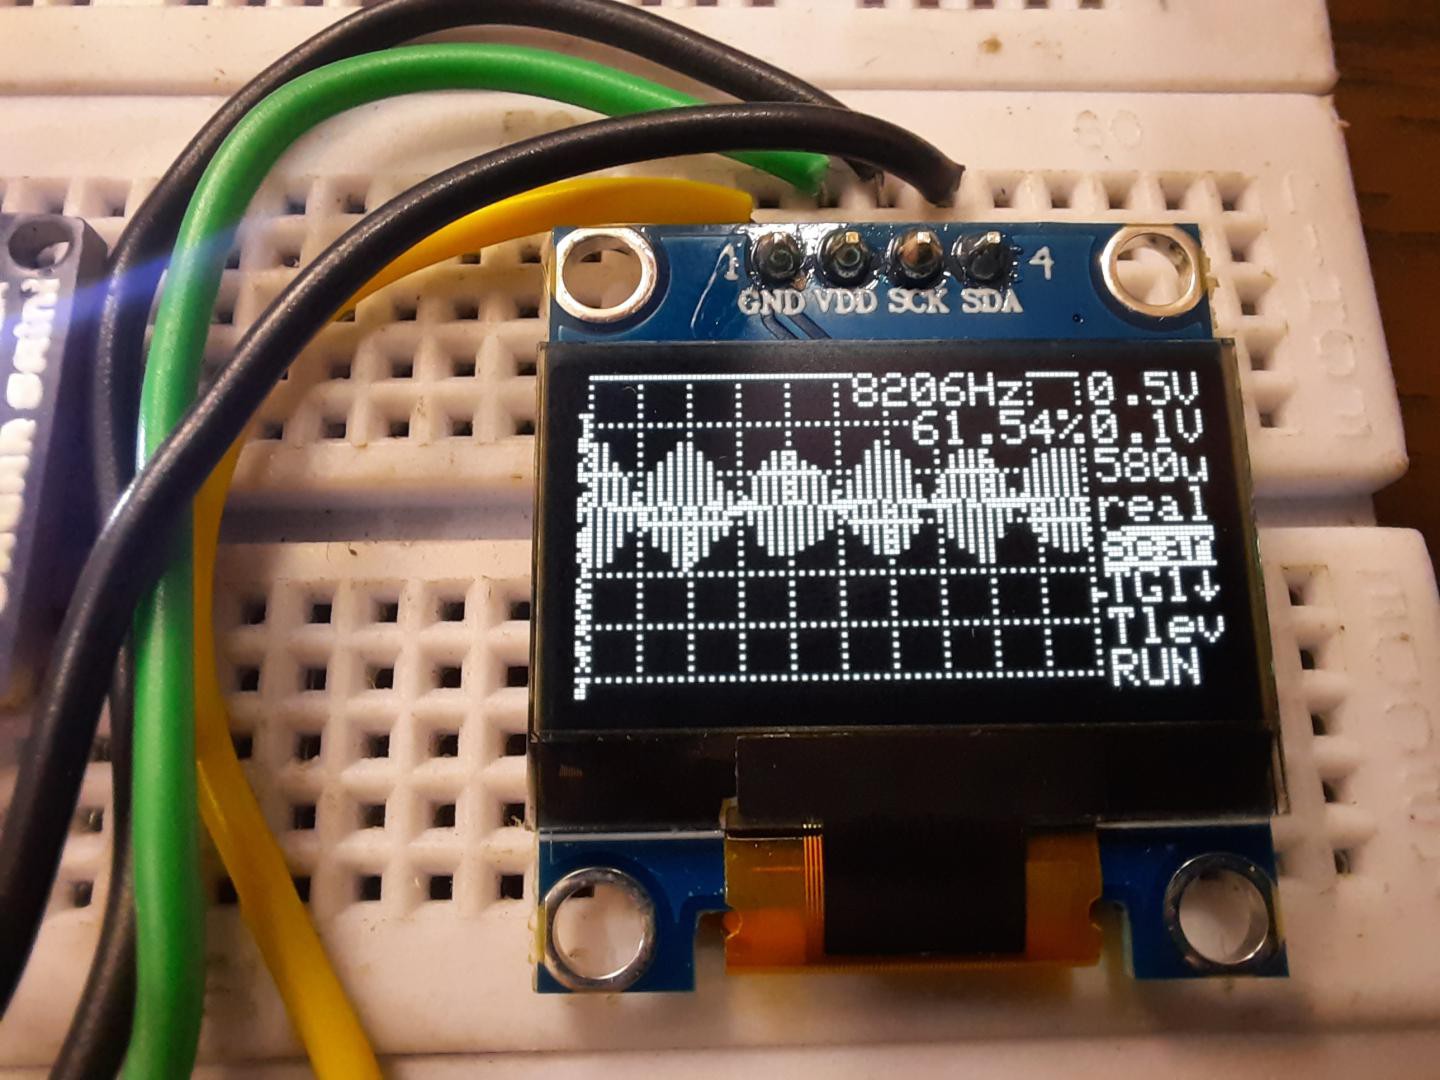
Measurement 2:
Measurement 3:


Observations:
Coming back to the maximum frequency and amplitude, this is able to measure up to 50v with a 5Khz maximum frequency. Yeah, the wave is distorted above this frequency.
Next Updates:
Next time we will back with a bigger microcontroller (2560) and Maybe with a TFT screen. By the way here is the link to my last Arduscope project which support 1 channel up to 10khz frequency and Raspberry pi Pico project with 200Khz bandwidth over analog signals. Once again big thanks to JLCPCB.