Now that it's autumn in my area, and the temperatures are frequently in the 30-40 F range, I can see how things look in my vents when the heat is on. This is analogous to the measurements I made in the summer when my heat pump was in cooling mode.
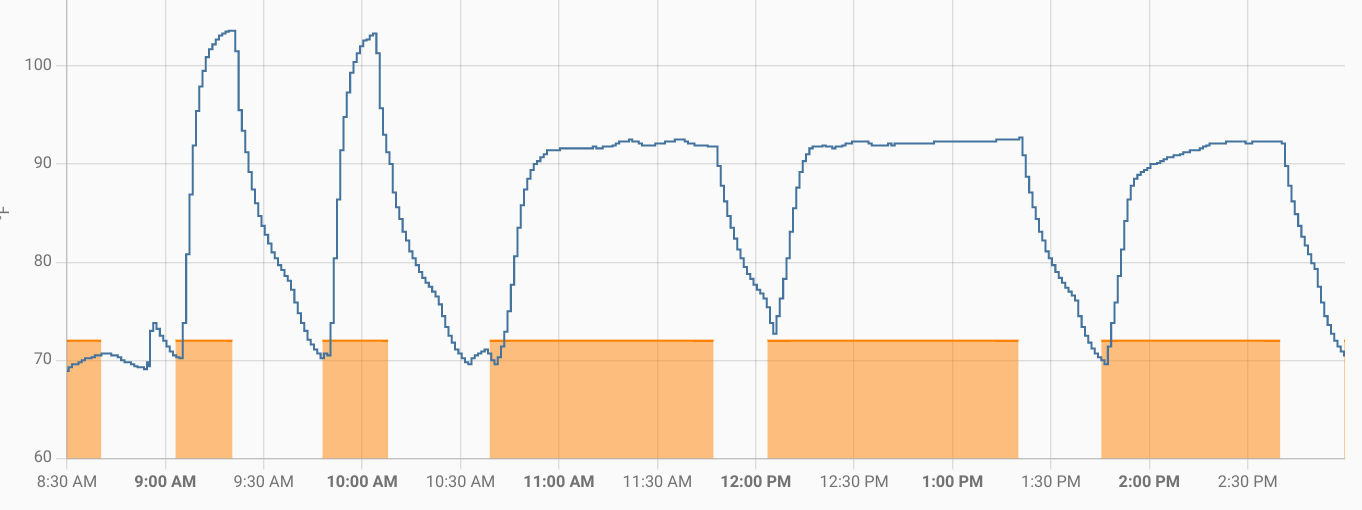
I returned the temperature sensor to the same vent and monitored it for a few hours. Here is that history graphed:

The yellow-ish/orange-ish blocks are when the heat was on. As hoped, it corresponds nicely to the large rise in temperature inside the vent opening. By eyeball, if I use about 85 F as a trigger point, it's a 5-10 minute delay from the heat coming on to reaching that trigger point, and there is something similar when the heat turns off. Based on the summer measurements, I was thinking something like 60 F for the cool trigger. Because of different duct lengths, some of the other rooms might have different high and low temperature triggers. I'll make that configurable.
A couple of the morning heat cycles were short in duration and rose quite a bit higher than the later, longer cycles. During those shorter, hotter cycles, my gas furnace was providing auxiliary heat. The longer, not-as-hot cycles were the heat pump living up to its name and pumping heat from the outside into my house.
 WJCarpenter
Discussions
Become a Hackaday.io Member
Create an account to leave a comment. Already have an account? Log In.