Florian Ellsäßer
The challenge:
Due to climate change, droughts and dry periods have become more frequent with an increasing trend in the future. This lack of water usually has a negative impact on crops and thus our food supply and our food security. In particular, regions that previously had no serious water problems will be affected by droughts in the near future, including the main growing areas of our staple foods. The consequences of a drought are often a reduction or failure of the harvest and a general decrease of the harvest quality. However, apart from a few side notes in the news, the drought induced problems of crop cultivation and the threat to our food supply are not a major concern for most people and communities.
With this project, I wanted to make the water stress of crops visible to a wider range of people and raise awareness of how directly weather extremes such as droughts are related to our food and how big the problems for agriculture can become due to prolonged dry periods.
It is therefore high time to make people aware of the problem, collect data and develop better more climate change resilient agricultural systems.
The Crop Water Stress Sensor:
The Crop Water Stress Sensor is designed to intuitively show the often non-obvious water stress of our crops while collecting valuable time series data on an SD card. Using a low-cost thermal imaging camera (MLX90640), plant surface temperatures are recorded and the Crop Water Stress Index (CWSI) is applied using these data. The CWSI is the standard remote sensing method to calculate crop water stress e.g. from thermal satellite imagery and this index is ideal to apply with the data from the small thermal camera. The results of the CWSI are shown on the display (ILI9341 3.2") as current measurement, daily average, 14-day retrospective and 5-day trend (see below).
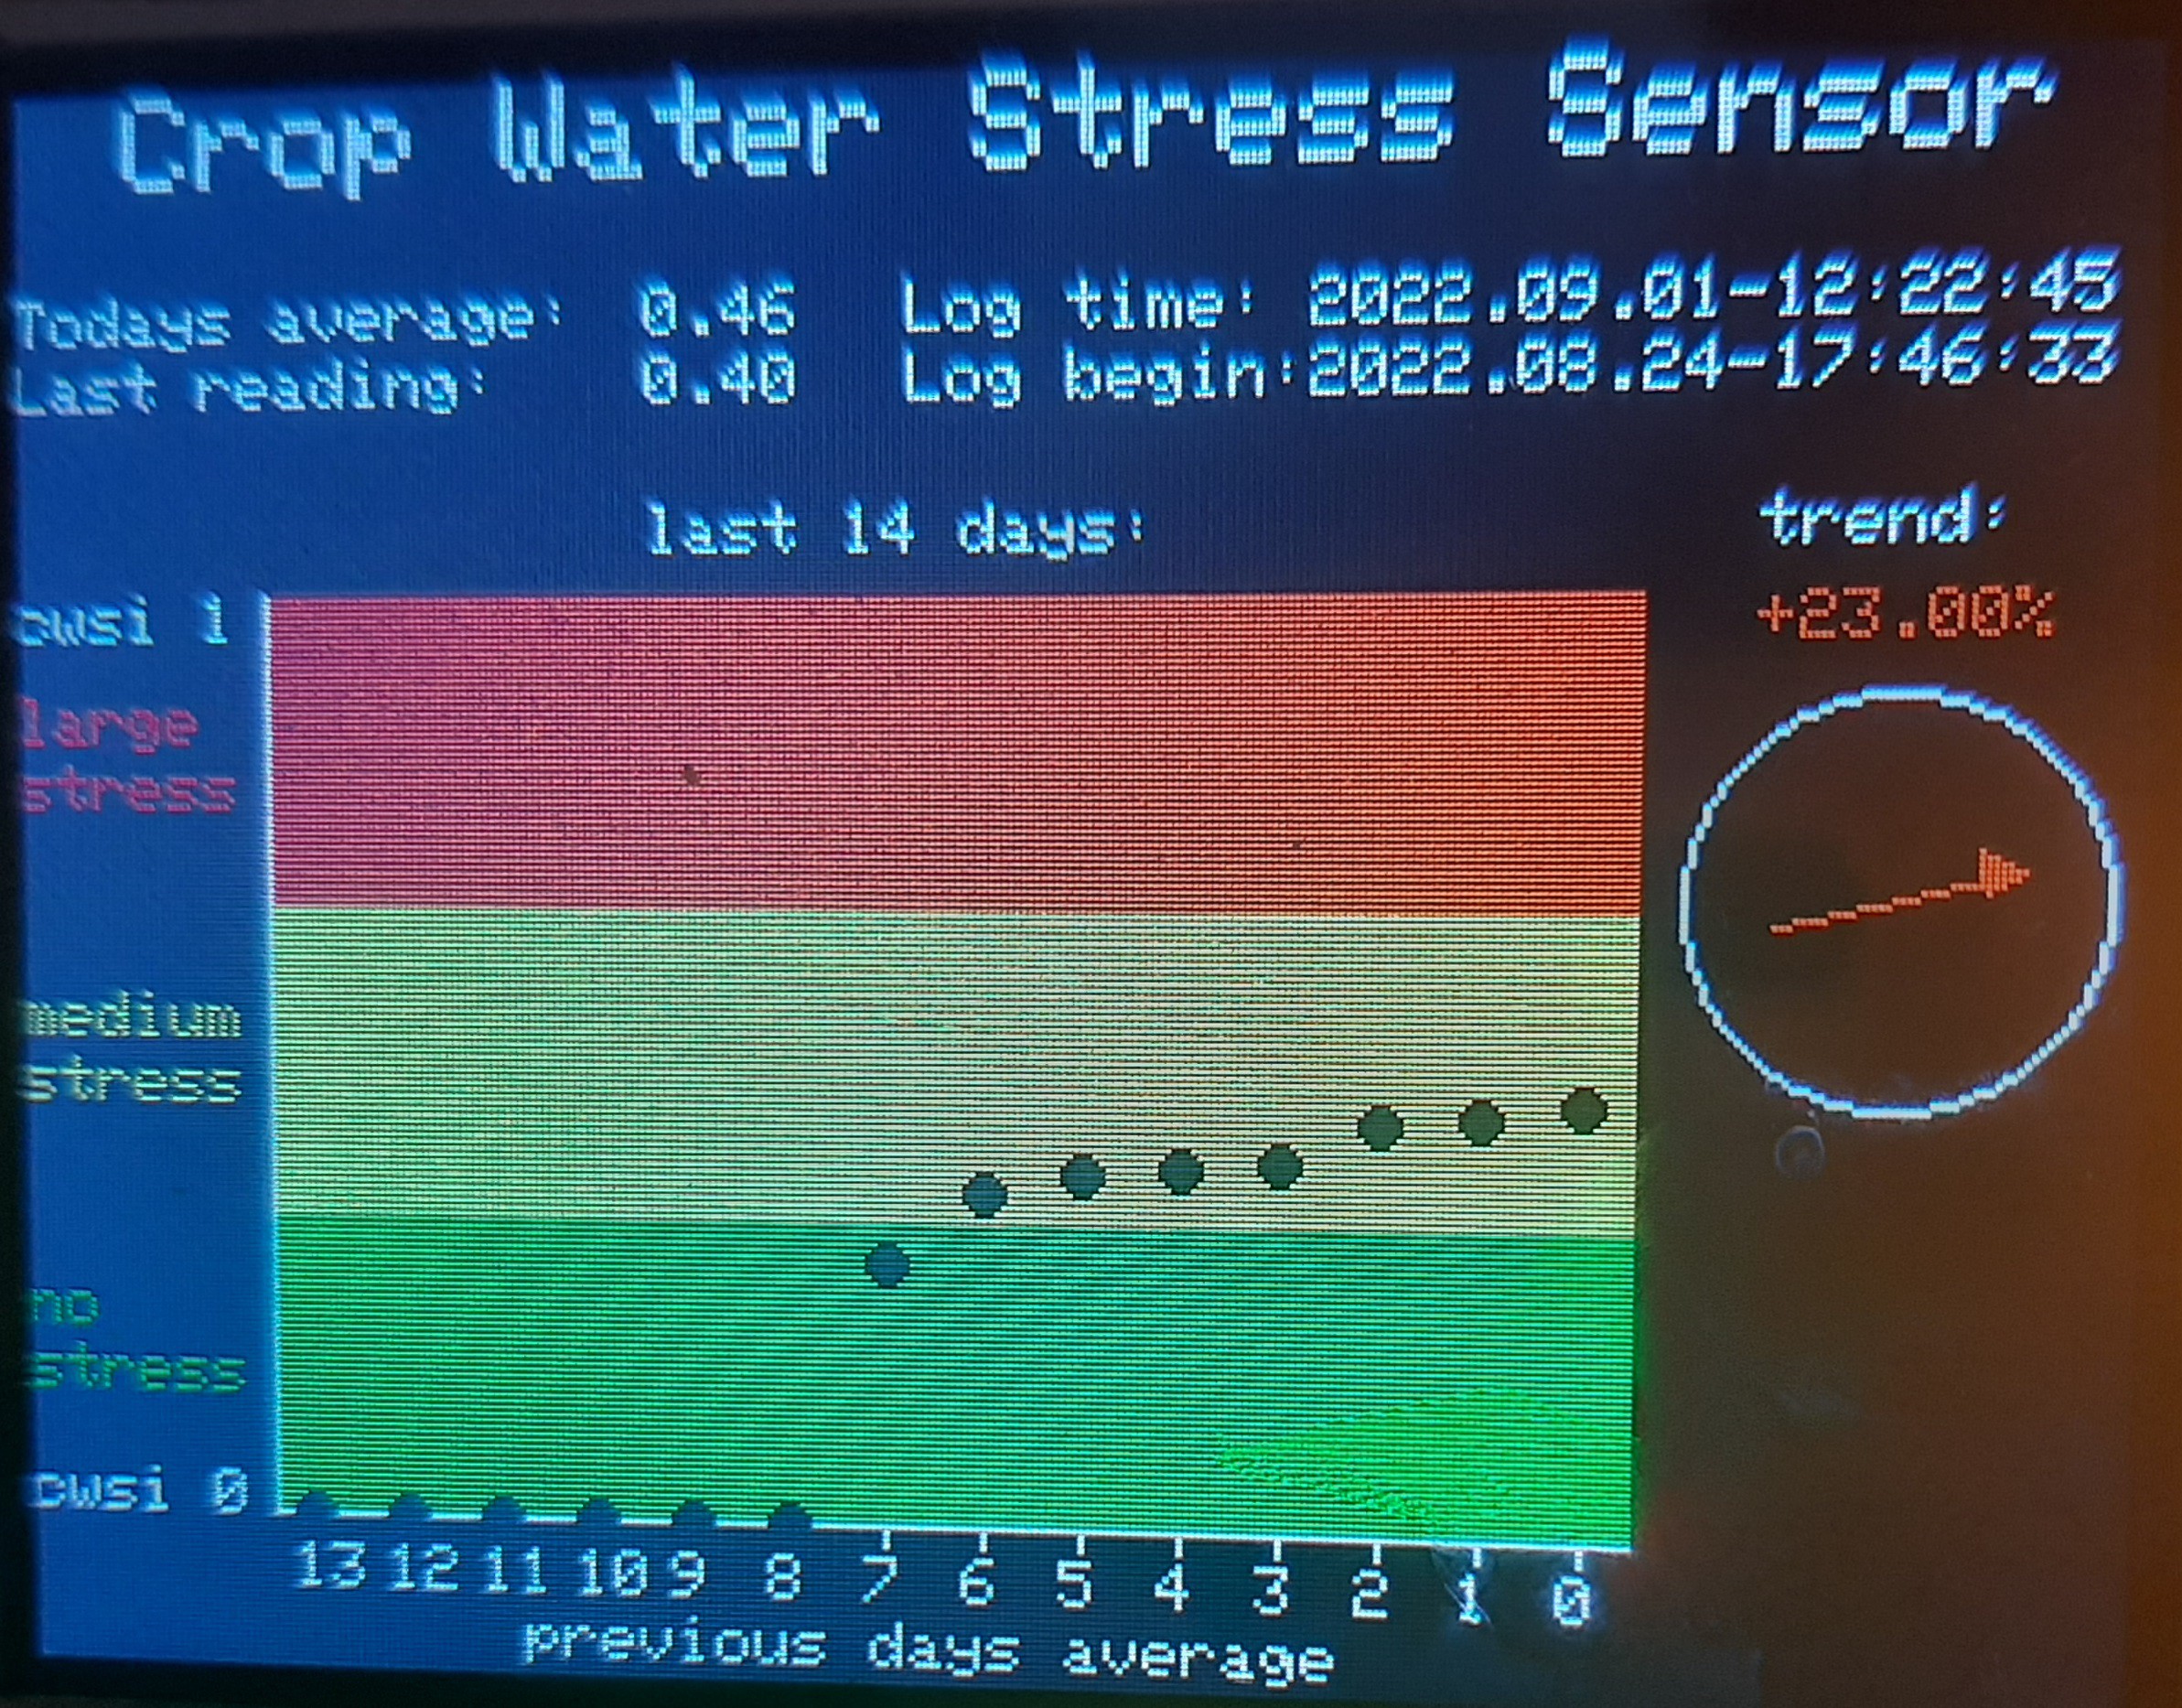
In the picture above you can see what the dashboard on the display looks like. The top section displays the current daily average of the crop water stress index and the last reading with the latest time stamp. I also thought it would be nice to display the timestamp of the first row of data that was logged on the SD card. The main figure of the dashboard shows the daily mean crop water stress values of the past 14 days. The background colors also indicate the severeness of the crop stress and are intended to be a visual aid. Since I didn't have the time to run the sensor for two weeks in the field yet, only the last 7 days and the current average are displayed on the screen so far.
Working in crop and climate science, people often tend to see me as a weatherman for crop performance predictions and one of their first questions is usually if I can predict how the crop is going to perform in the future. Since I also don't have crystal ball, I usually refer to a trend estimate based on a regression. To keep things simple here, I implemented a linear regression for the last five days of measurement and the resulting slope is then interpreted as the trend. There is a plethora of statistical procedures that I could use as alternatives here and maybe I'll change the procedure in the coming versions.
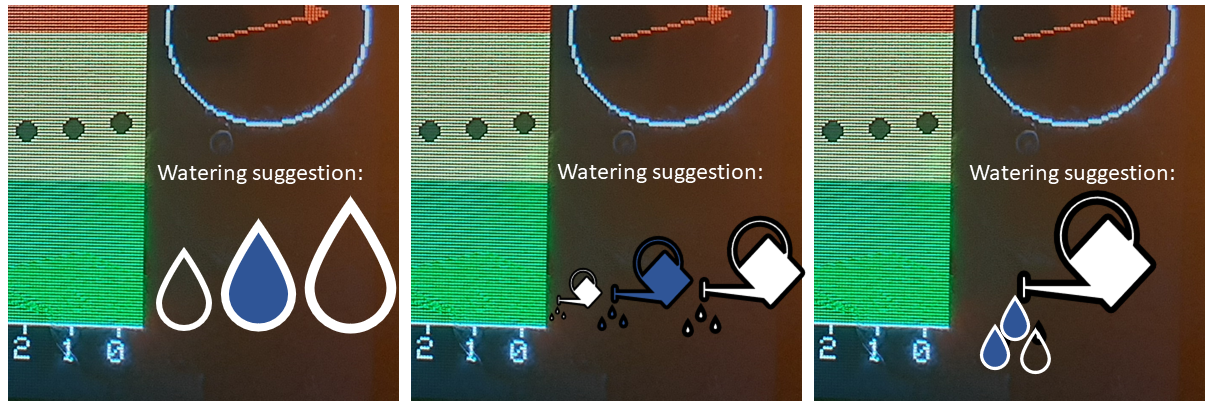
Finally there is still a big black spot that is not used on the display on the right bottom corner. I plan to integrate a watering suggestion here to give more practically usable advice to the people who look at this dashboard. I didn't have the time to implement any of this yet, but it could look like one of these suggestions:
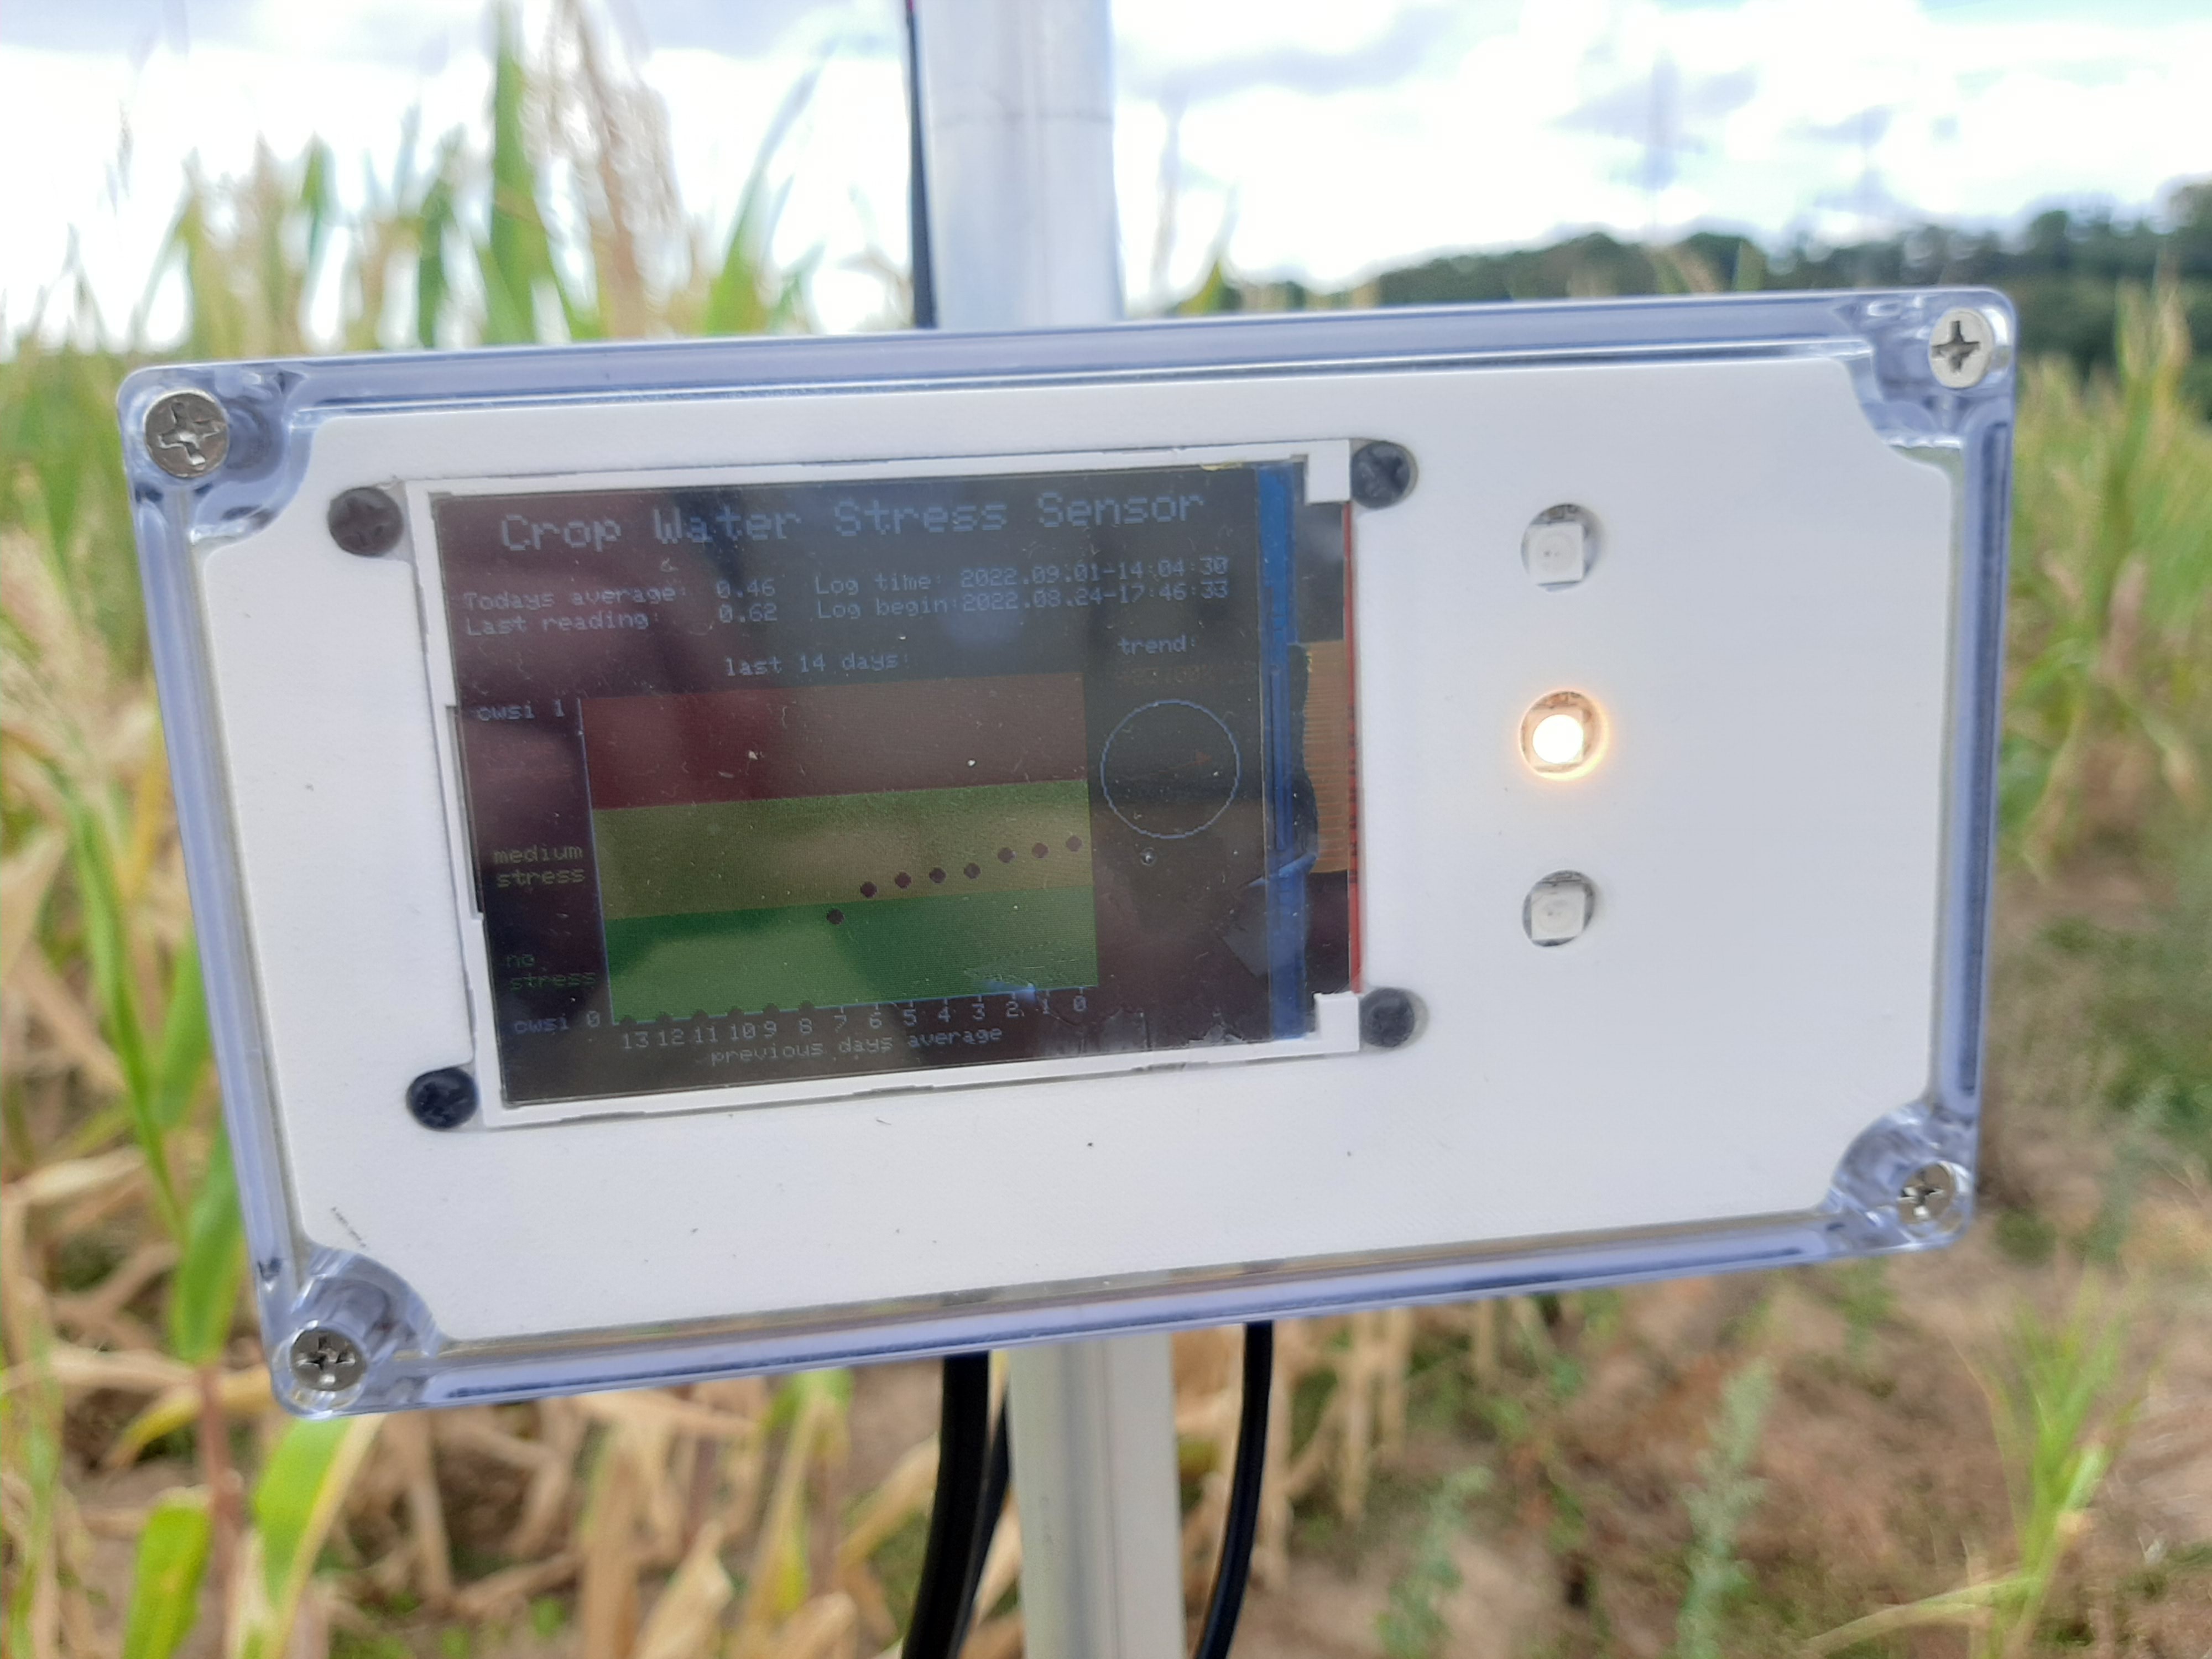
During midday hours, the display is a little hard to read, since the sun light is usually very strong. I'm currently experimenting with other display types (such as E-ink) and anti-reflection films to see if I can improve the visibility of the prototype. However, the simplest solution to display the CWSI results during the sunniest hours of the day would be a simple "traffic light" style based on cheap Neo-pixels. Here, green light indicates no or low drought stress, orange light indicates drought stress and red light represents extreme drought stress of the plants. Currently the traffic light shows orange, that means the crops in the background are moderately stressed:
As a scientist, I would naturally like to see as many of these Crop Water Stress Sensors as possible in fields and pastures. The time series data is of utmost importance for us to develop the climate resilient agriculture of tomorrow and thus to be able to ensure regional and global food security. However, I know from experience that farmers and communities can be sensitive when scientists propose to put several dozen cameras on their land.
That's why I developed the concept of communicating sensors.
Each measuring station, each sensor and also the Crop Water Stress Sensor should transparently communicate what is measured in that location and why. This way, the measured data are intuitively accessible and organized in the right context for all people who might be interested in the measurements in order to increase the acceptance of scientific measurement gear in the population and among the stakeholders. Like this, the data can be collected in an extremely transparent manner and at the same time, information about the current situation of the crops can be provided to the public. Not only farmers and scientists benefit, but also society and especially rural communities, as the relationship between drought and crop water stress can now be presented and communicated in a very tangible way. To support the concept of communicating sensors, I plan to add a SX1276 chip to the sensor to be able to send measurements via LoRaWAN to a gateway (see below).
The QR-code attached to the sensor contains a link to further information or may in the future also lead to an explanatory video or to an online dashboard that graphically displays the results of several sensors from a sensor network. This can provide more results and insights into the stress status of the plants to make the community even more climate resilient to drought events. Another option is to use the QR code to connect to the WiFi created by the ESP32 in the sensor. On the ESP32 WiFi we could recreate the same dashboard as on the screen and people could take a look at the data on their smartphone. This might also be a very elegant way to remove the screen from the sensors in the future and save money and energy.
Integrating the sensor into a sensor network and showing the measurements on a web dashboard:
In a next step, I'll add a LoRaWAN SX1276 chip to be able to send the crop water stress measurements to a LoRaWAN gateway and to collect the data from several sensors. The data could then be integrated in a dashboard on a simple website that could show aggregated data products from the measurements and create more room to explain the processes behind the crop water stress. The QR-code on the crop water stress sensor could direct people to that web-dashboard to support the understanding for the impact of drought in the region and globally.
How is the Crop Water Stress calculated:
Maybe it is also interesting to quickly explain how the crop water stress is actually calculated here. I have a strong background in developing simple educational software solutions and last year I developed a QGIS3 plugin that simplifies the calculation of the Crop Water Stress Index. This sensor is based on the insights I could get developing the software. This is how the water stress estimation works:
Plants transpire to transport water and nutrients to the leaves to support the photosynthesis process. This process of transpiration cools the plant surface in a process called evaporative cooling. If a plant is under water stress, because there is not enough water available to transpire, the transpiration remains below the potential maximum and the surface temperature of these plants is warmer than it could be under ideal conditions. The crop water stress index (CWSI) uses the possible minimum temperature of a wet surface (Twet) and the possible maximum temperature of a dry surface (Tdry) to relate the actual plant temperatures in the area. If the plant surface temperatures are very close to the wettest surface, it is assumed that they have enough water available for transpiration and that they are not stressed. If the plant surface temperatures are closer to the reference dry surface, it is assumed that the plants are water stressed.
Since we are using a thermal camera in this project, Tdry is the set of hottest and Twet the set of coldest pixels in the image. The individual pixels are then related to the wet and dry extremes and an average for the entire scene is calculated. The CWSI is therefore a very simple but very useful index for plant water stress derivation from thermal images of land surface temperatures.
An extreme CWSI of 1 (one) indicates that the plants are very water stressed, while an extremely low CWSI of 0 (zero) indicates no water stress at all. Usually most of your results will be somewhere in between. If you want to know more about the calculation of crop water stress, you can also visit my other crop water stress project.
The main design choices:
The sensor has been developed with the cheapest and readily available components with a strict focus on minimalism in order to be replicated as cheaply as possible and in large numbers. This aspect is taken into account by a very clear structure with few components, supported by 3D printed component carriers. At the same time, the sensor should be able to be used outdoors as flexibly as possible and function autonomously for as long as possible, even in bad weather. For this purpose, either waterproof components (solar panel) were installed or all heat, dust and moisture-sensitive components were housed in a stable, semi-transparent standard housing. The thermal imaging camera is protected against heat from solar radiation and precipitation by a specially designed semi-open housing and shield. The simplicity of the previous concept is, of course, partly countered by the concept of communicating sensors, in which as much attention as possible is now to be attracted to the collected data and evaluations by interested persons. Very bright Neo-pixels (WS2812B) and a relatively large display were installed for this purpose.
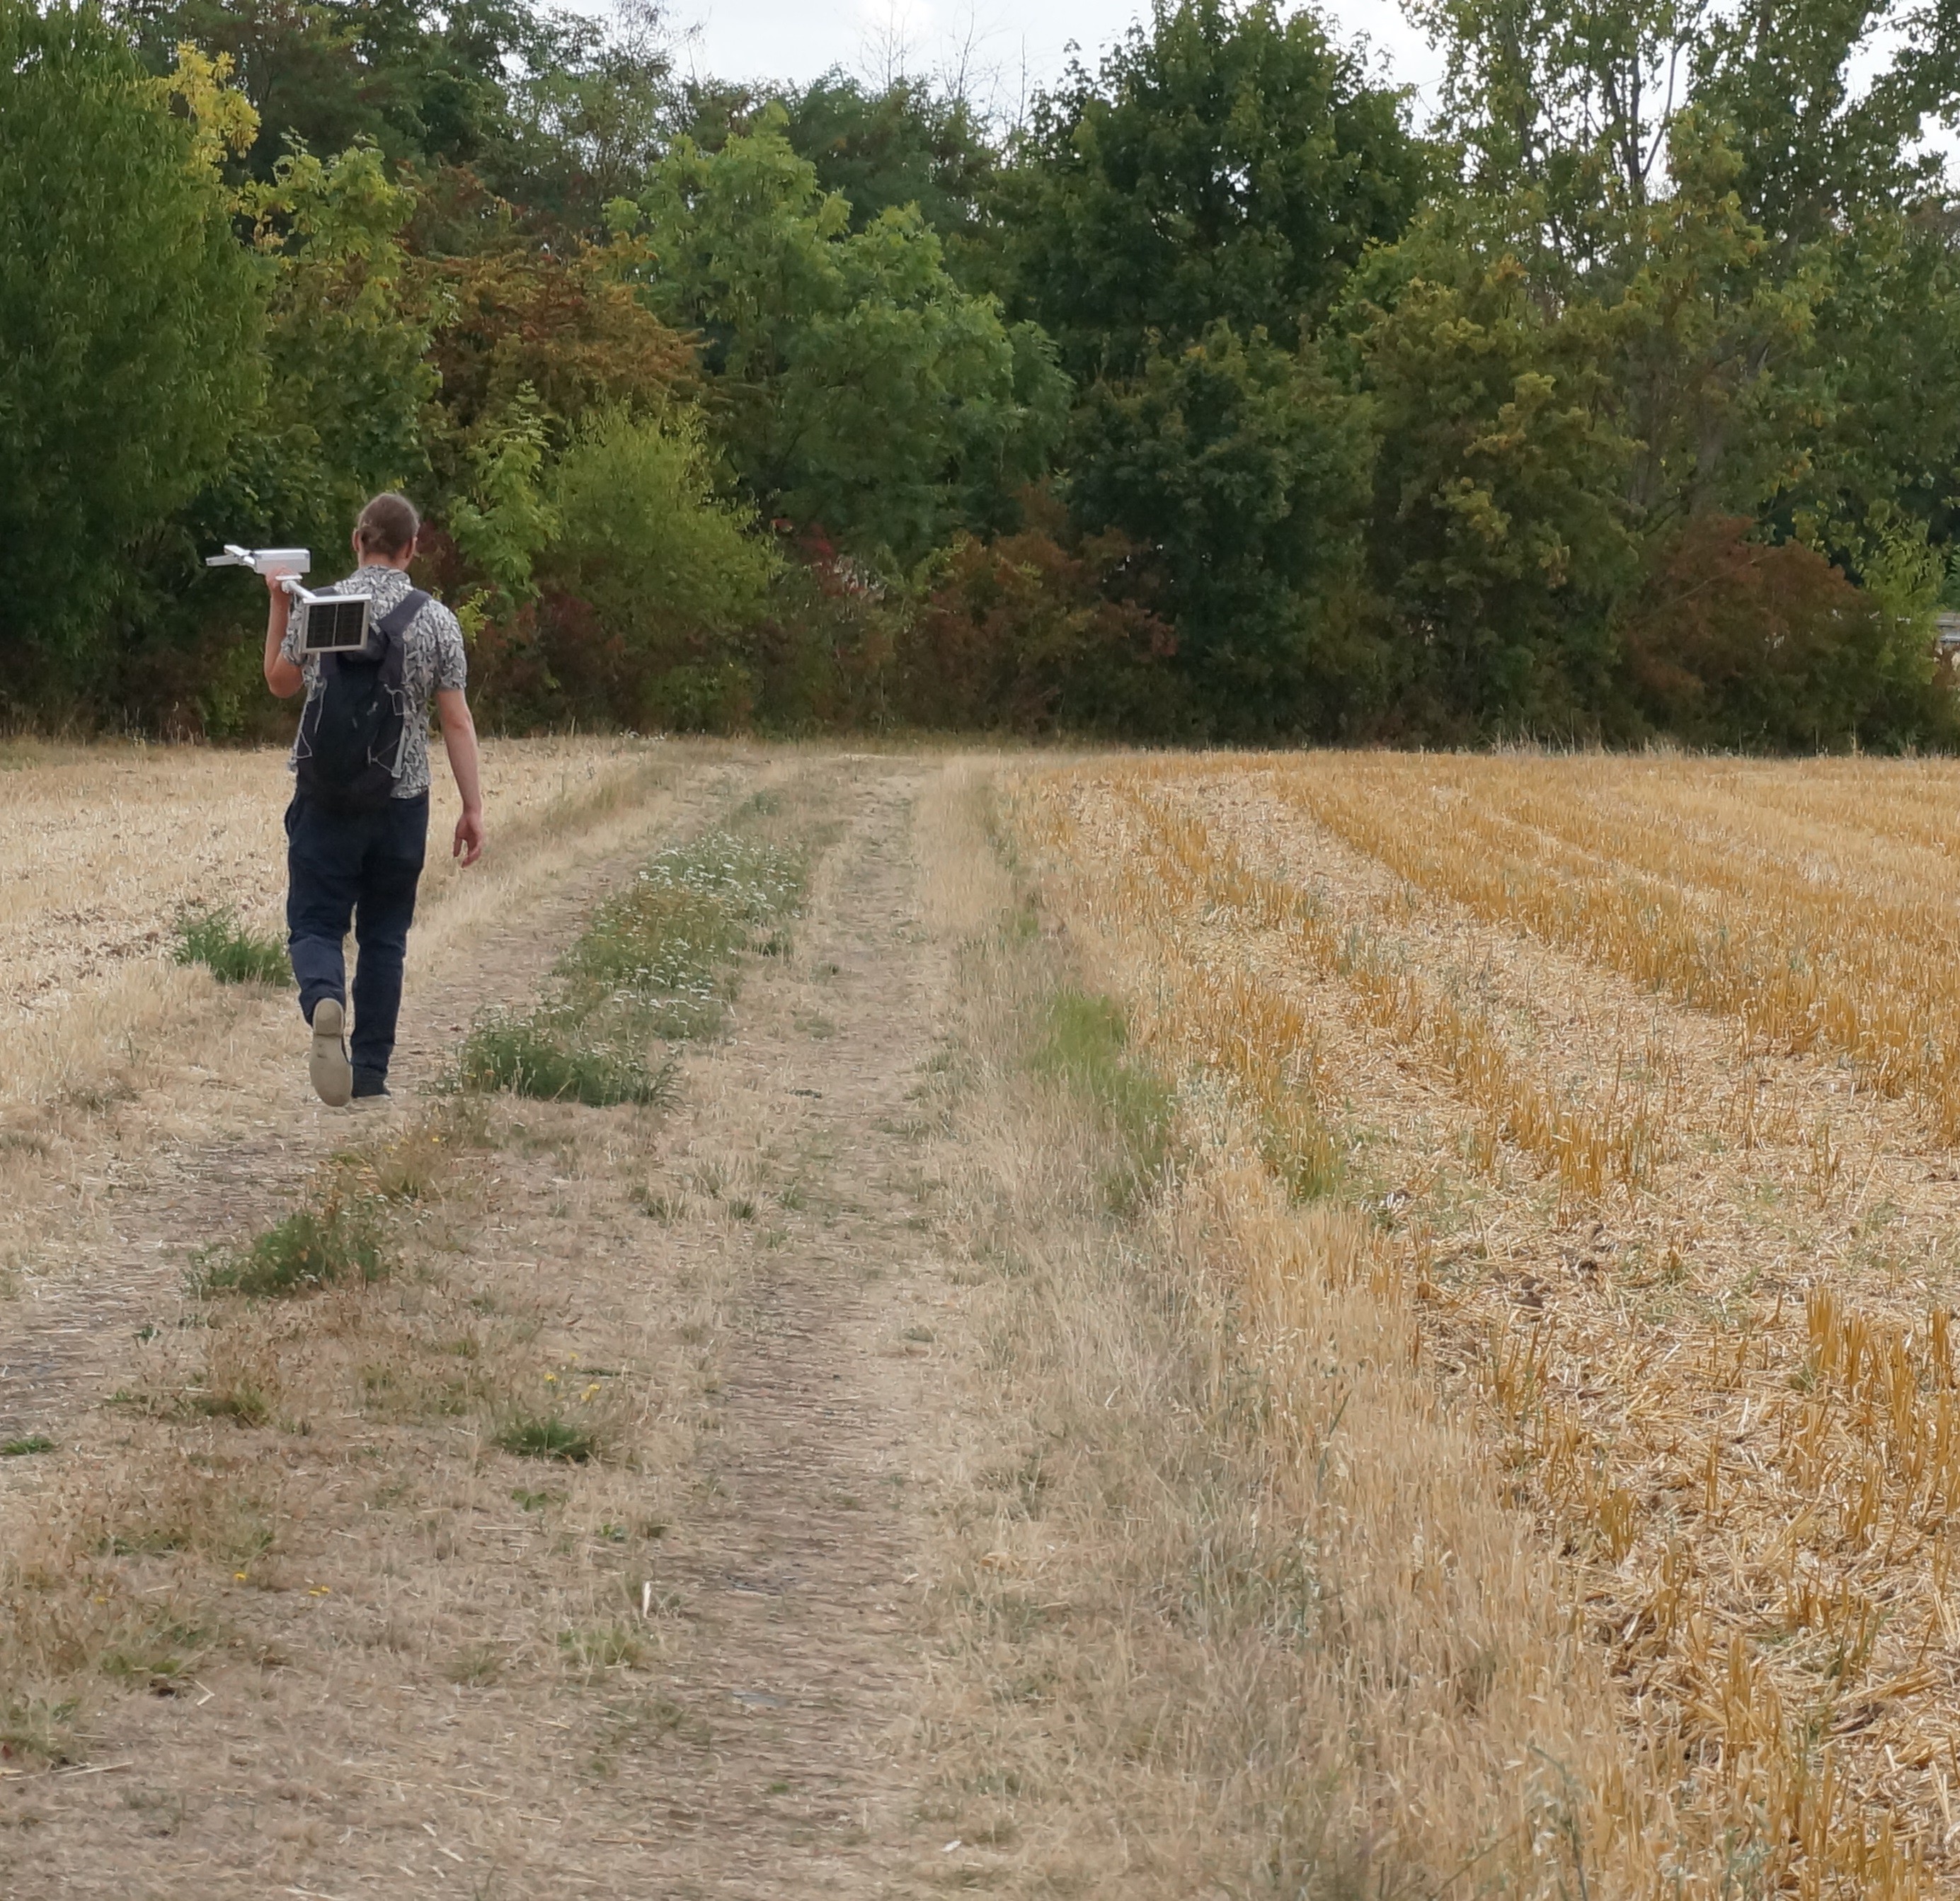
The sensor is now even light enough to carry it comfortably to the test sites: