 Angel Cabello
To complete the calculator software that this handheld has we need a function graphics program.
If we push the menu button, we get a window with all the programs defined there, the second raw shows our next objective. At the right it is the configuration screen.
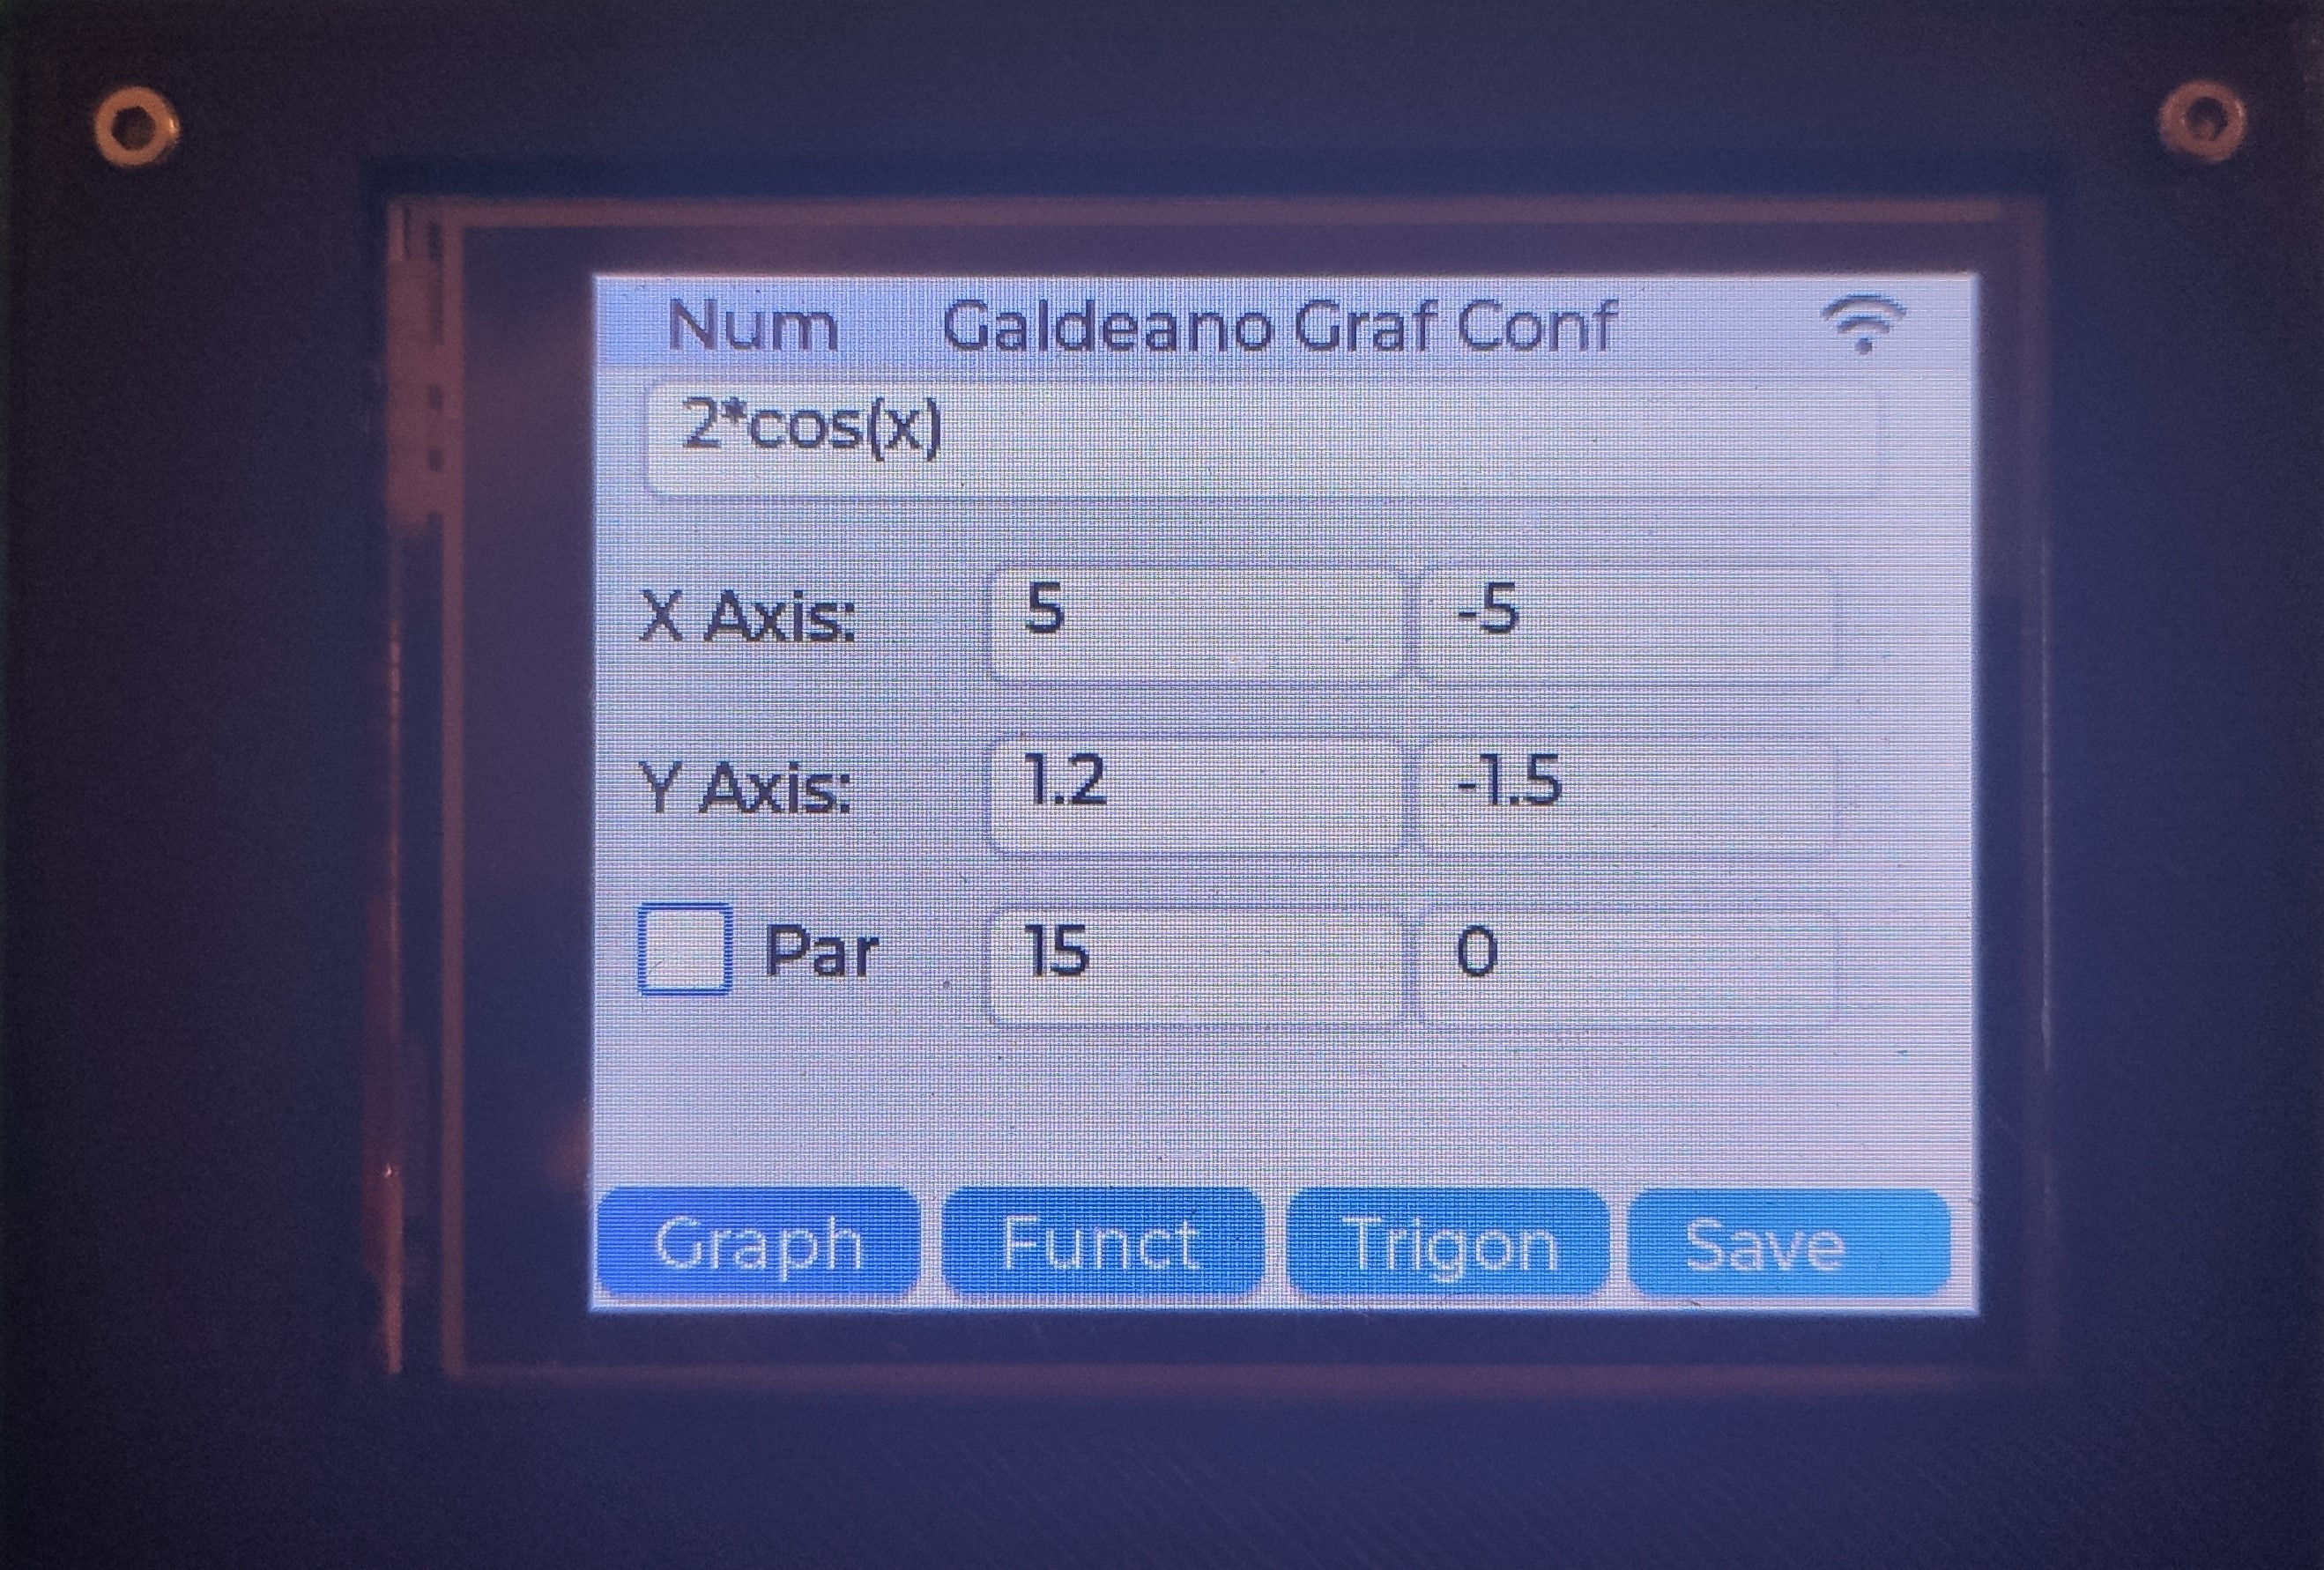
At the top, we can write the formula we want to see as x function. We can uses any function we have defined in the math engine, so if we have defined f(x) in the calculator app, we can write only f(x) an it will show.
Next is the X - Y range.
If we press the save button, it will store the data to a file.
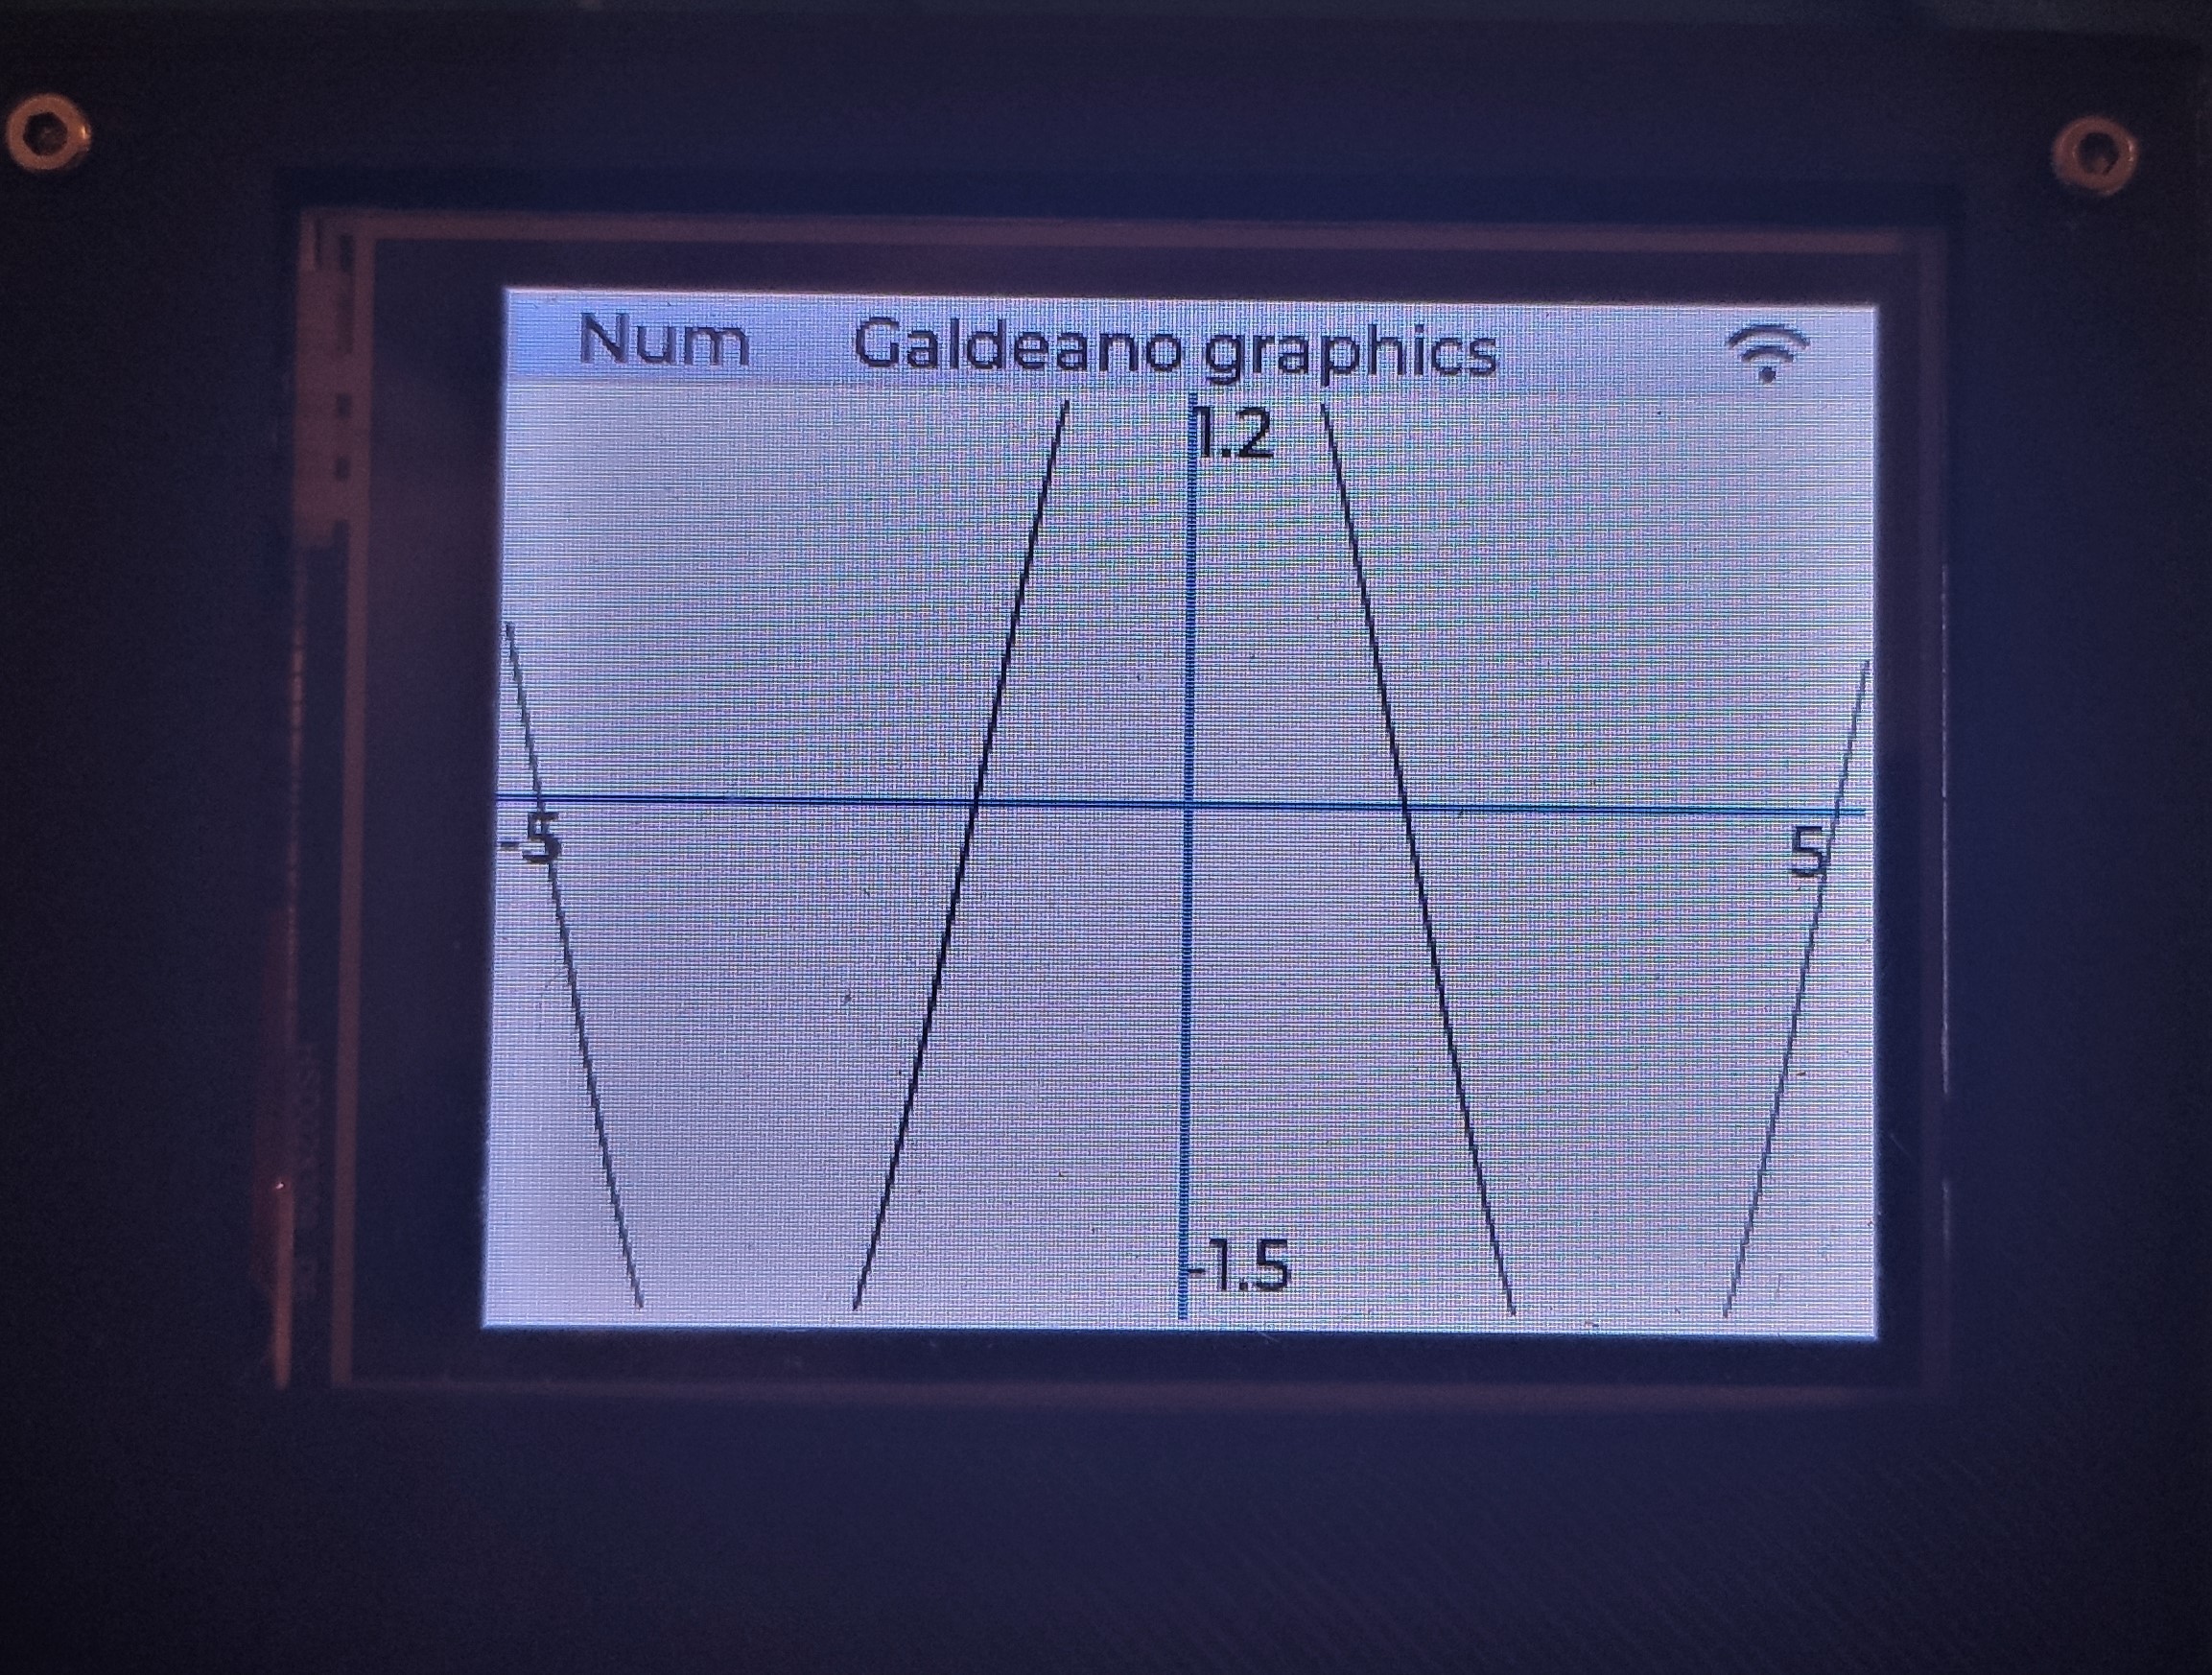
And if we press the Grap button, we go to the plot screen.
If we choose the Par checkbox in the config screen, the screen changes and shows that
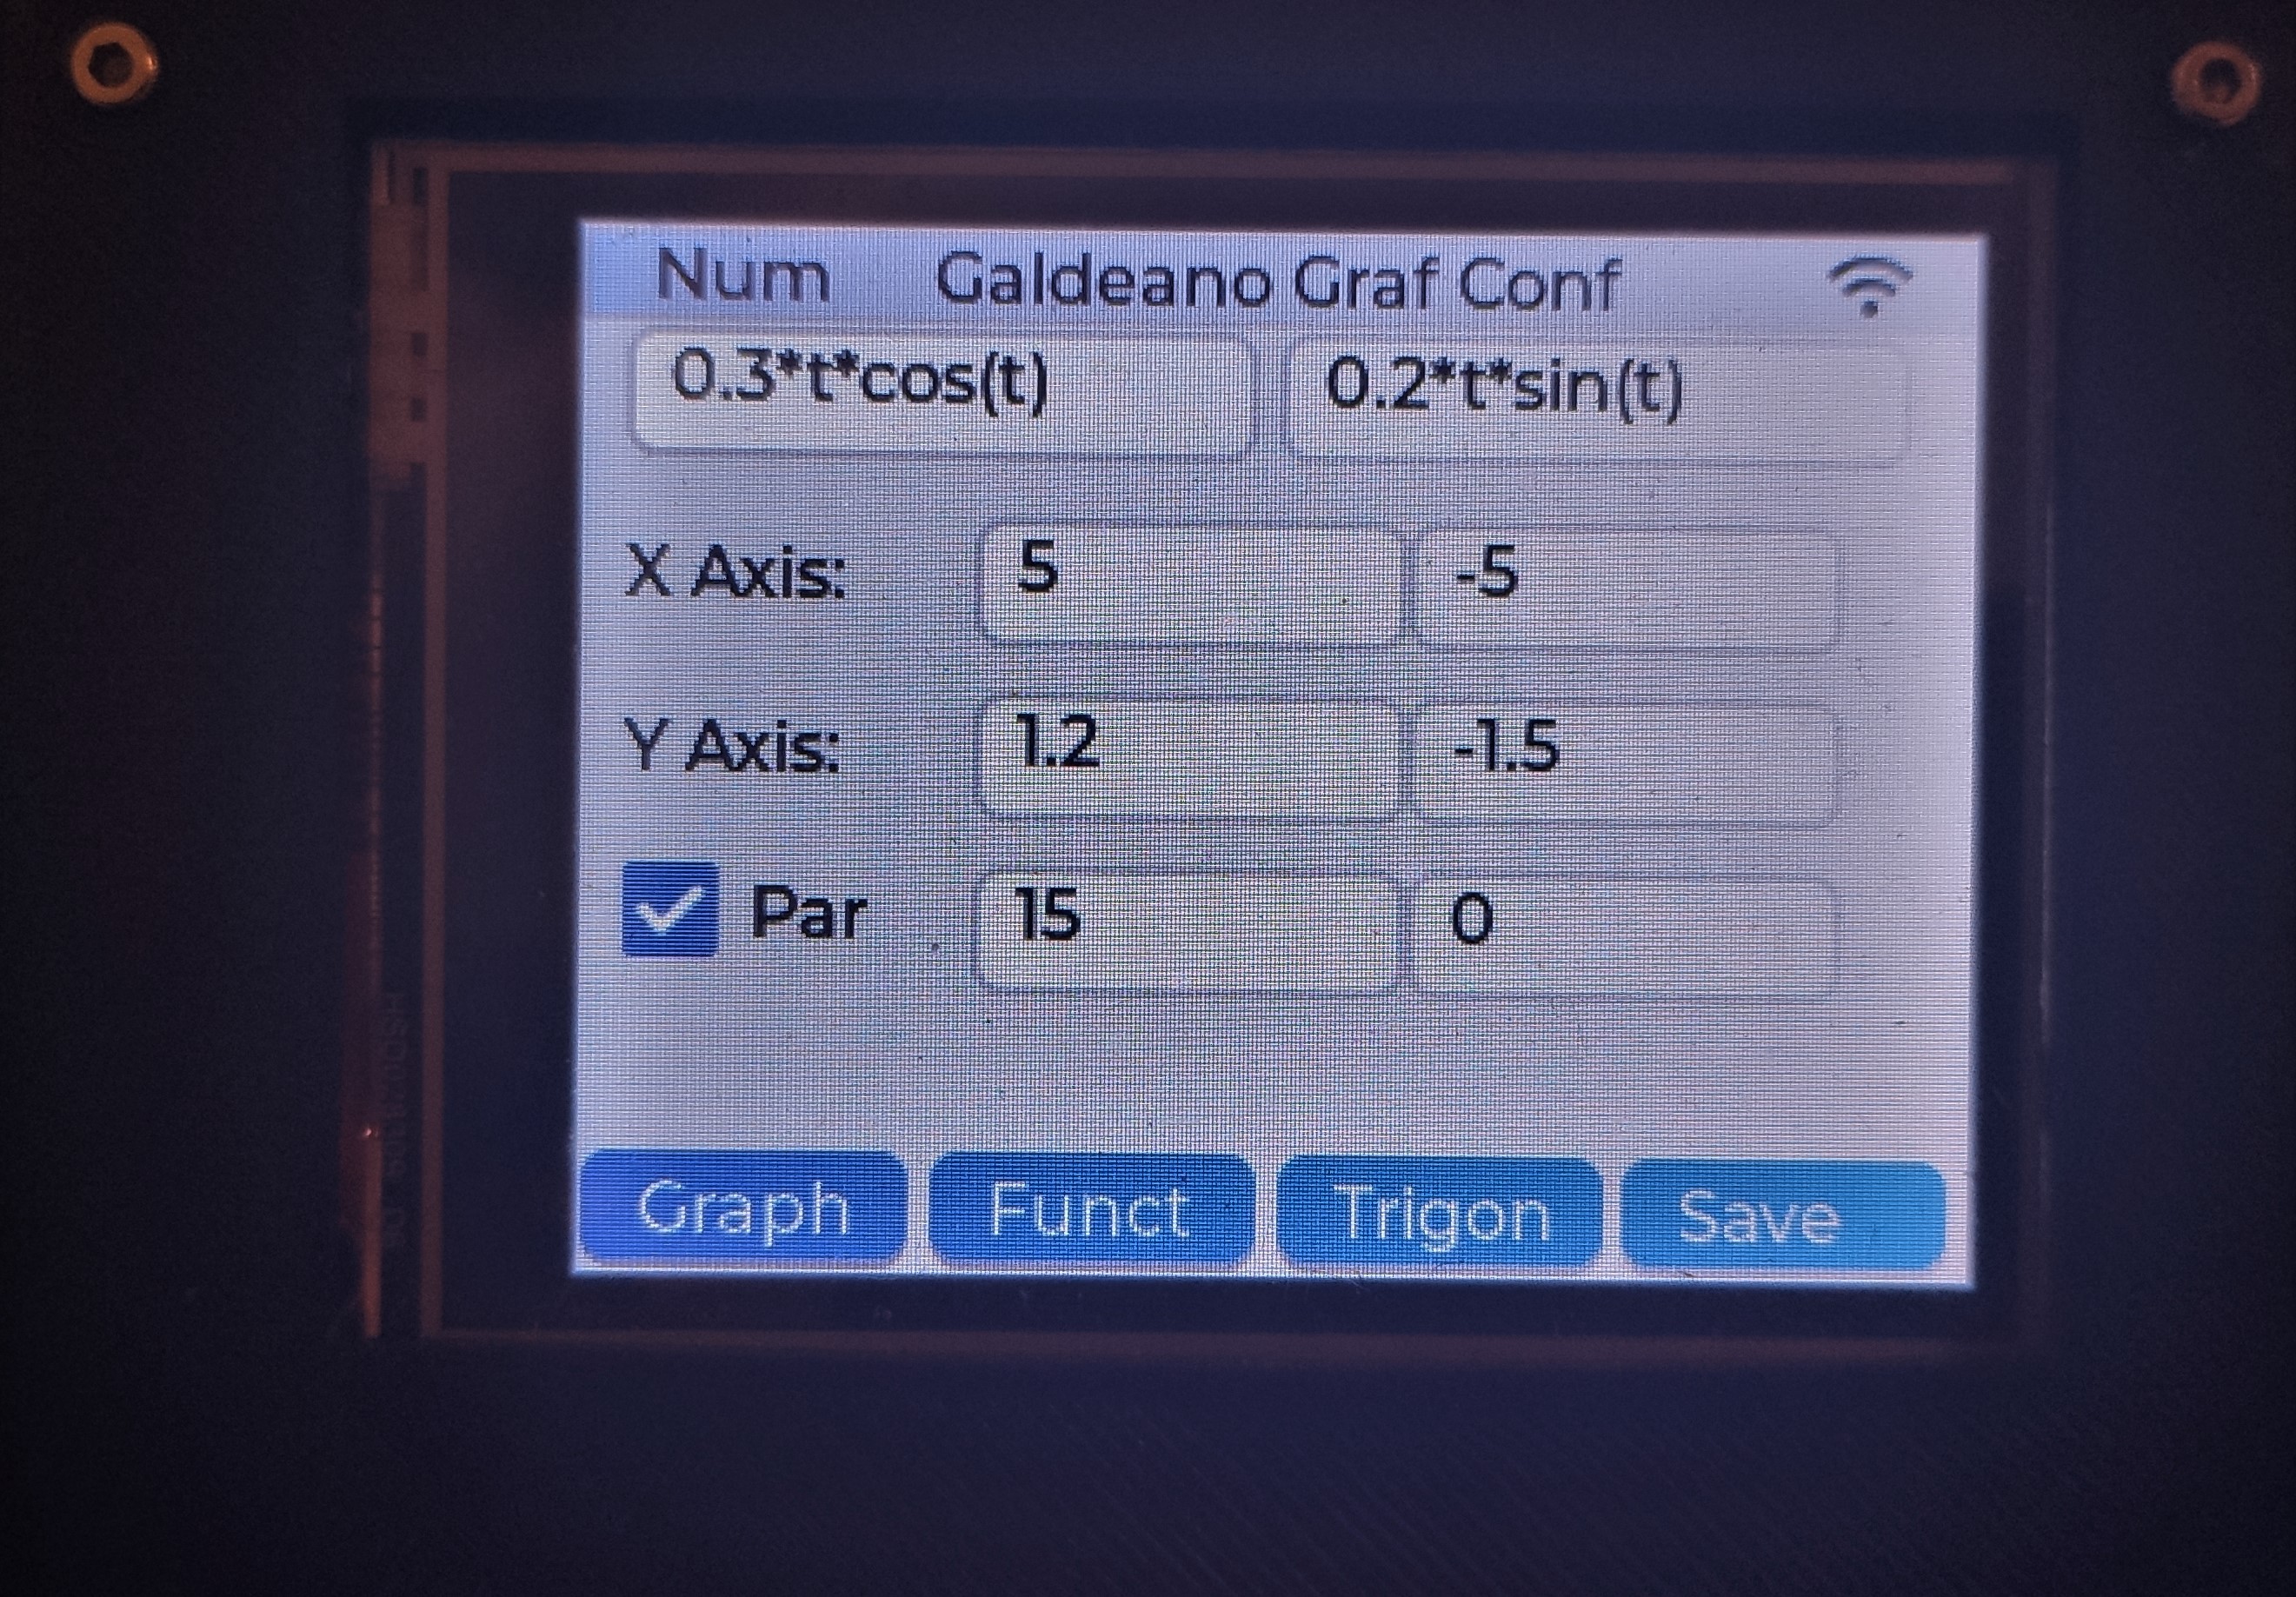
We are in the parametric equations. We can write x(t) and y(t) at the top, and the t - range at the bottom, we can store a f(x) and a x(t)-y(t) at the same time in the file. Pressing the graf button takes us to this screen
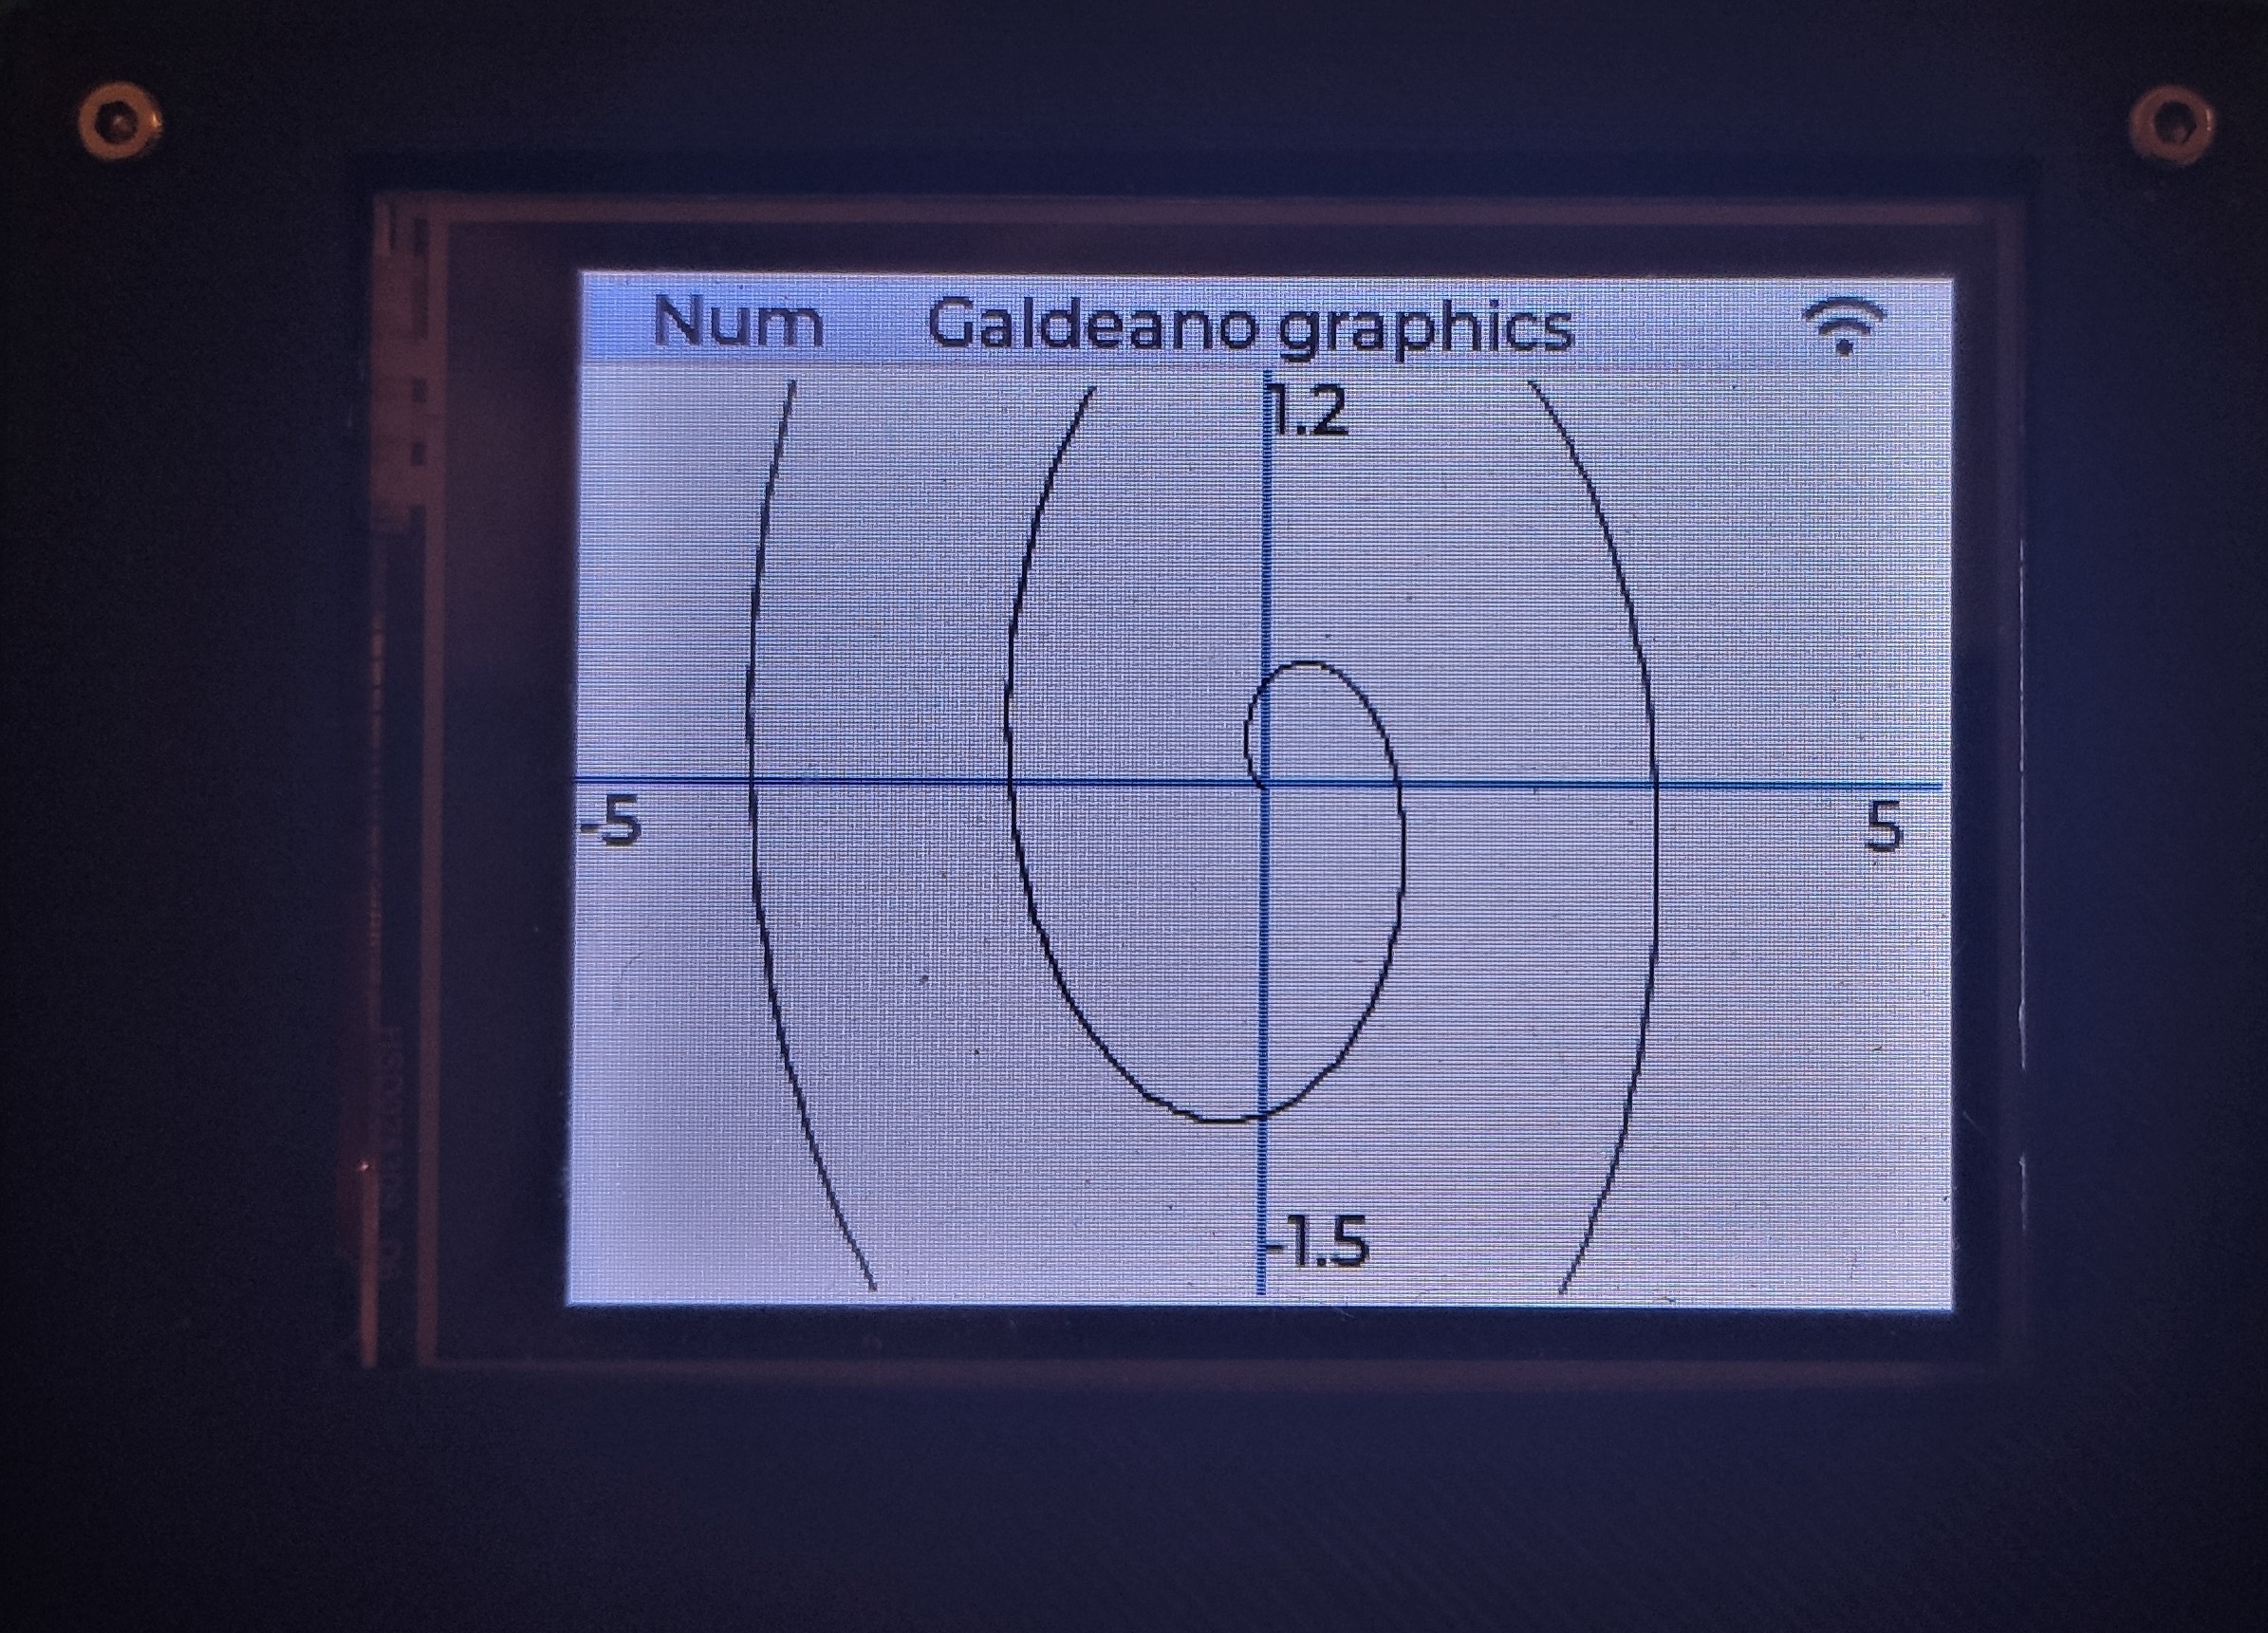
When we are on this graph screen we can press the left-right hardware buttons (yellow) and it will appearance the (x,y) coordinates.

Pressing the MENU key we can go to another program.
Discussions
Become a Hackaday.io Member
Create an account to leave a comment. Already have an account? Log In.